After adding your Data Source you can easily create a report in Looker Studio using Two Minute Reports. If you have not already added your Data Source, please check this article to add your Data Source in Looker Studio.
Creating a Report
- Go to Looker Studio.
- Click Blank Report.

- Under Connect to data, search for Two Minute Reports. You’ll be provided with all connectors TMR offers. Alternatively, you may select a data source from the TMR website.
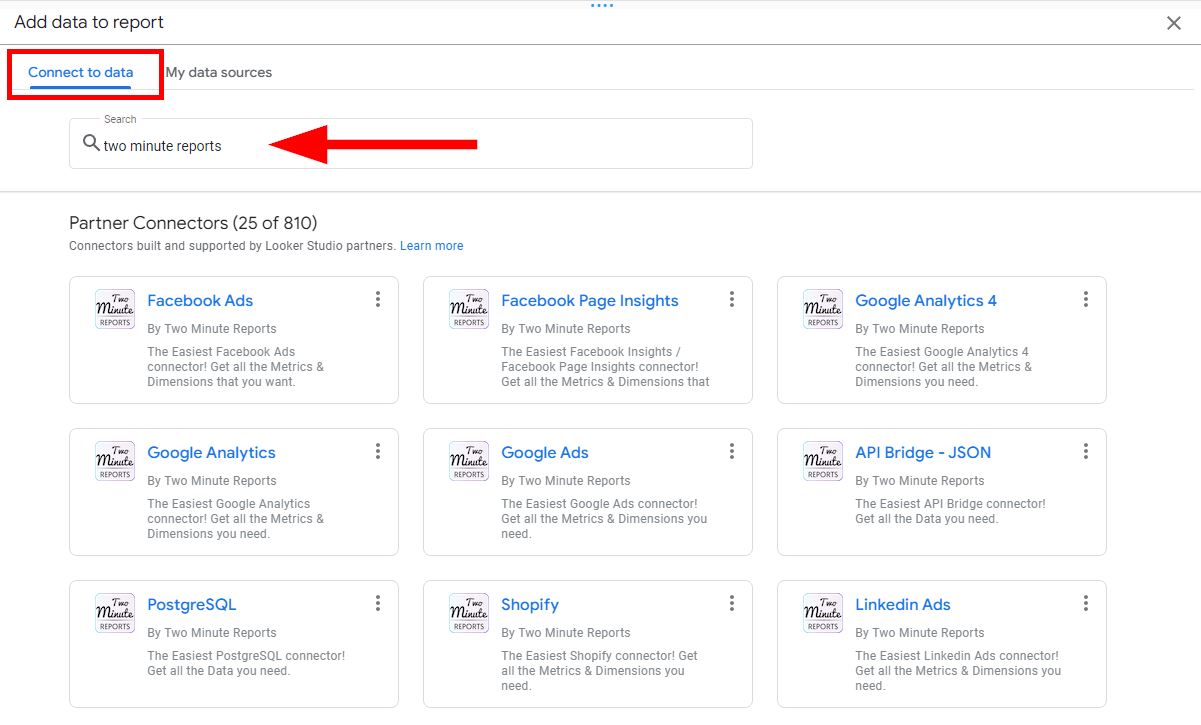
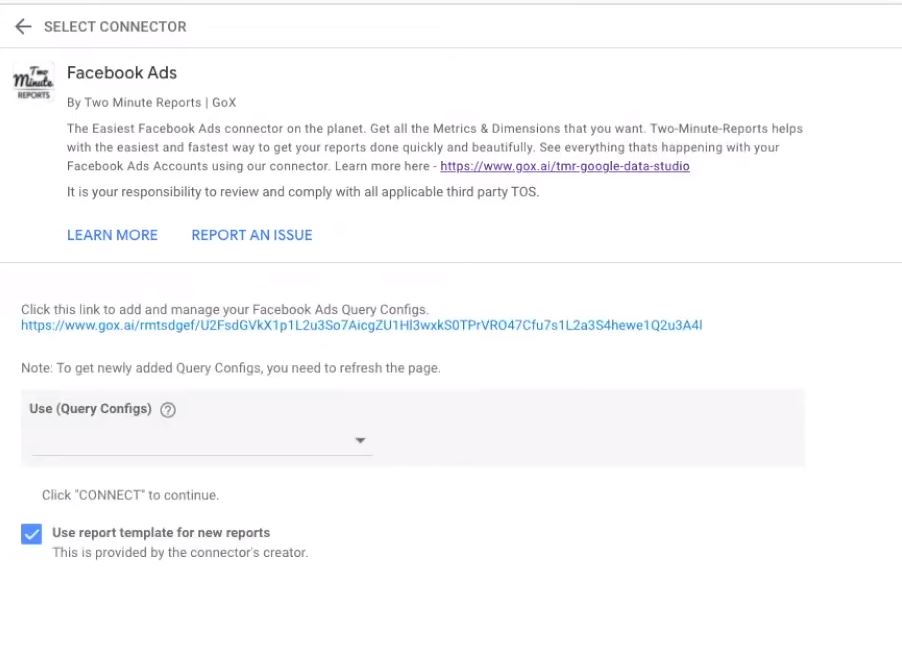
- Select the data source you want. In this example, it’s Facebook Ads.
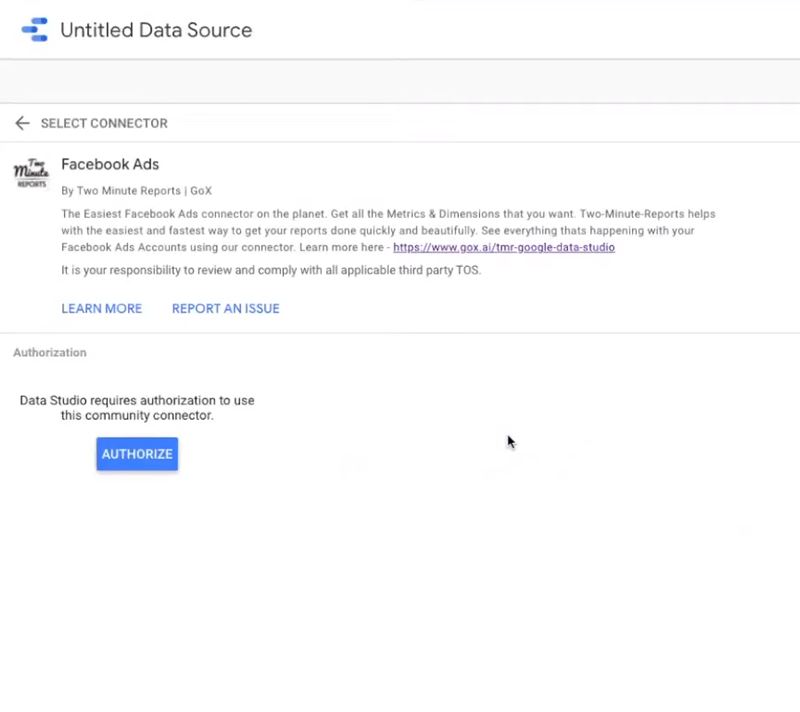
Authorize the Data Source
- Once you select a TMR data source, you need to give authorization and permissions. This authorization process depends on what tool you want to connect to. Authorize Looker Studio first.
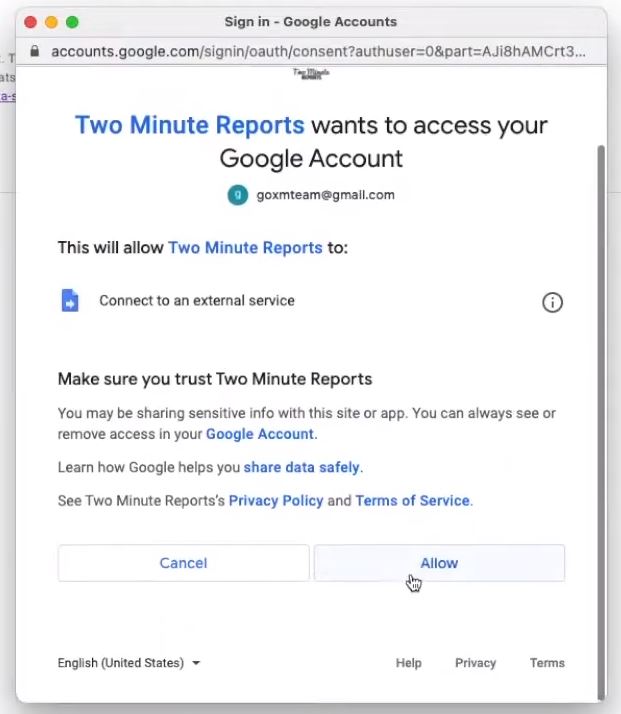
- Then authorize Facebook Ads by logging into your Facebook account. You may name your data source as well.

- Complete the authorization in Facebook. And, you’ll see a popup “Data Source Added Successfully”. Go to our Facebook
Customize Query Configuration
- Next is to customize query configurations. Name your query config, select your data source you created earlier, then select the Ad account from Facebook. This is a Facebook Ads example and will depend on what data source you want to connect.
- Click on Save.

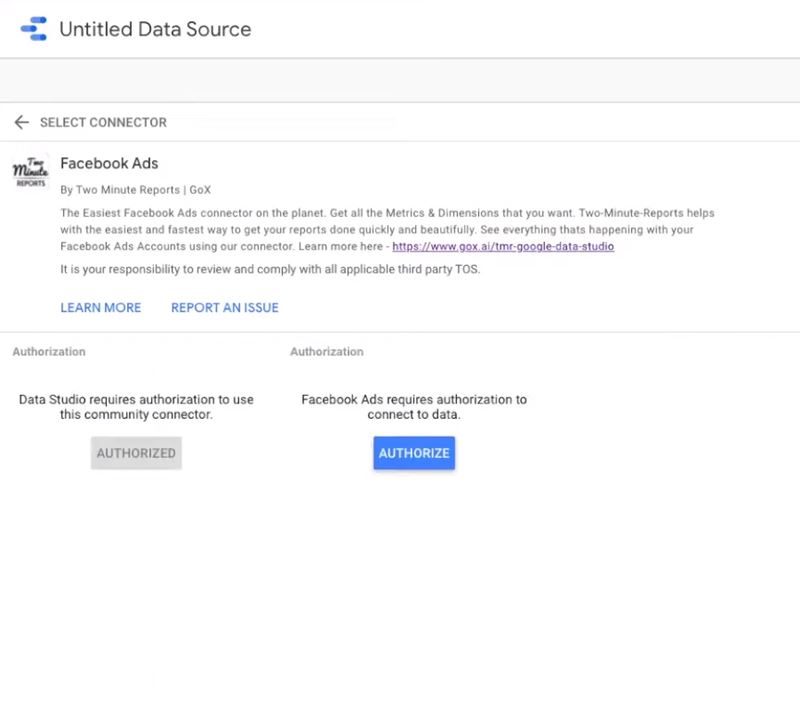
- Authorization should be complete and data source has been connected. The authorization is complete if there are no more blue Authorize button appears.
- Click the Connect button on the upper right of the page or click the Add button on the lower right of the page. This connects the data source to a newly created Looker Studio canvas.
Adding Dates and Charts
Once you are on the Looker Studio canvas, you can now add dates and charts on the report.
- Click Add a control at the top.
- Select date control.
- Drag it on the canvas.

- Click Add a chart.
- Select the time series chart.
- Drag it on the canvas.

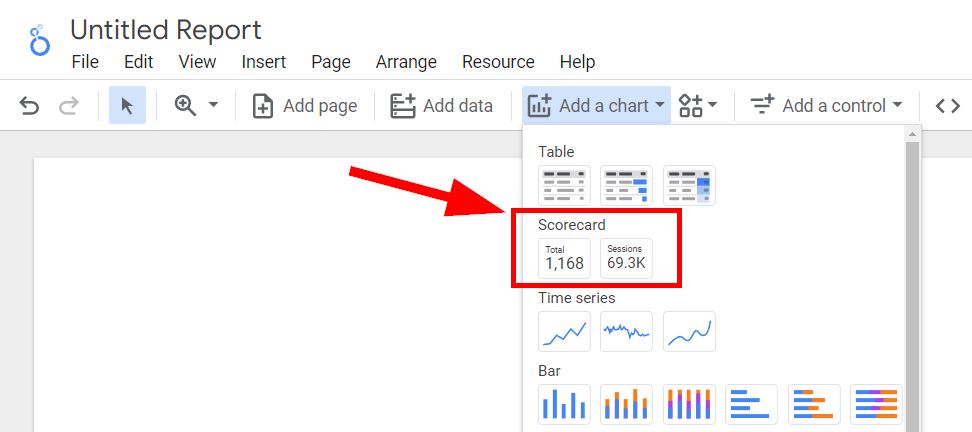
- Click Add a chart.
- Select Scorecard.
- Drag it on the canvas.
- Select a chart you added earlier to modify.
- On the right side sidebar click below Metric.
- Type in CPM and select it.

The metric from that data source is now on the report.
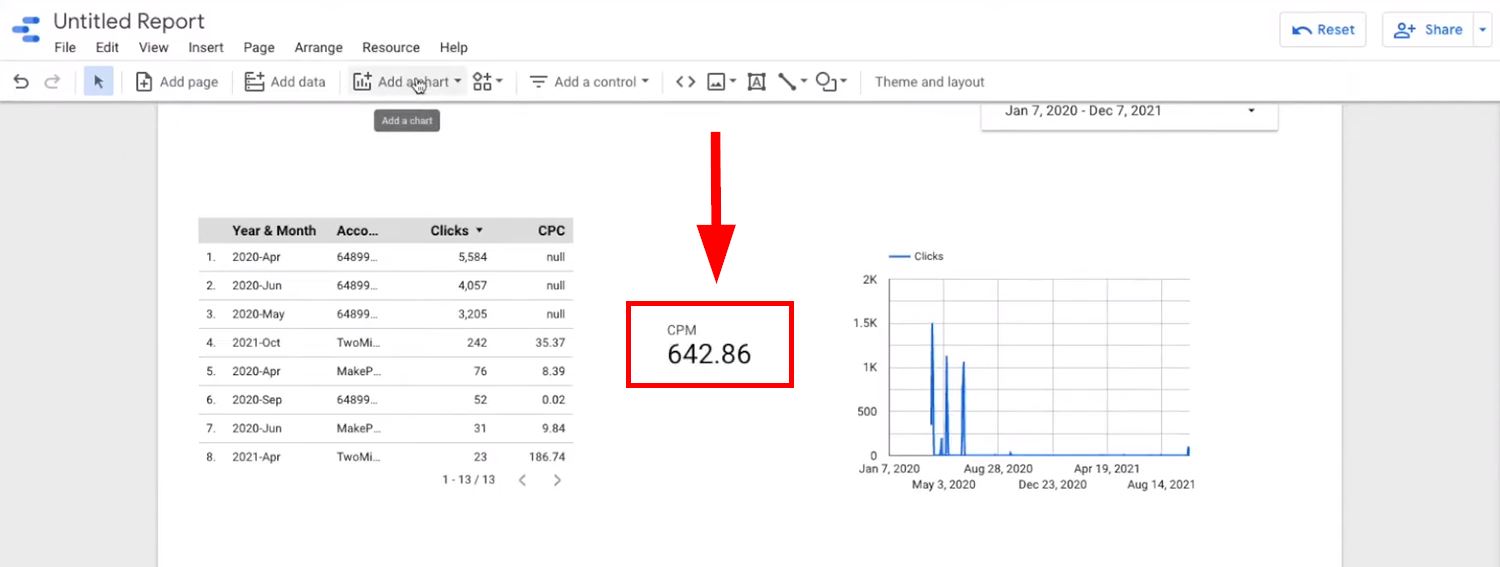
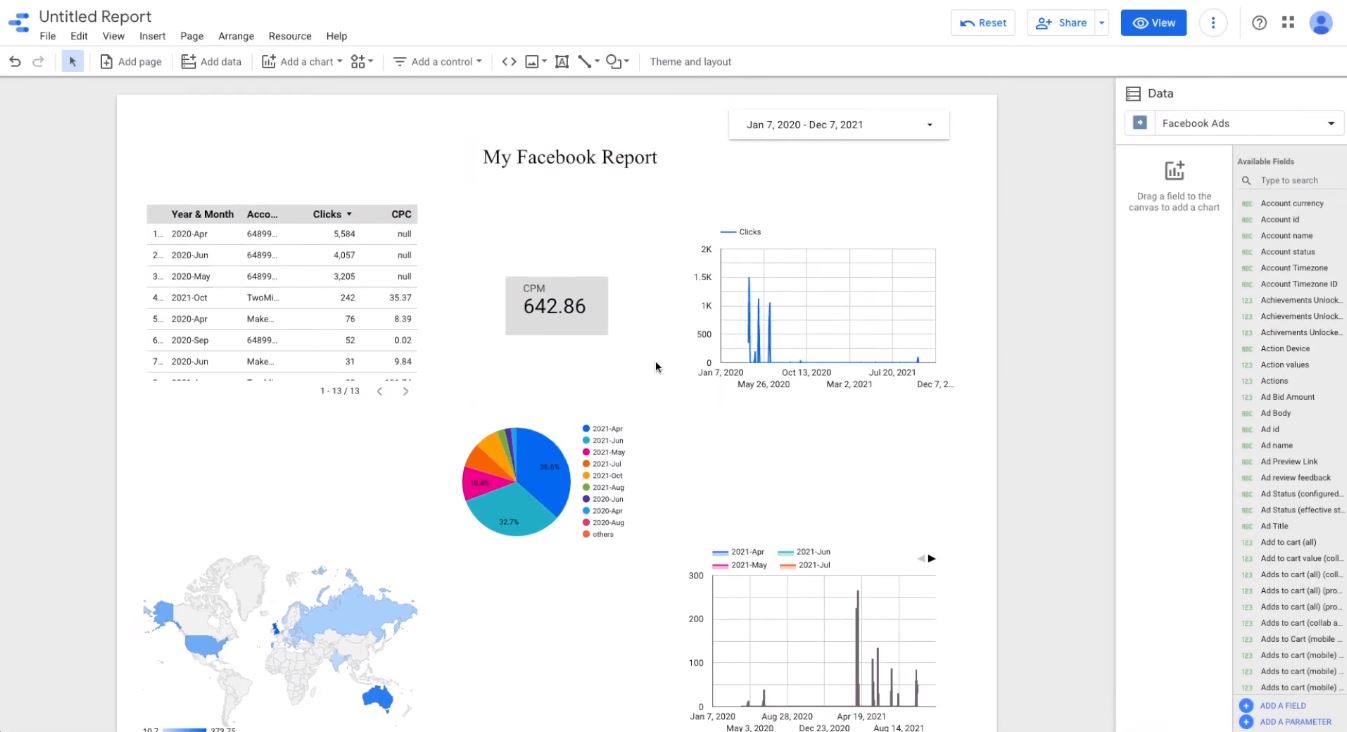
If you add more charts and a text box for labels, you’ll have something like this:
You can select various Looker Studio templates if you would rather not create a report manually.