Connect Shopify to Looker Studio: Tutorial & Free Templates (2024)
- Connecting Shopify data to Google Looker Studio and Automate It
- Start using these quick templates for google sheets Now
- Why Connect Shopify to Looker Studio?
- Major KPIs to have in your Shopify Looker Studio Report
- Get Shopify data in Google Sheets too!
- Connect other Platform Data Sources with Google Sheets
Connecting Shopify data to Google Looker Studio and Automate It
We will discover the step-by-step guide to pull data from Shopify and add it to your Google Data Studio and how you can visualize Shopify data like custom metrics, sales data, marketing data, store’s performance, and so on. Our state-of-the-art solution will not only help you automate and extract and add Shopify to Looker Studio but help you save time. Our holistic Shopify reports will analyze all aspects of your Shopify account performance in detail, visualize Shopify data and add to your Google Looker Studio and create reports, so you don't have to write any code. Here's how our Shopify Studio integration works.
- Use the Two Minute Reports and search for our Shopify connector.
- Then connect Shopify to Google Data Studio and complete building Shopify reports.
This can be done in two ways.
Method 1: Use Two Minute Reports for Shopify Data Studio
OR
Method 2: Choose from our thoughtfully designed built-in Templates to create a report.
Method 1: Connect Shopify to Looker Studio Using Two Minute Reports
 Click on Products -> Two Minute Reports for Looker Studio. It will redirect you to the Two Minute Reports page. Now click on the Accounts option.
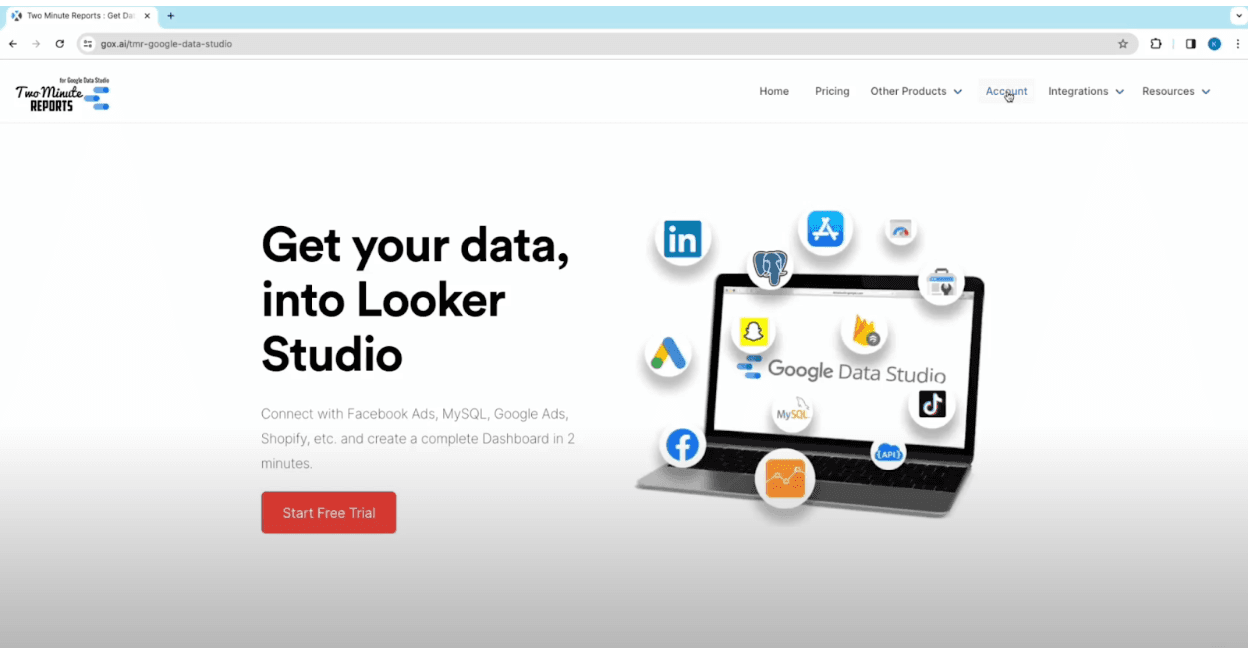
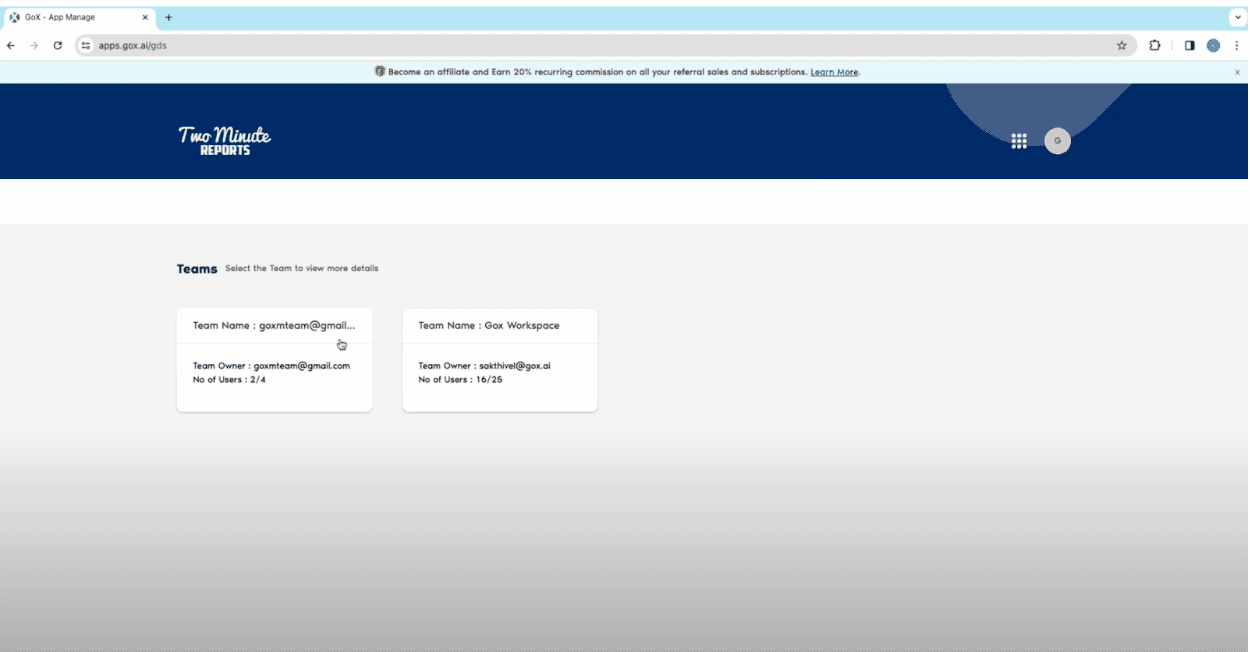
- You will see the names of all the teams you can collaborate with. Click on the team from the list to work with.
- You will be redirected to the Data connectors page. You will see connectors for various channels and platforms. Select Shopify from the list.

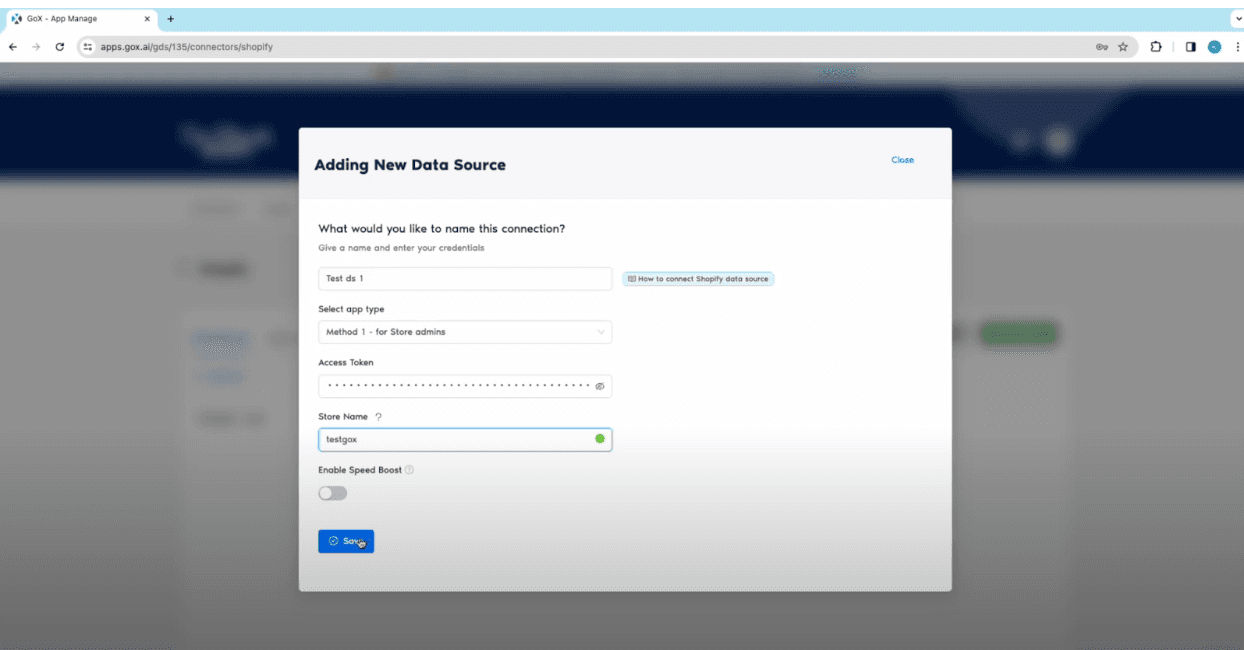
- You will now see options to fill in data sources. Click on Add New.

- Fill in the details for connection name, select app type, mention access token, and give the Shopify stores you wish to build a report for. Click here to learn on, How to generate access token. Now click on Save and authorize access.
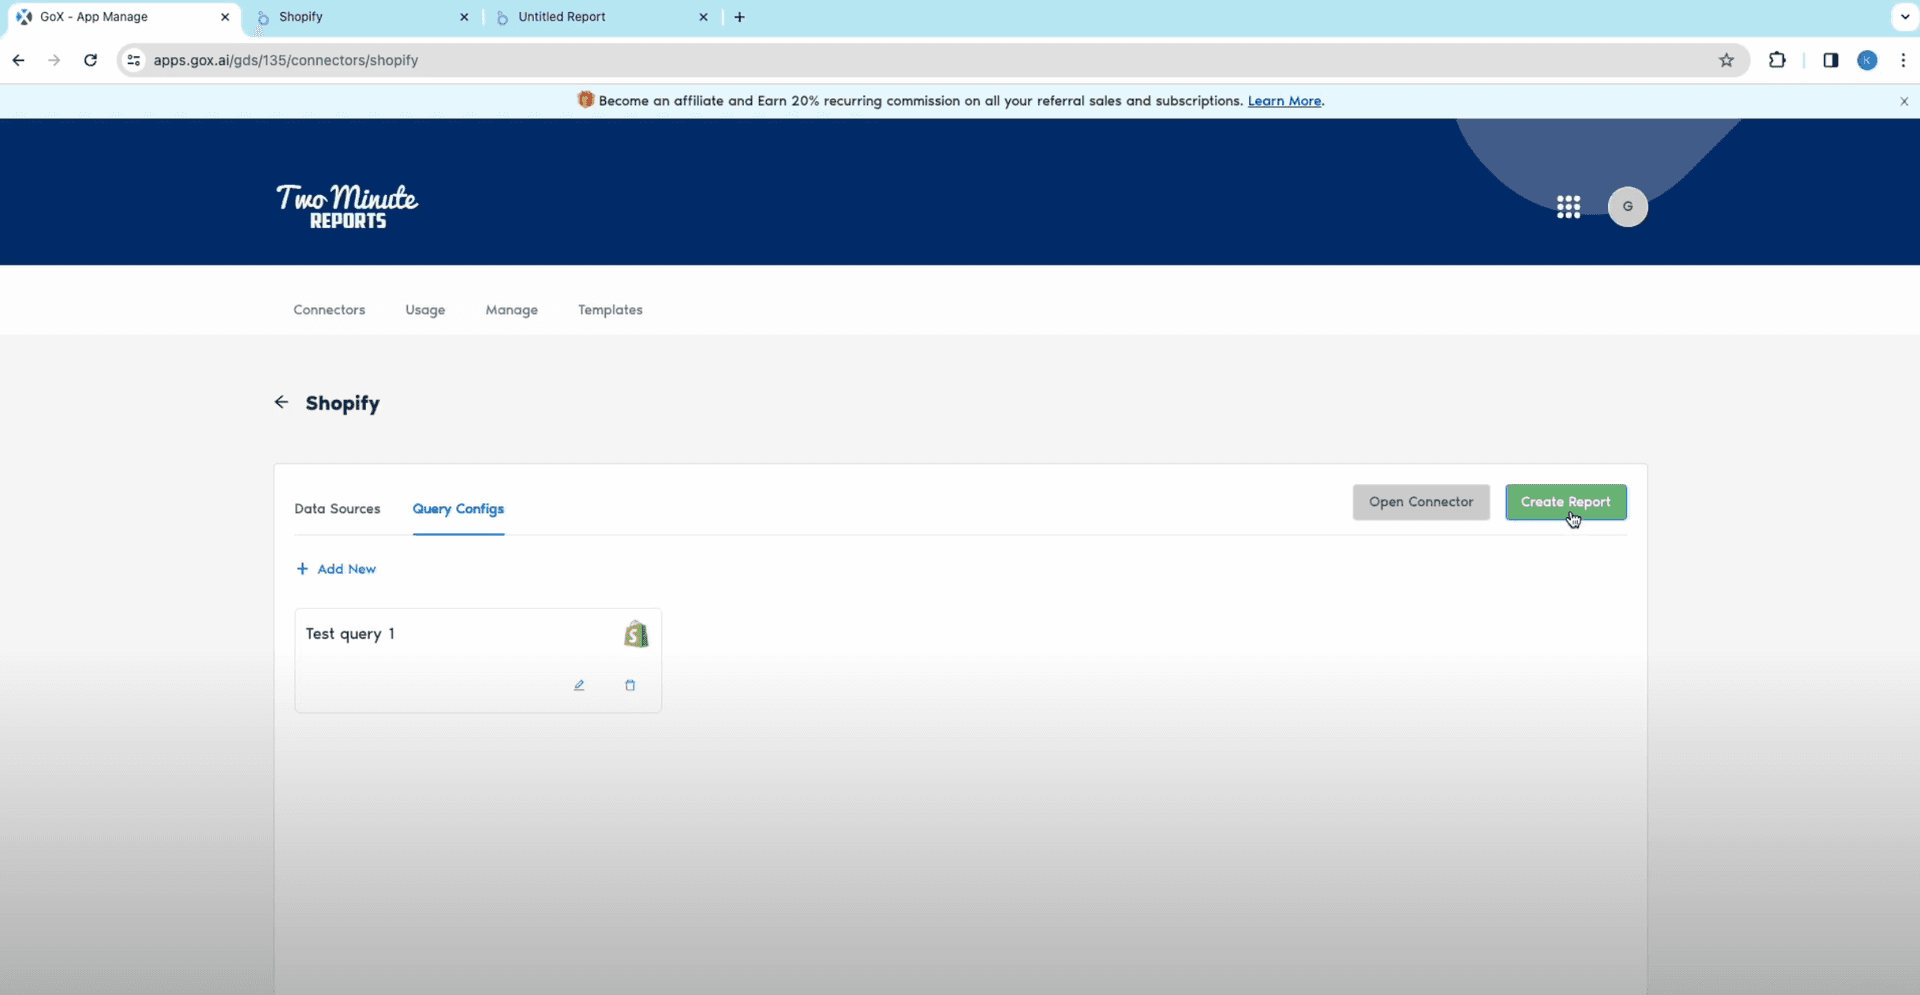
- Once you have successfully connected to your Shopify store, move to the Query configs tab and click on Add New.
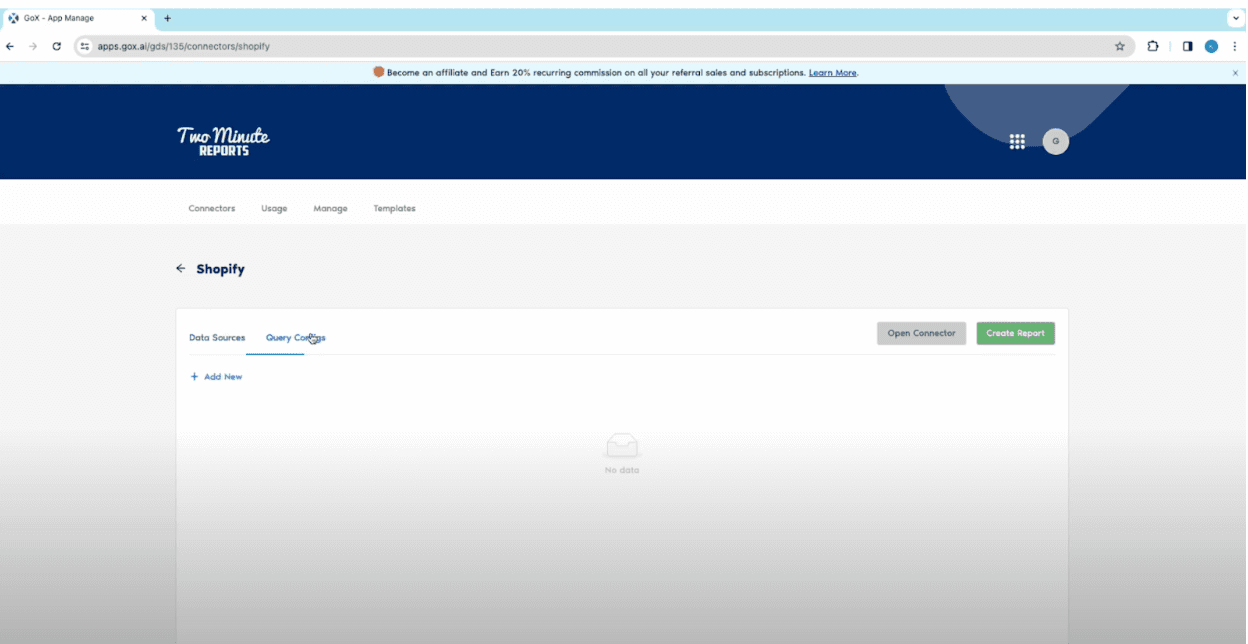
- Select the Data Source you would like to use for Query Config from the drop down menu and click on Next.

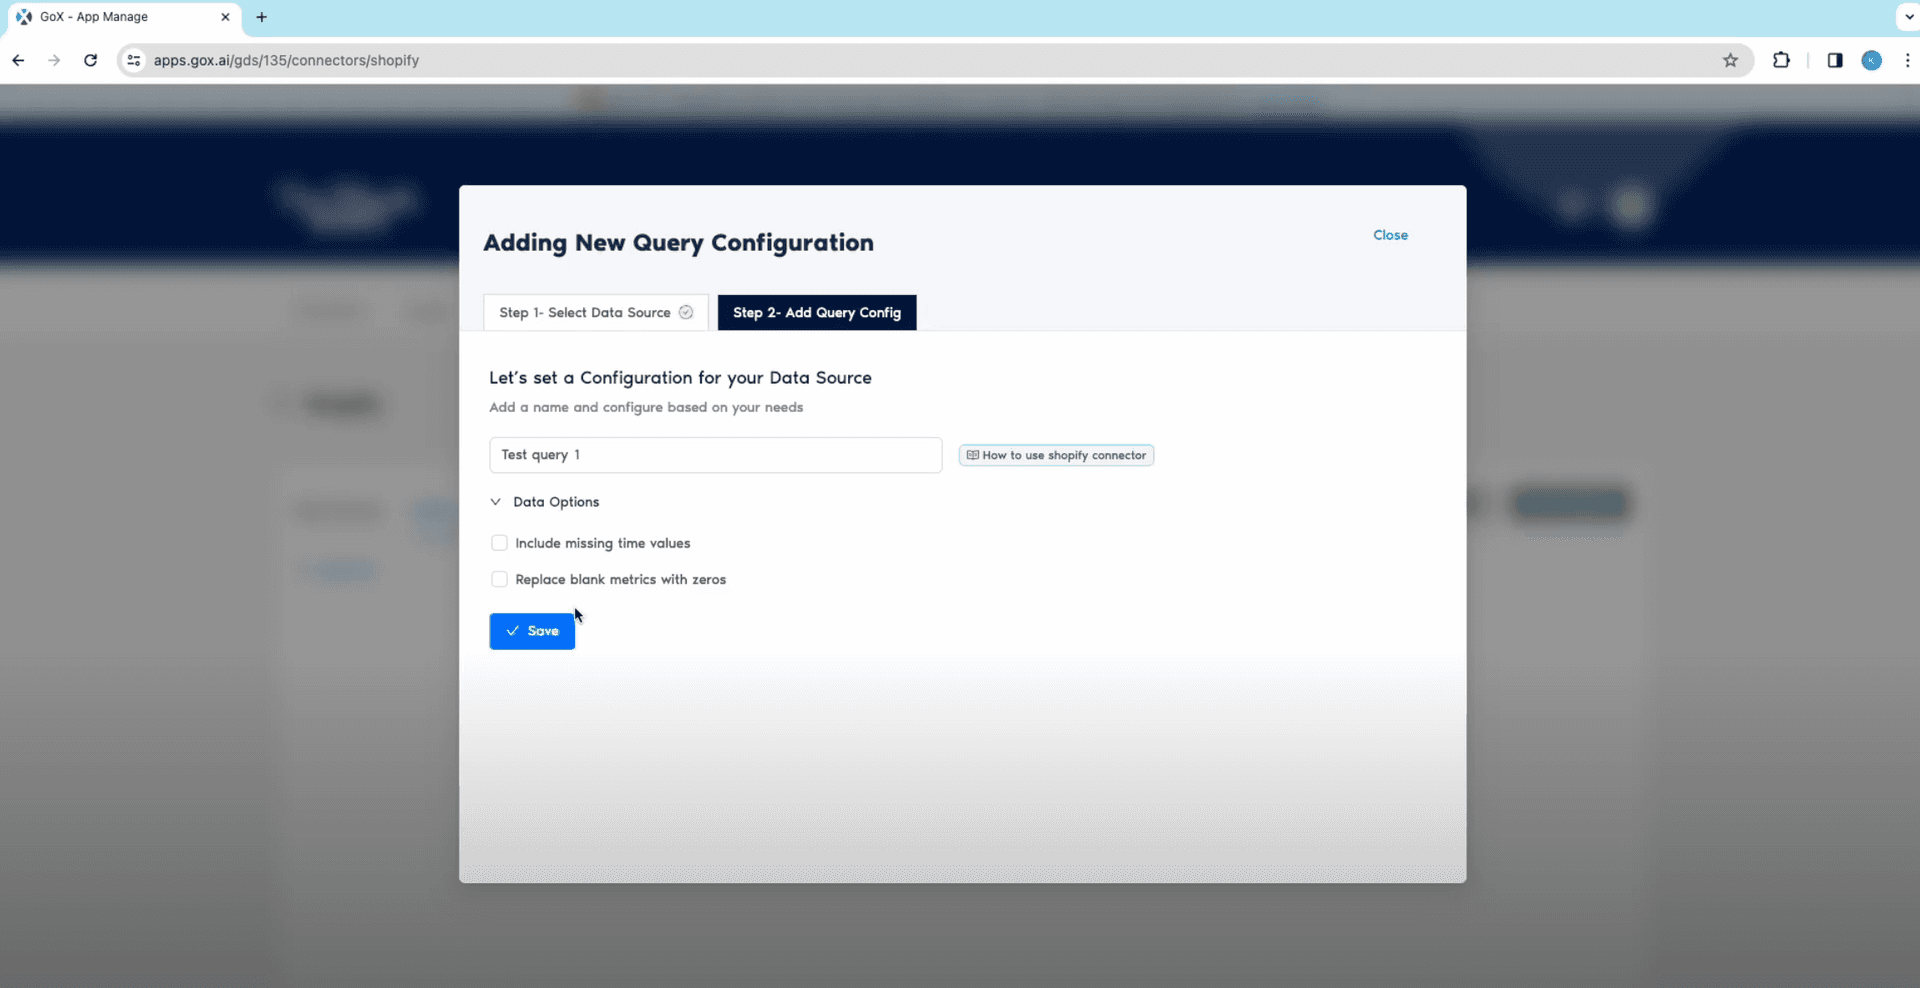
- Now set a configuration for your data source, and click on Save.
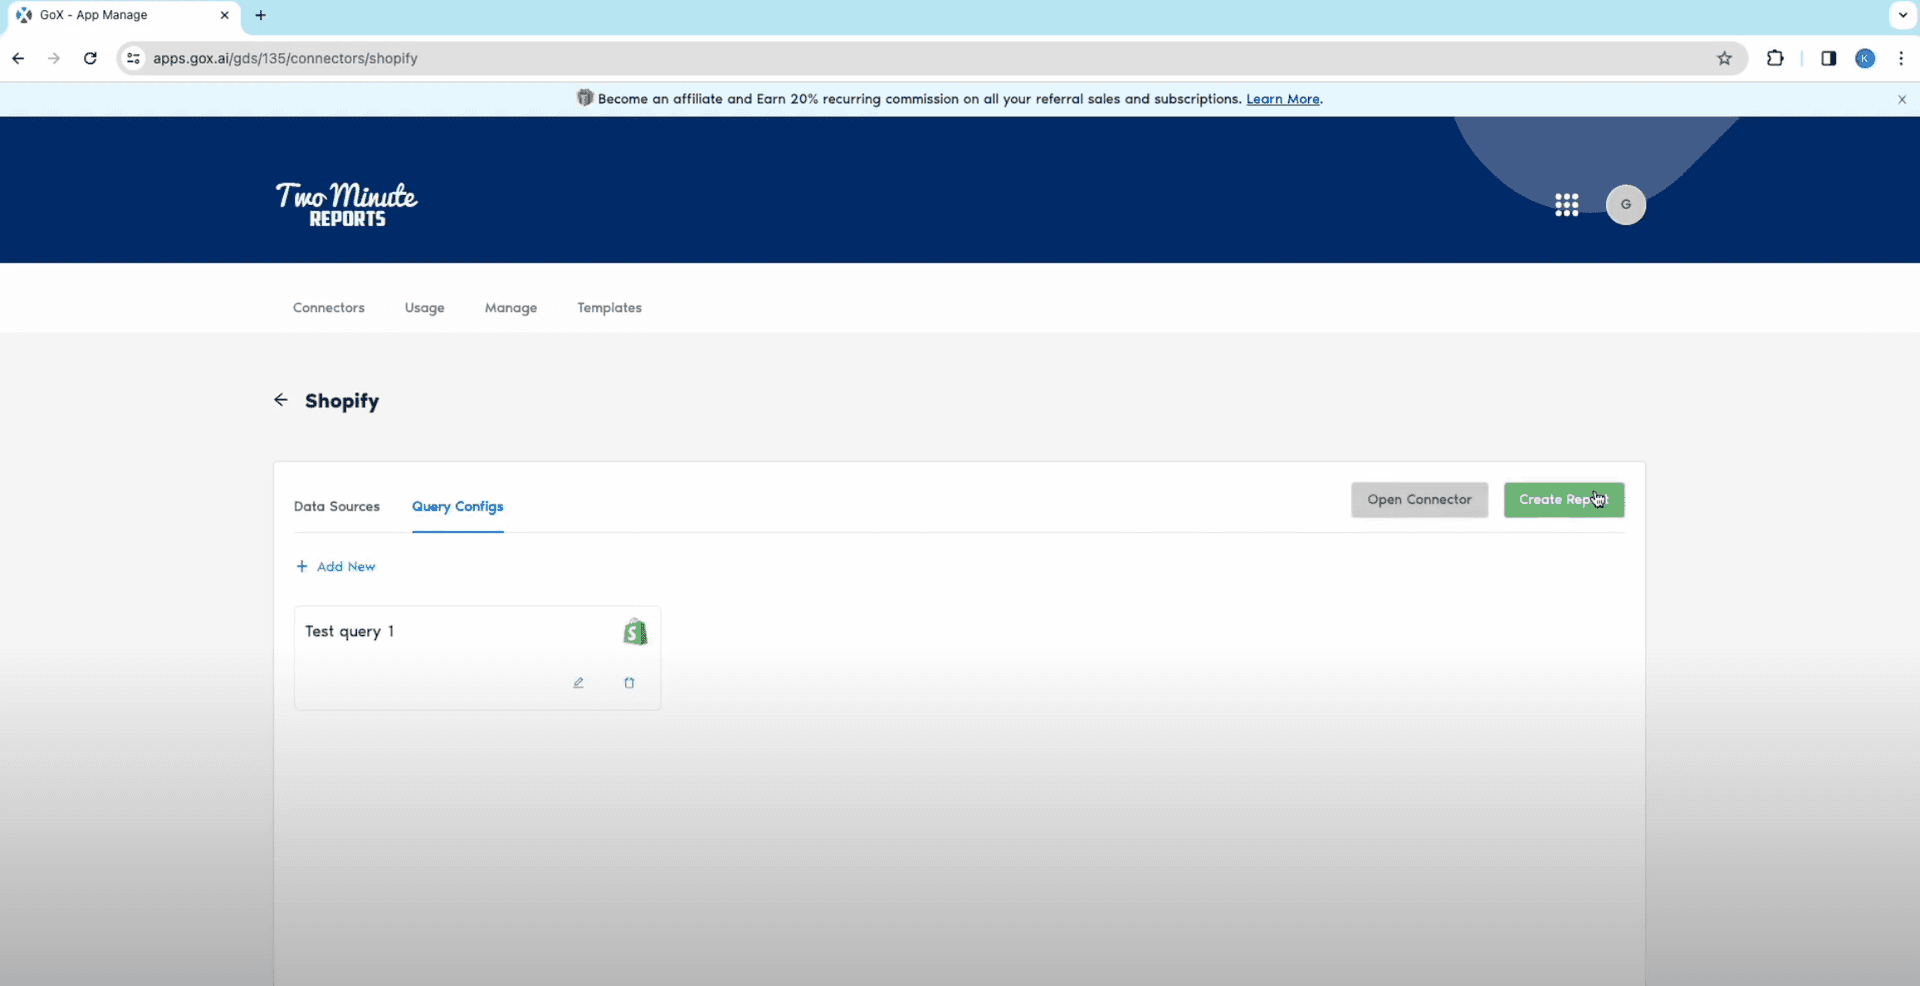
- Click on Create Report.
- Select the Query Configuration you would like to use and click on Next.
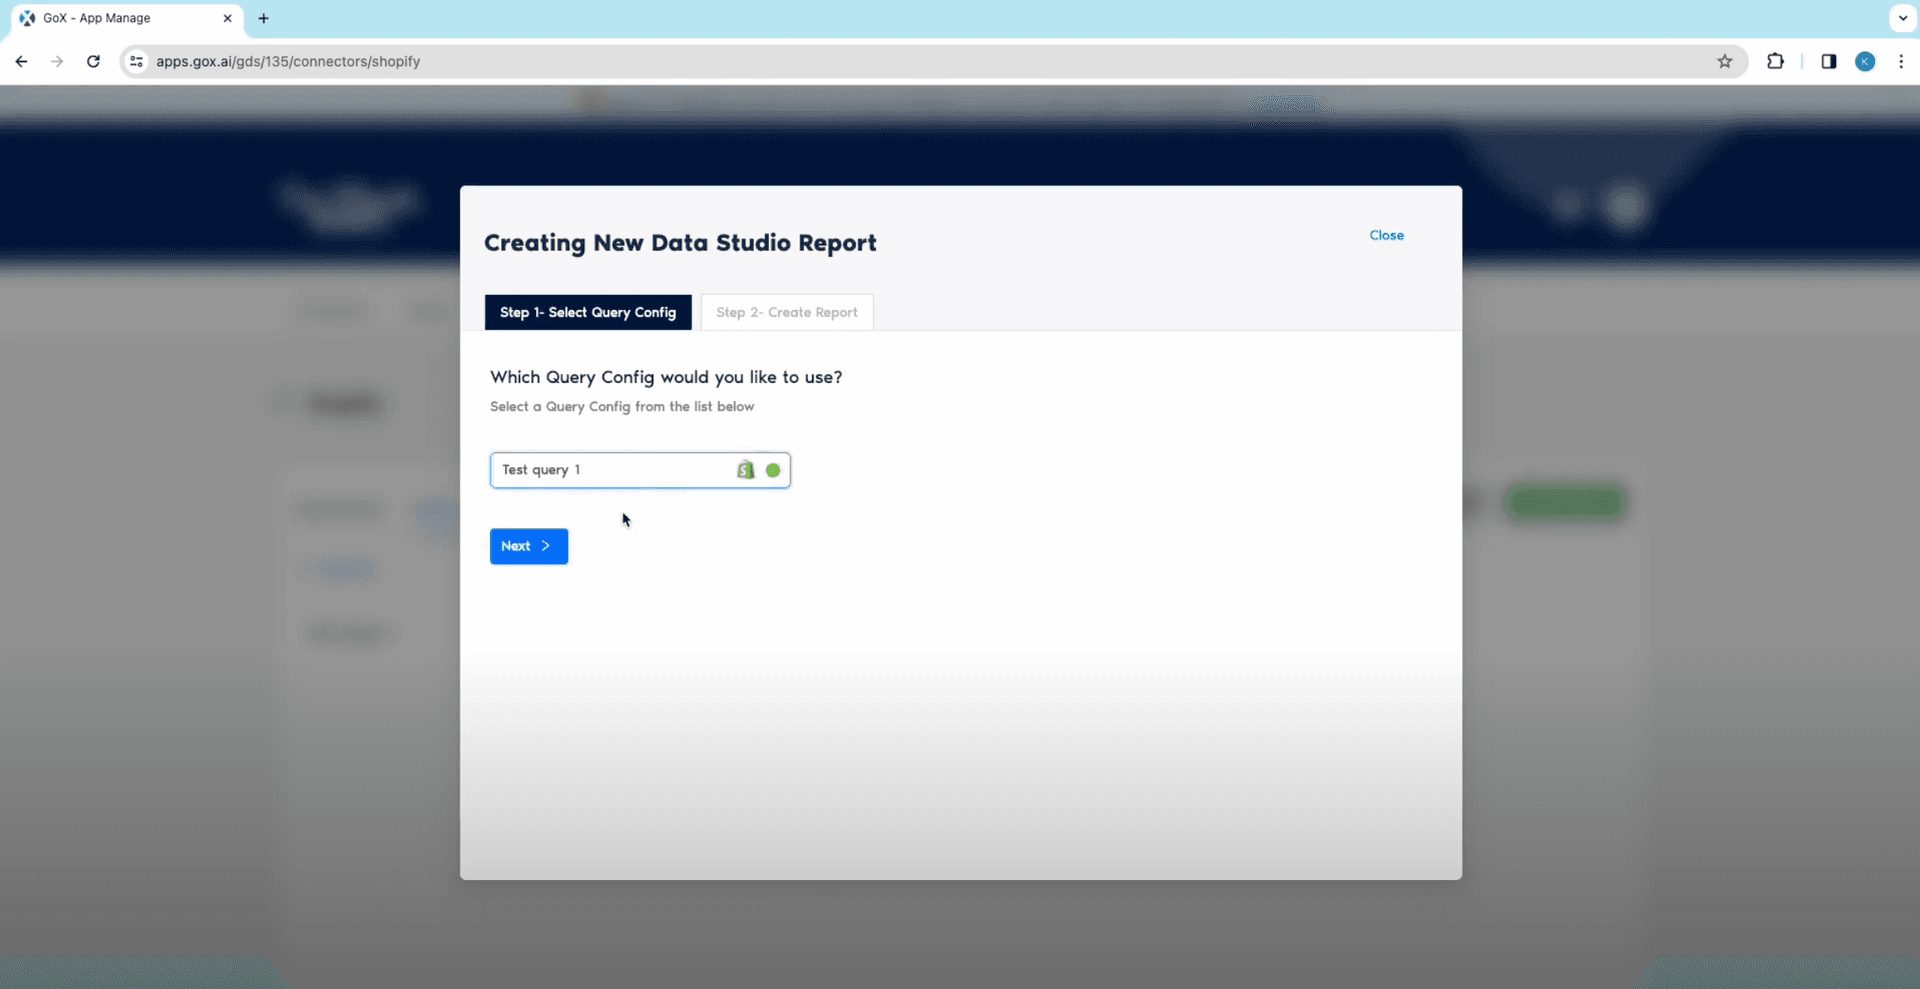
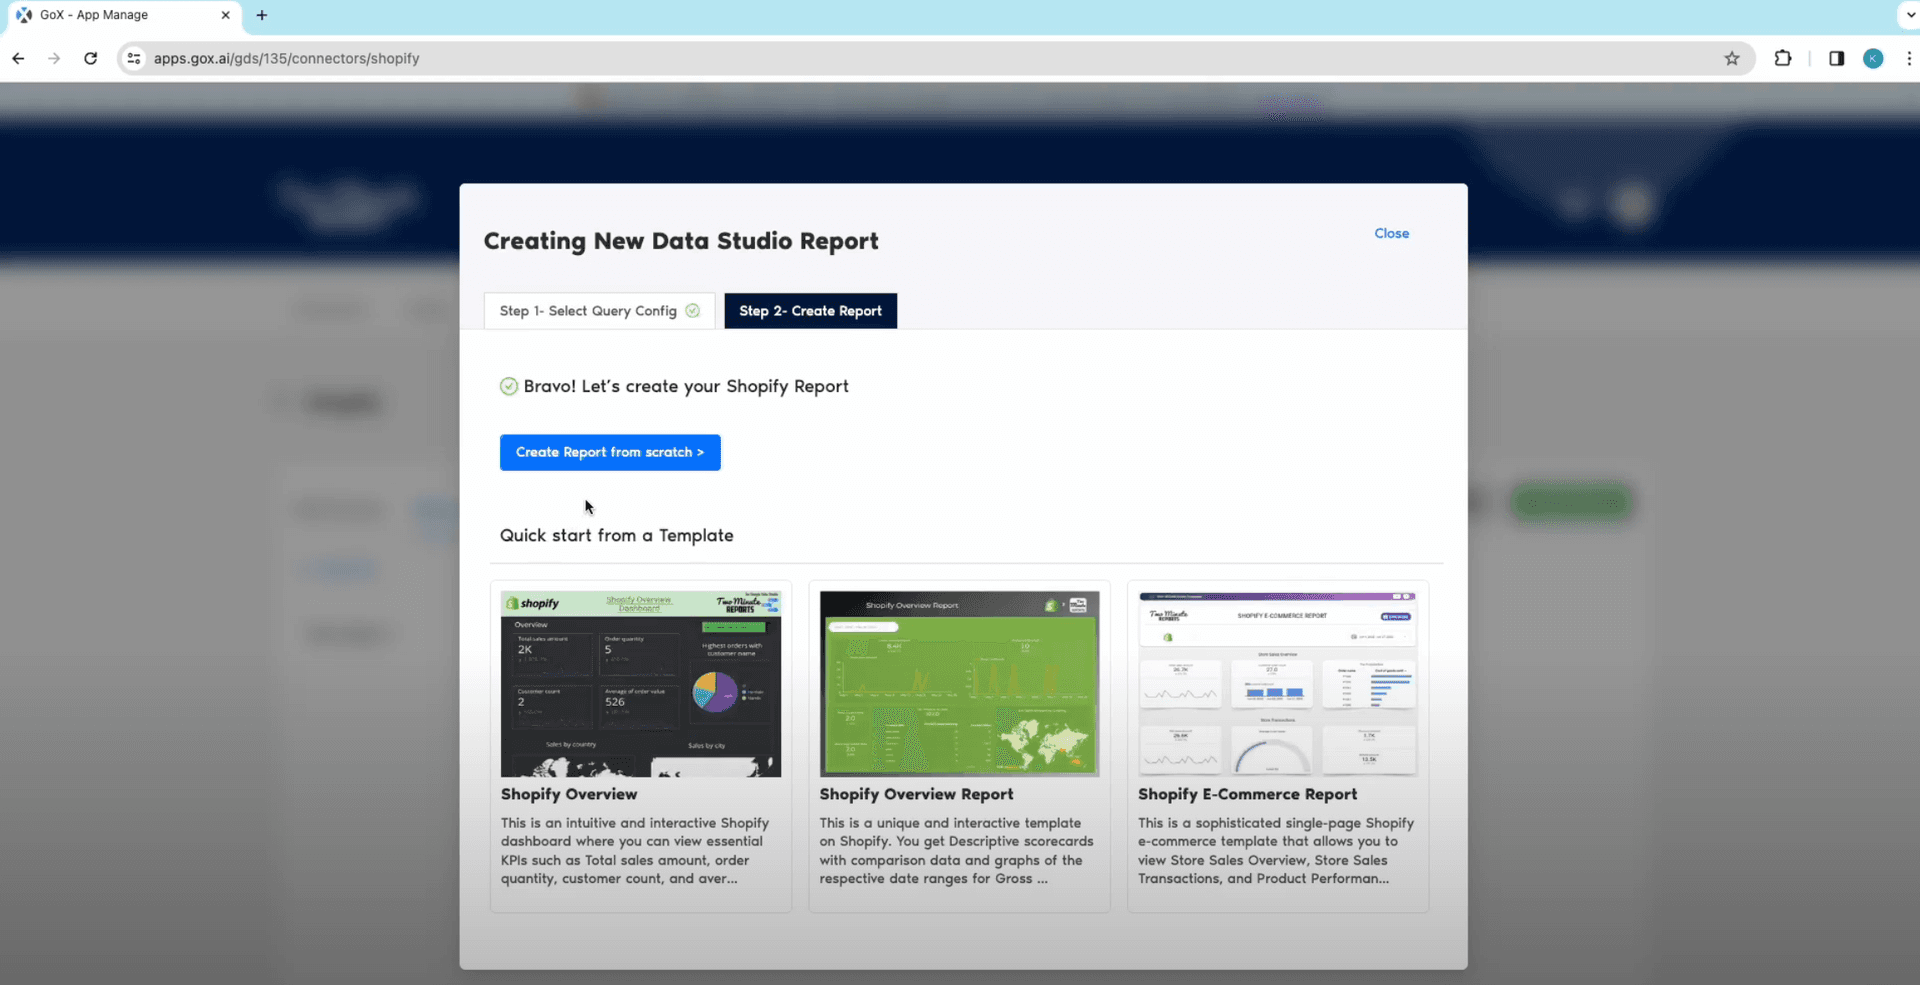
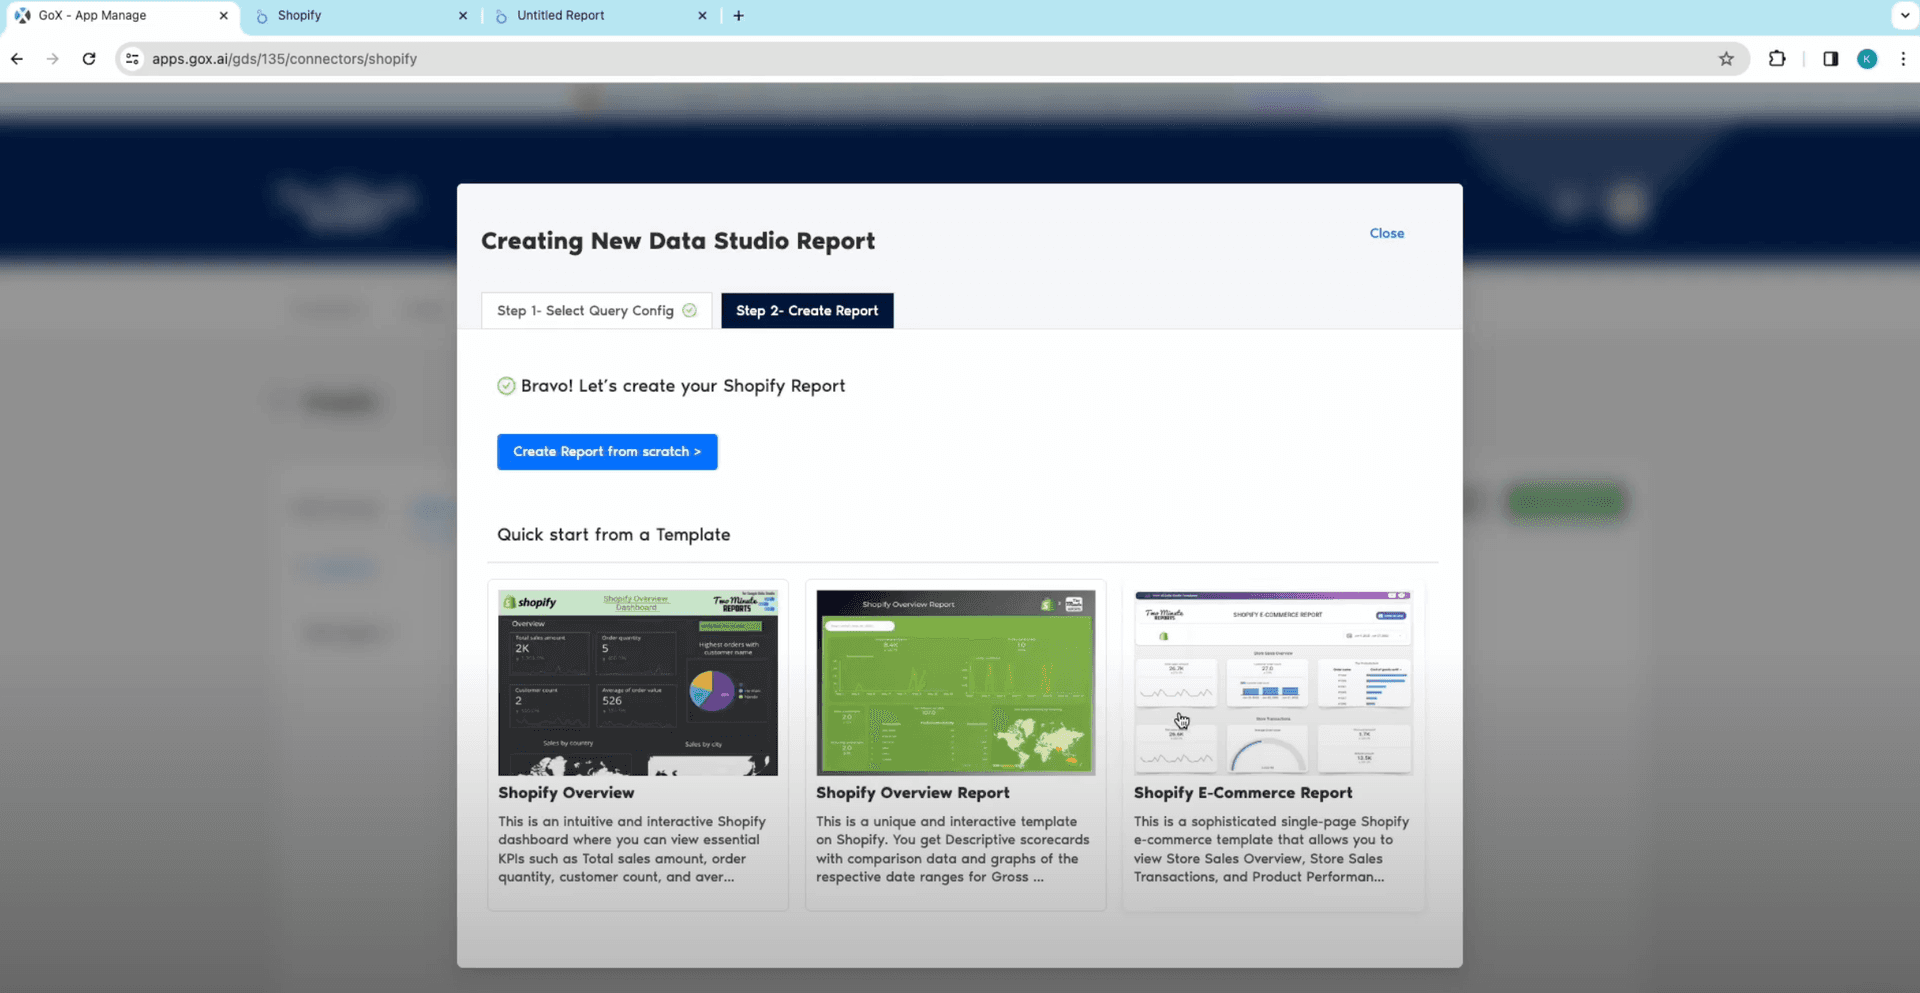
- Once you are done setting your Data Sources and configurations, click on Create Report From Scratch.
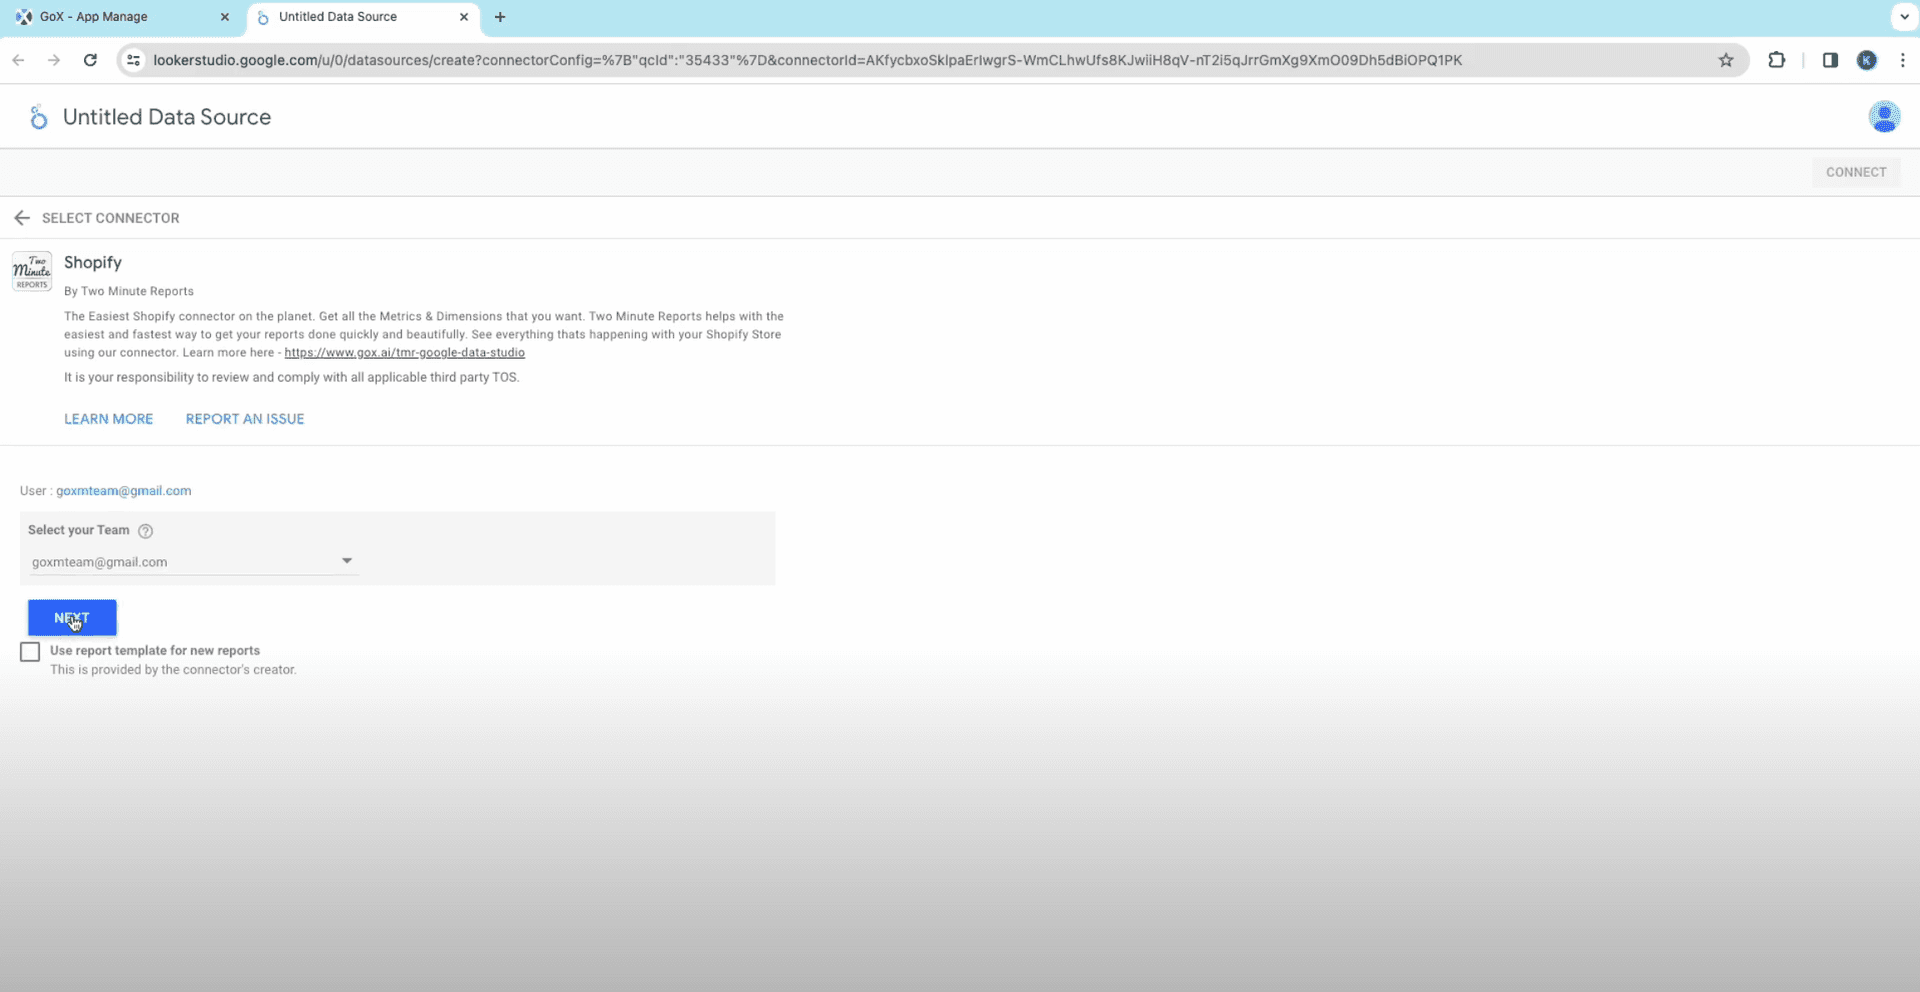
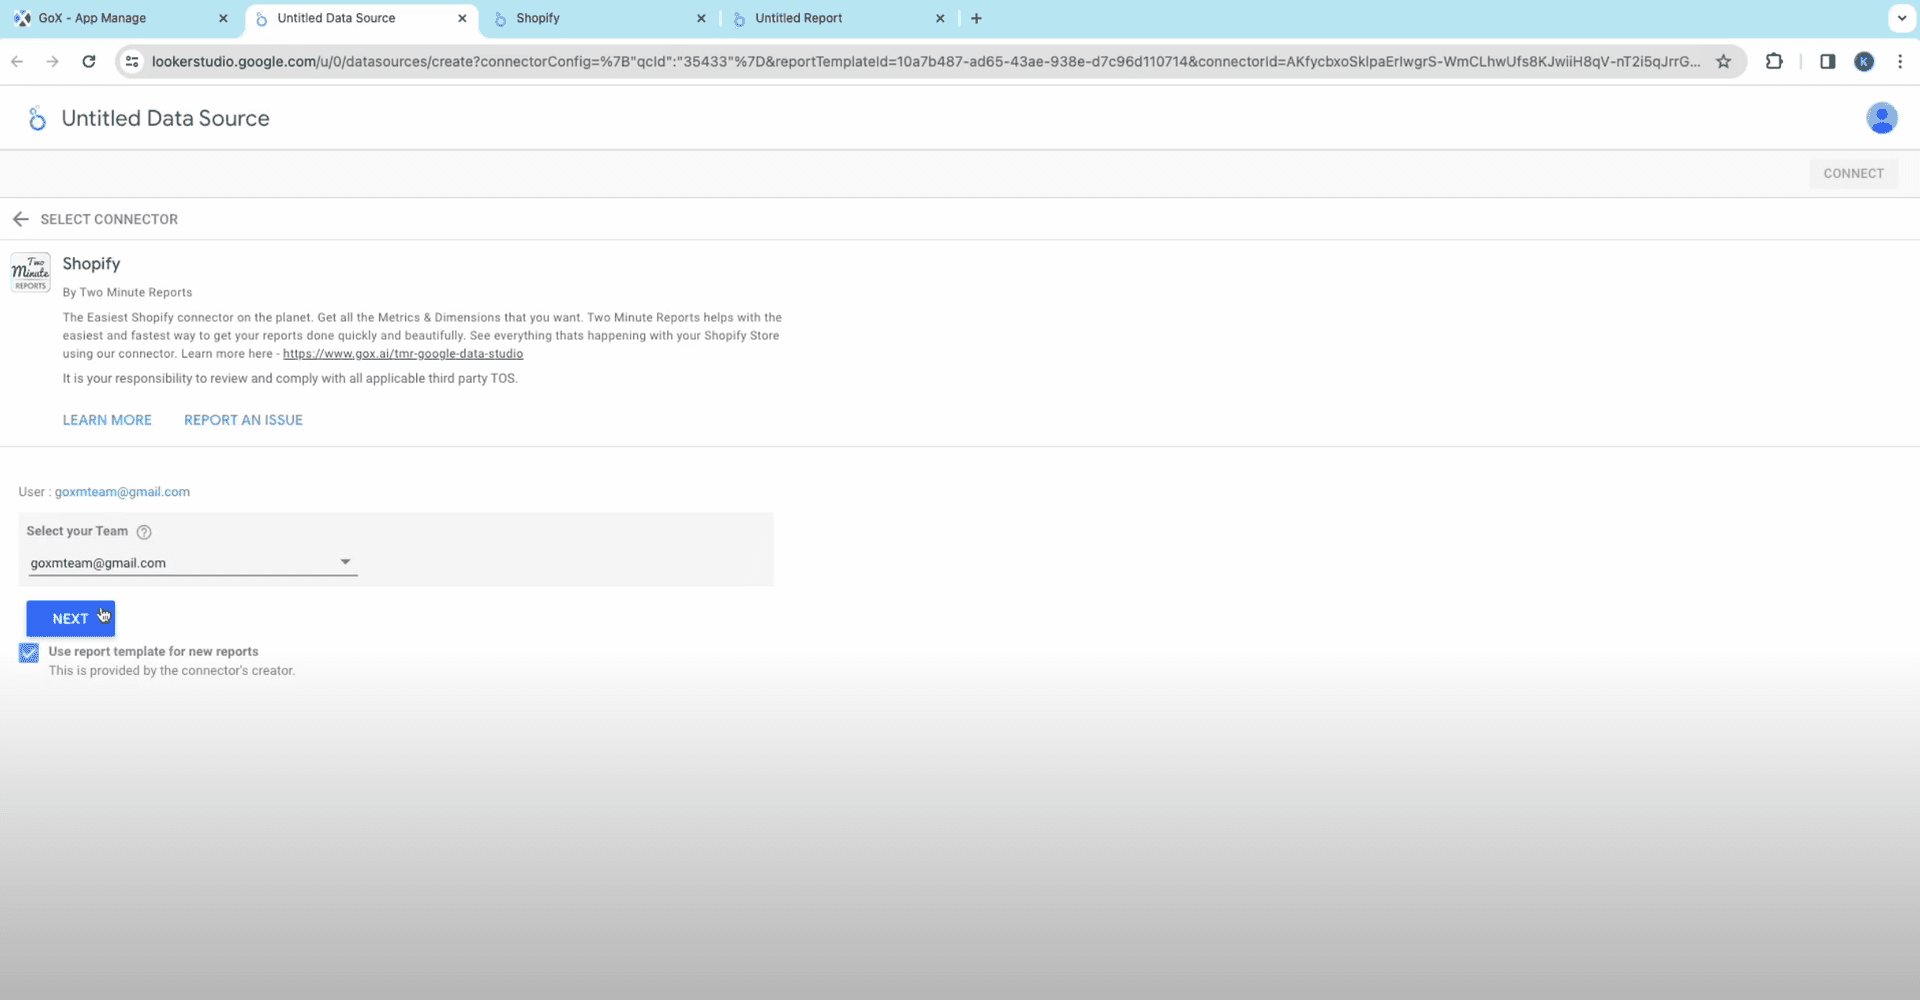
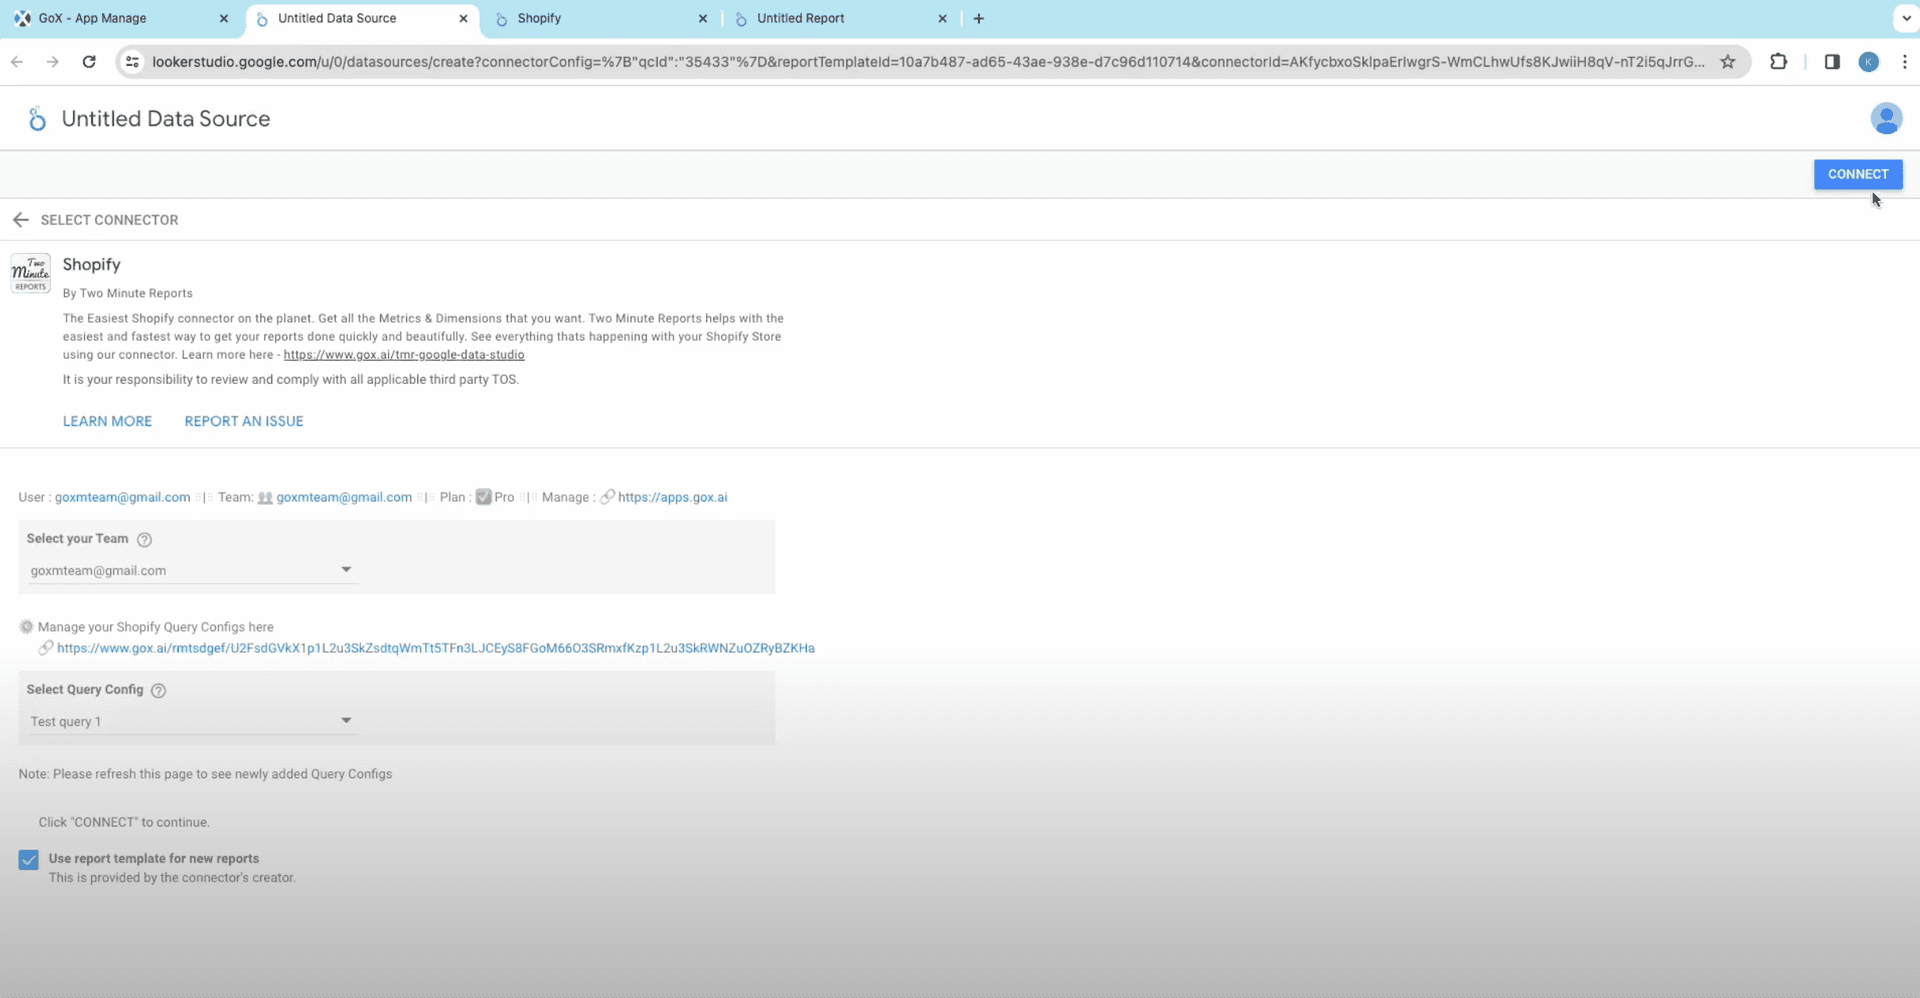
- Select the team and click on next.
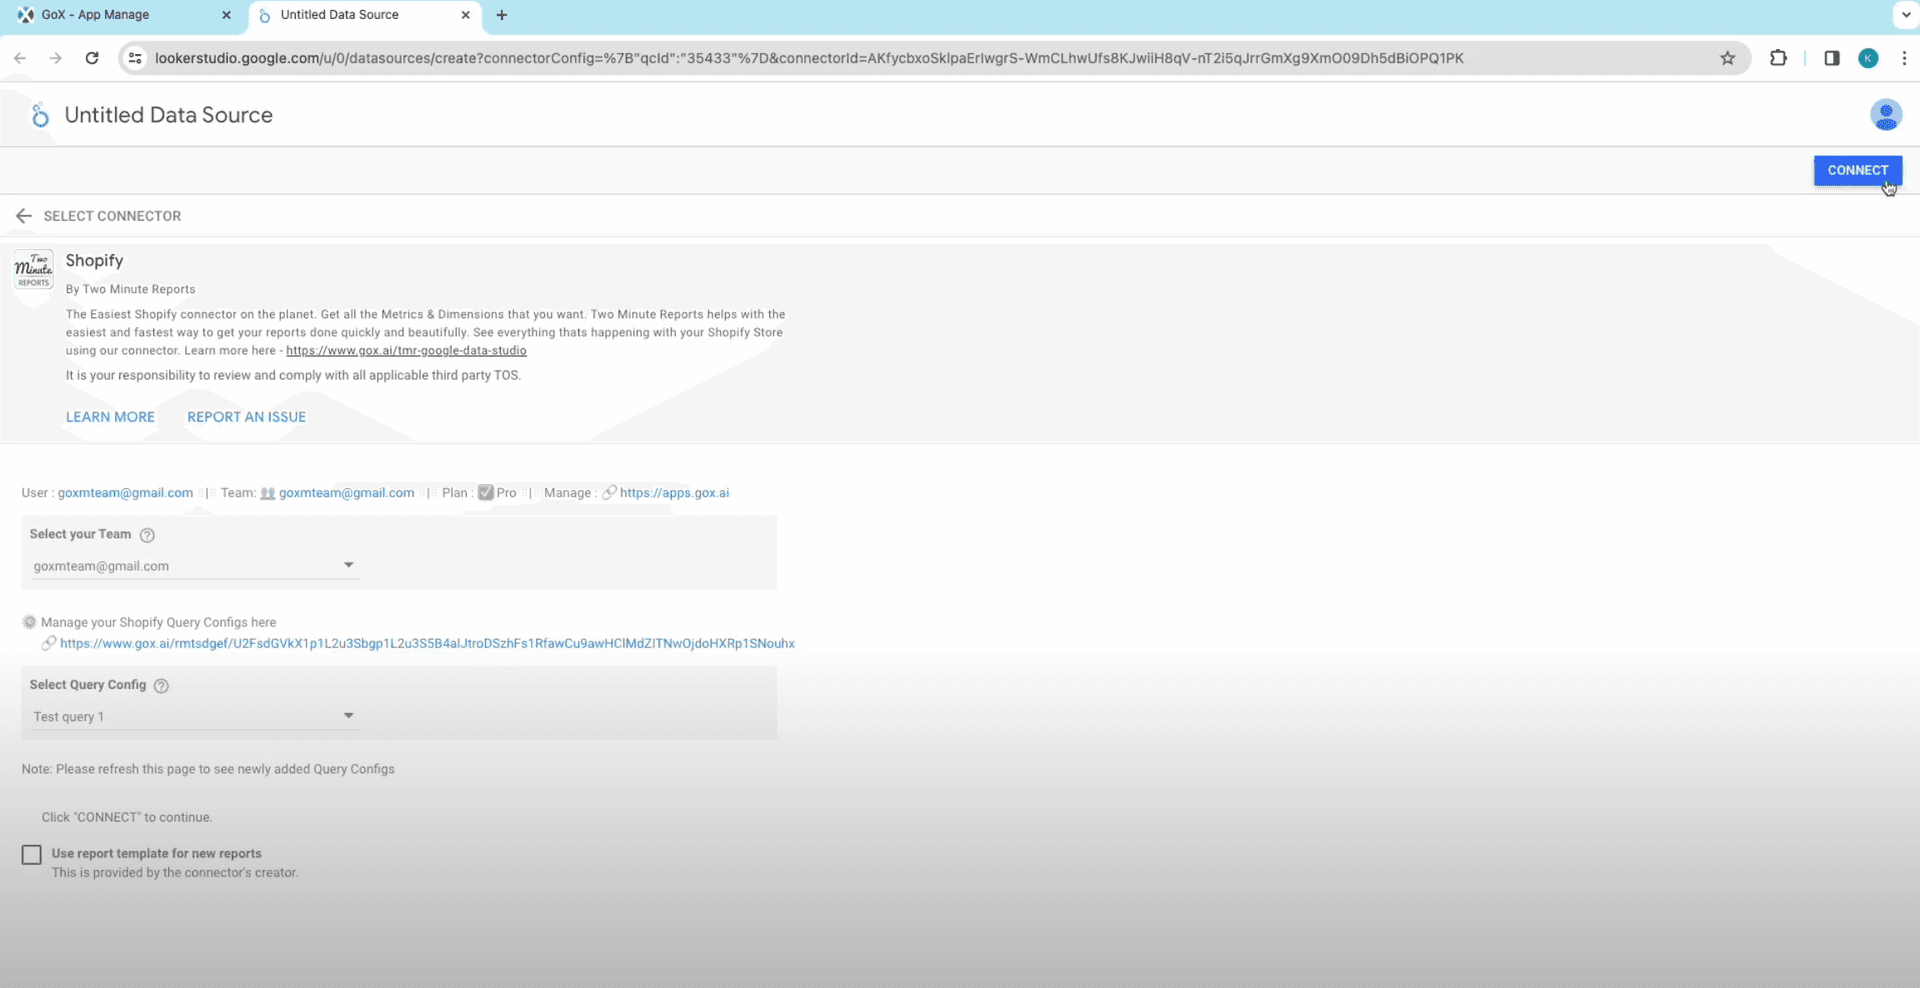
- Verify your configurations and click on Connect.
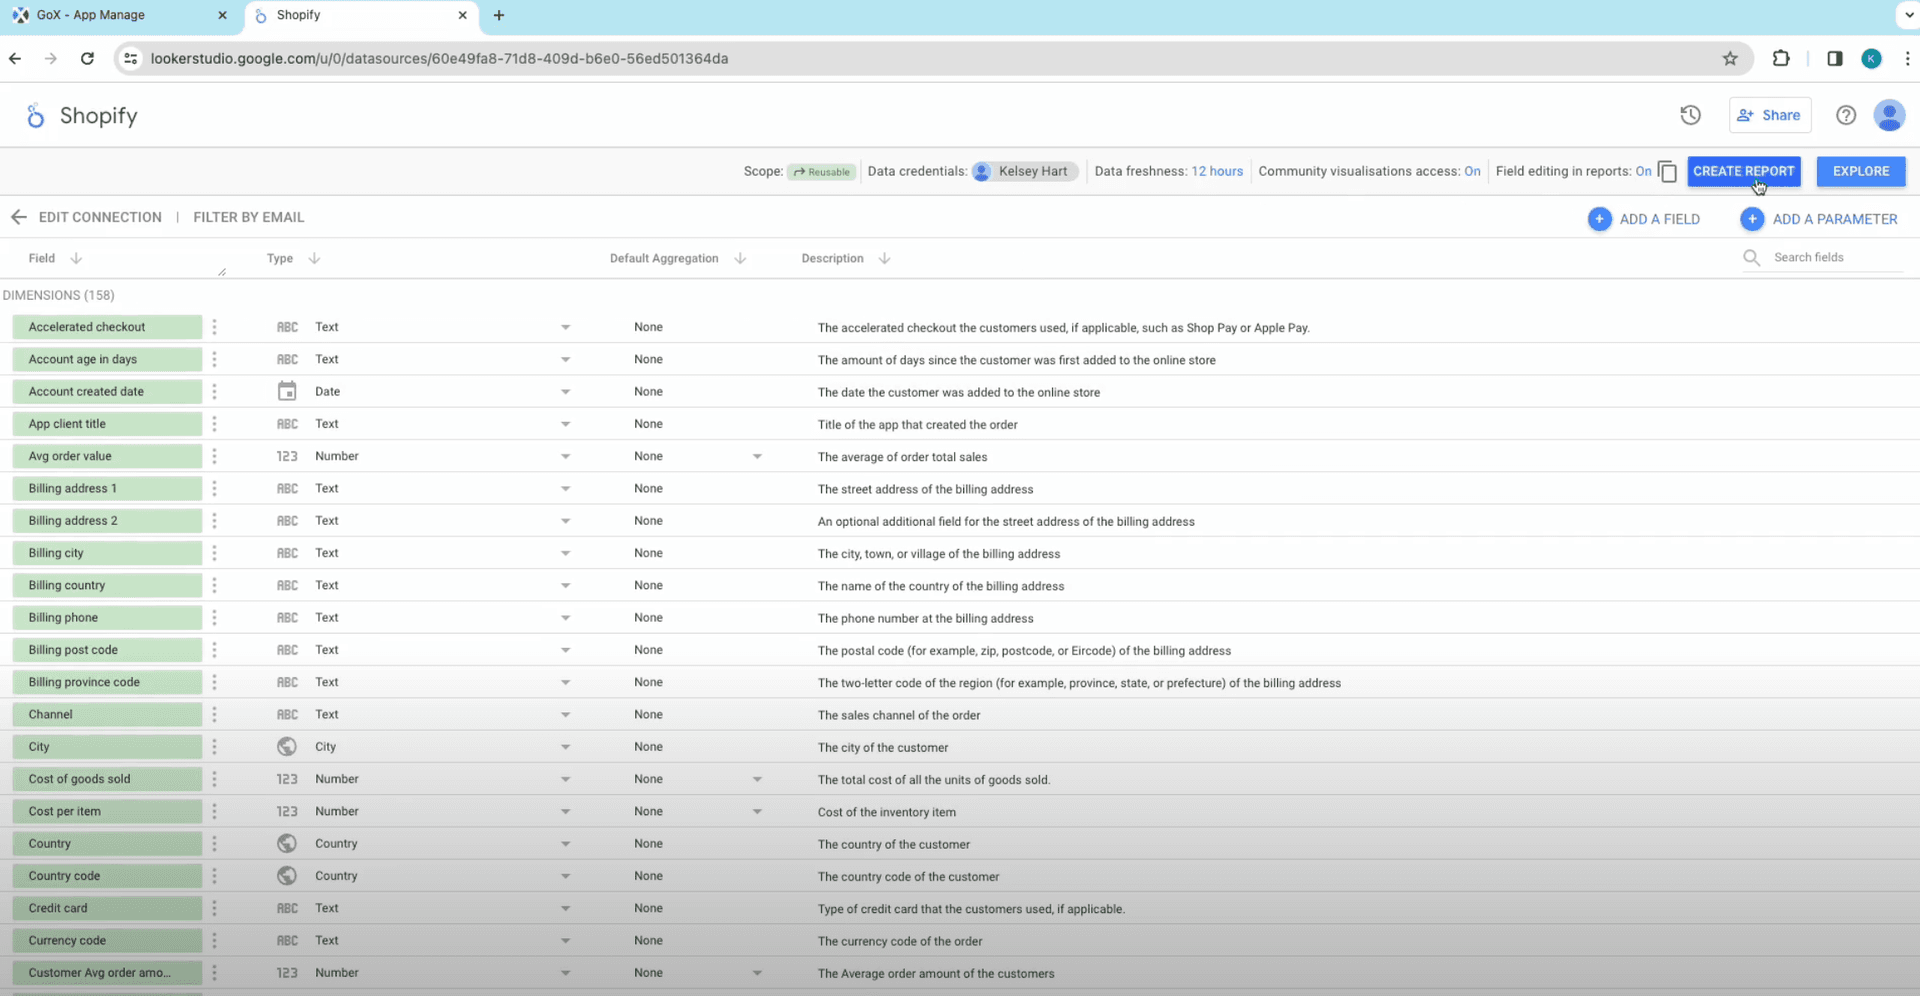
- Check all the fields and parameters you want to add to your Shopify report. You can add or eliminate any parameter based on your requirement. Now click on Create Report.
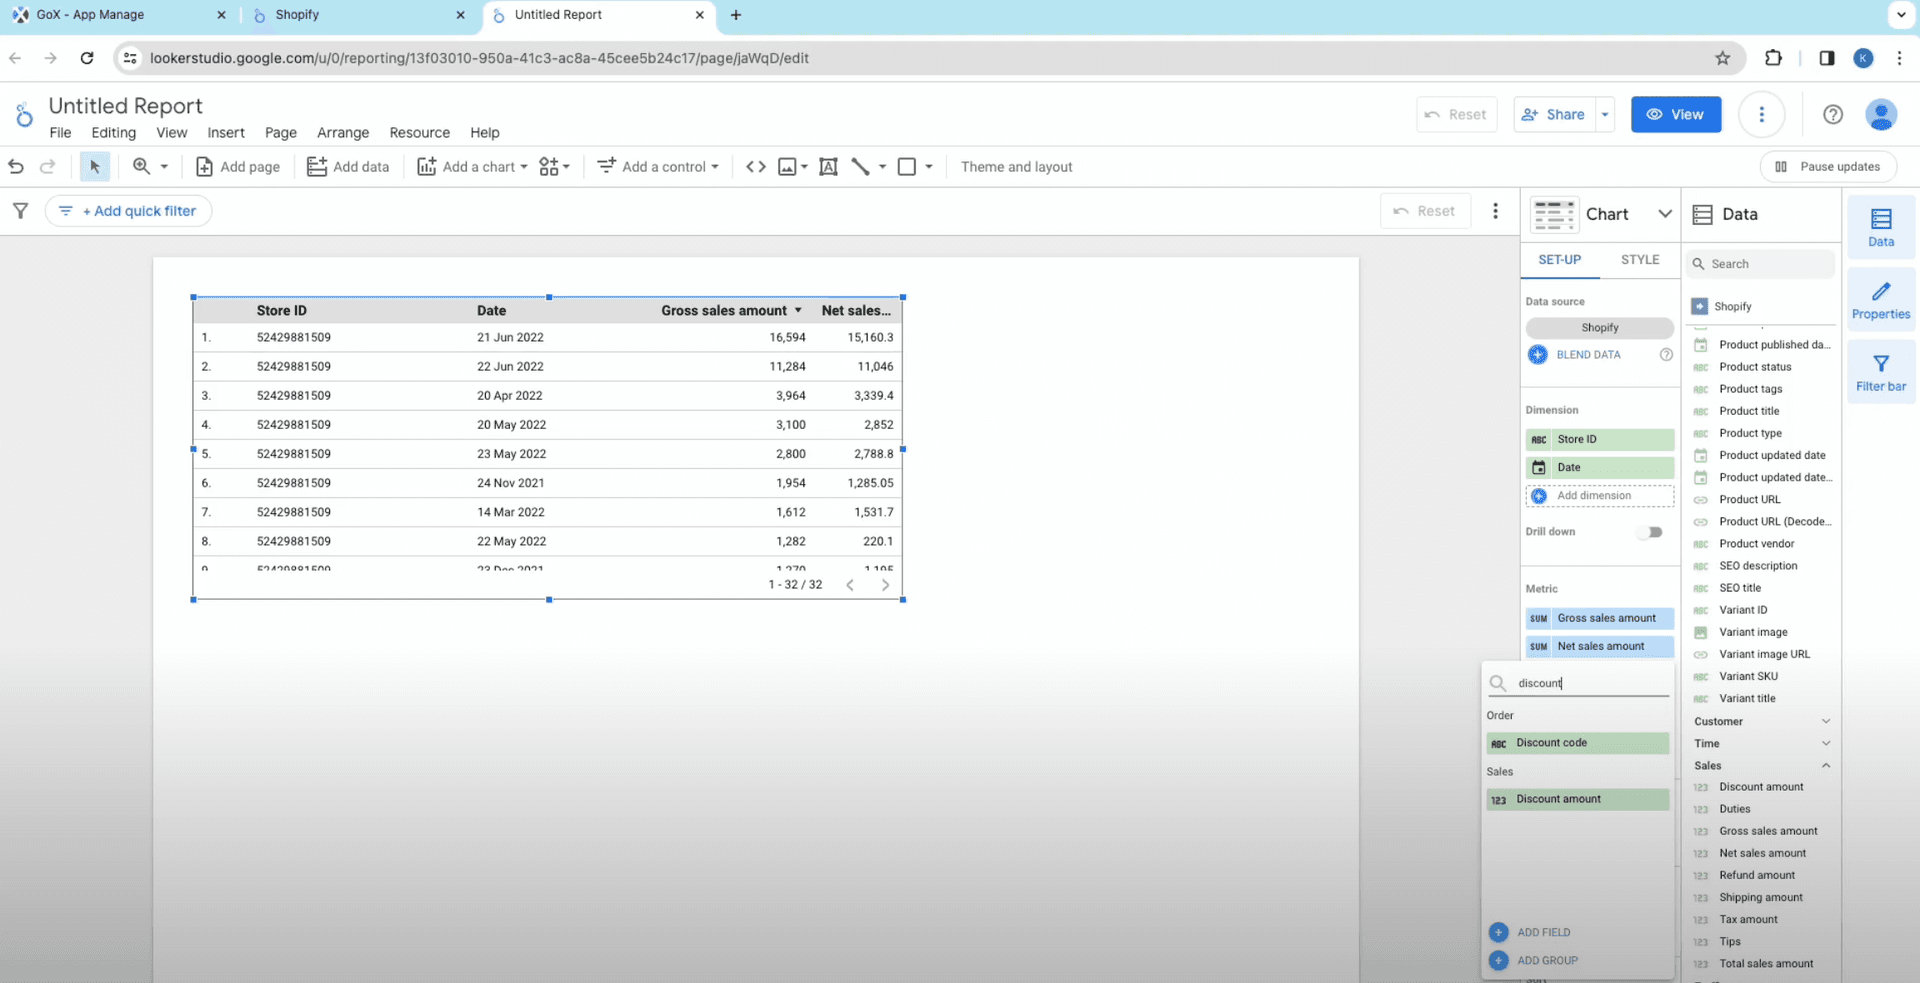
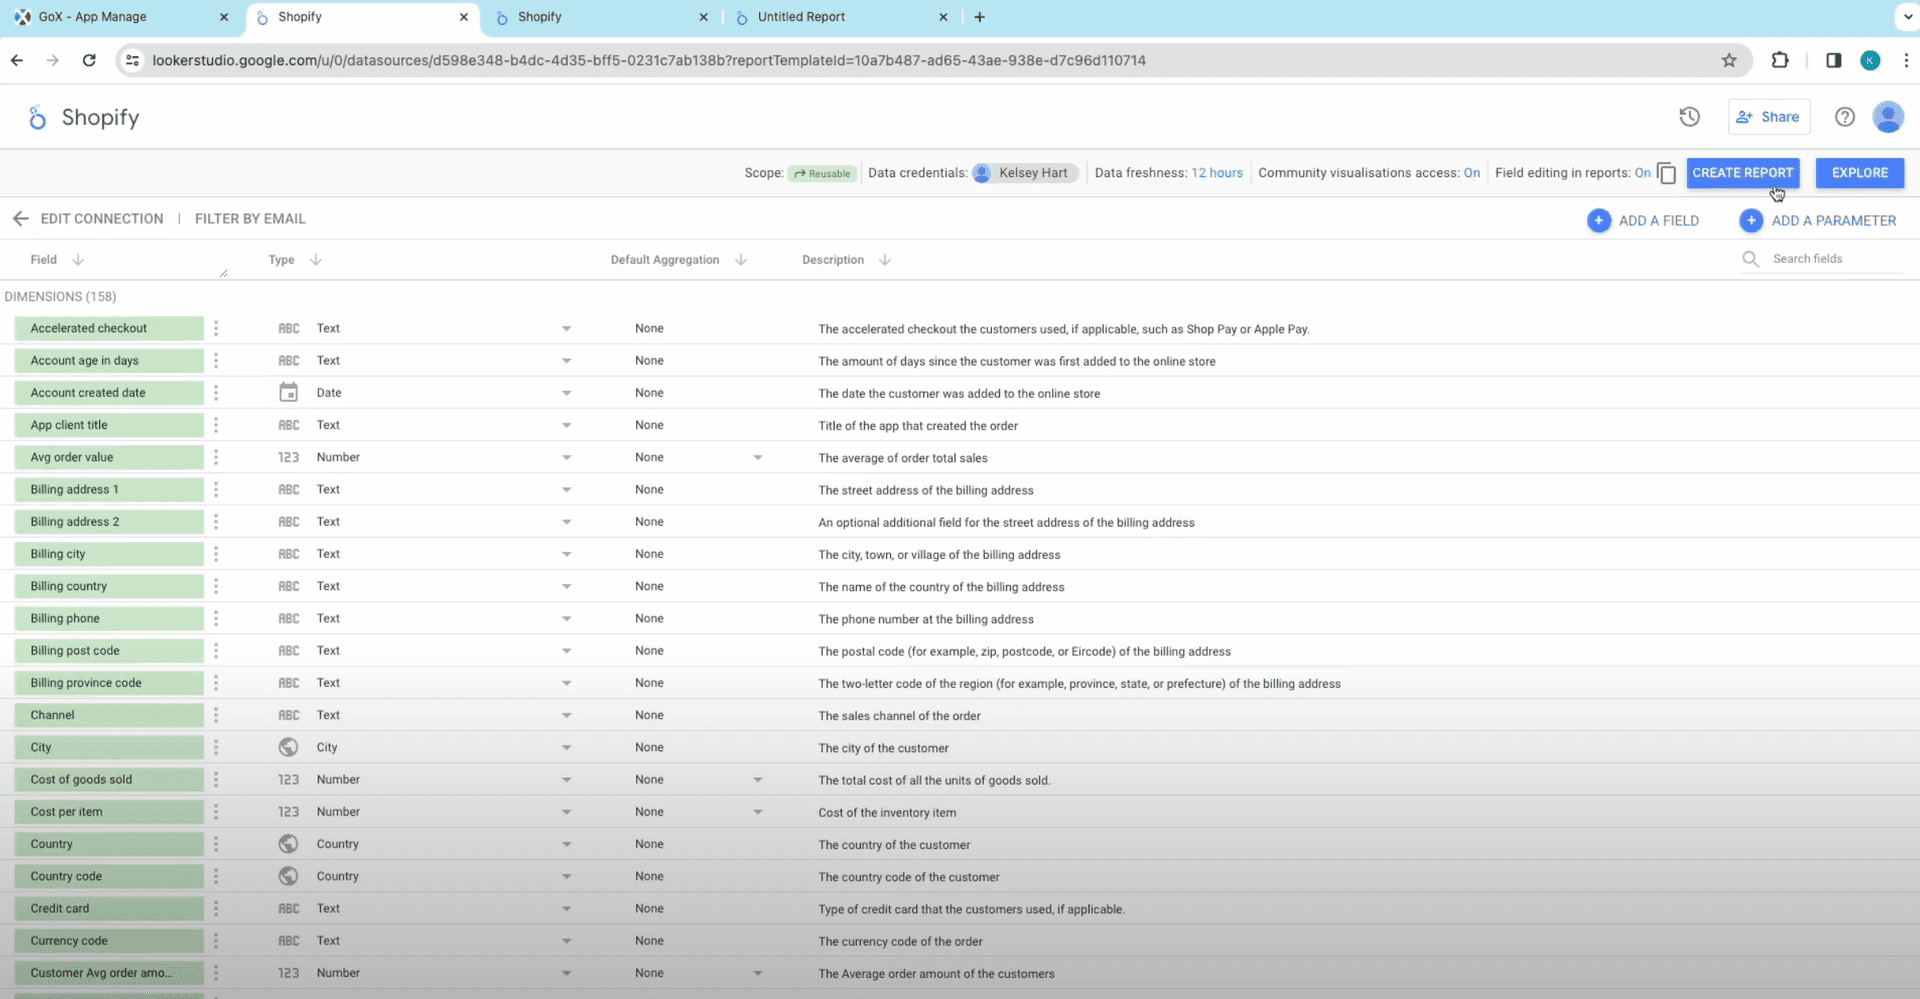
- You will be routed to Google Looker Studio where you will find a sidebar for all your fields and parameters.

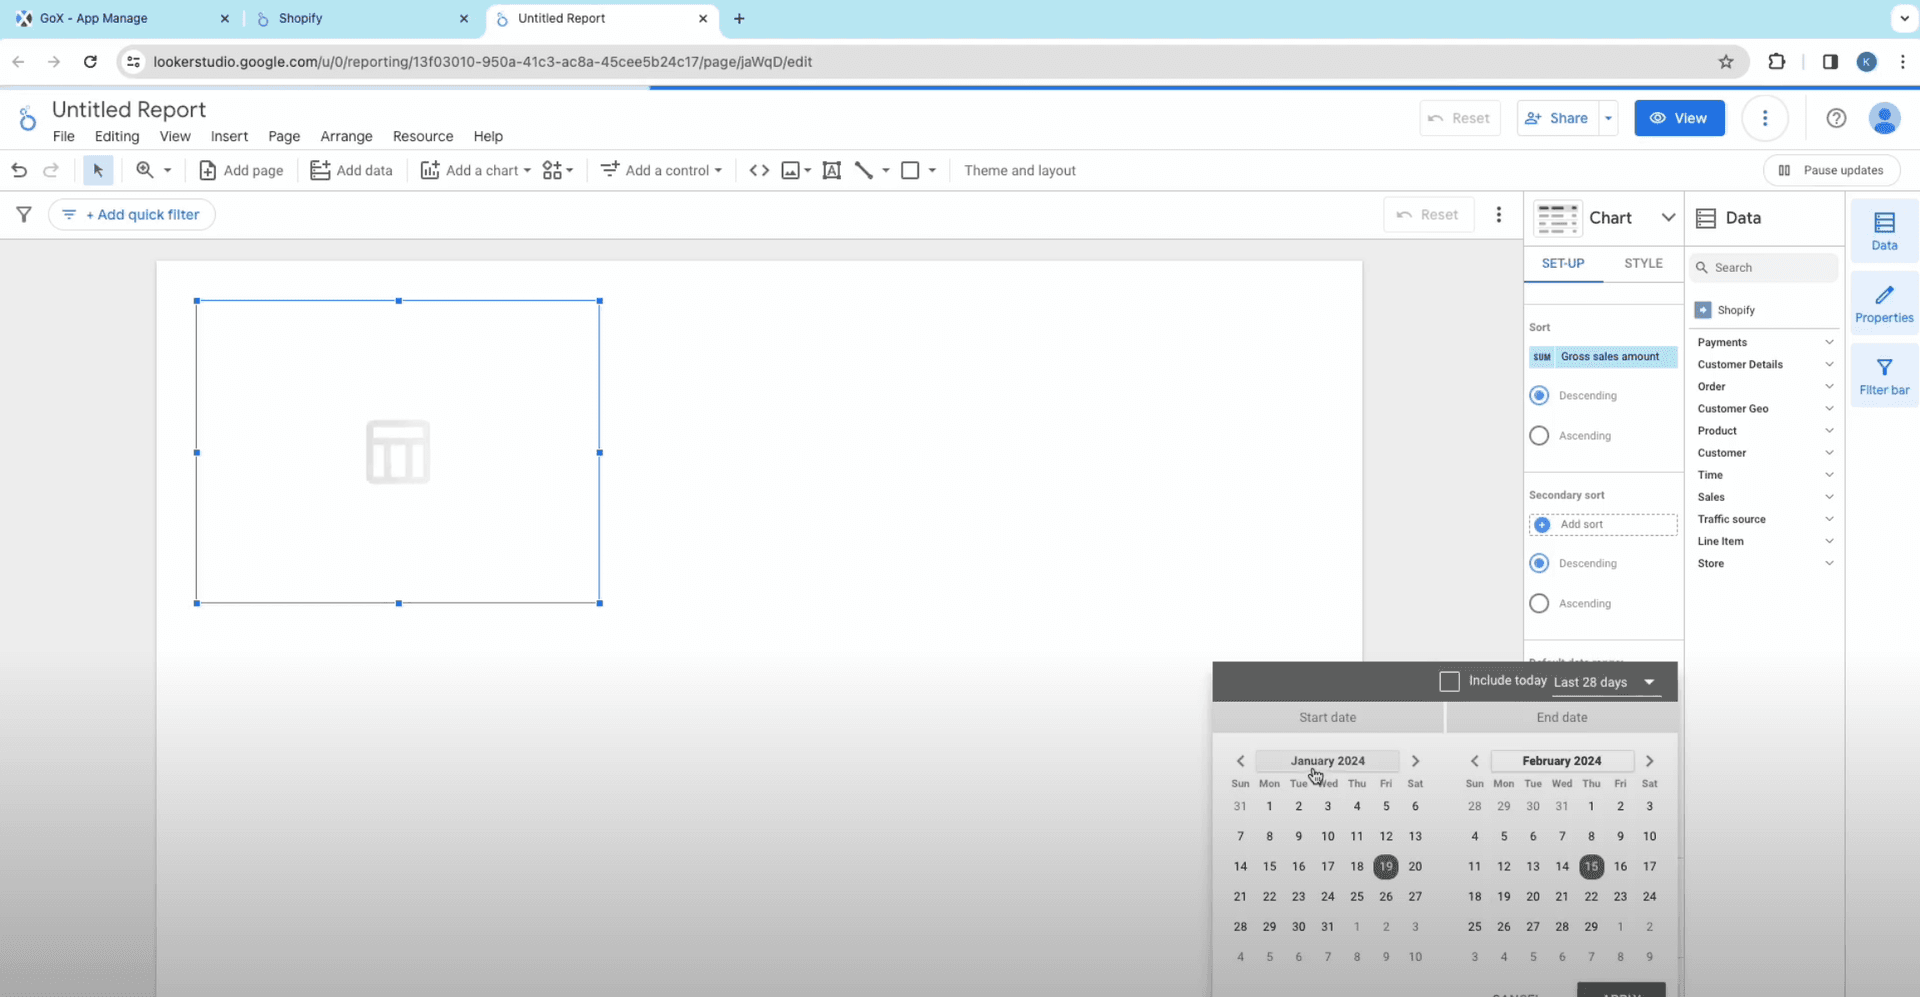
- Select date range control under Date filter. You can either select a range or click on the duration given in the drop down menu.
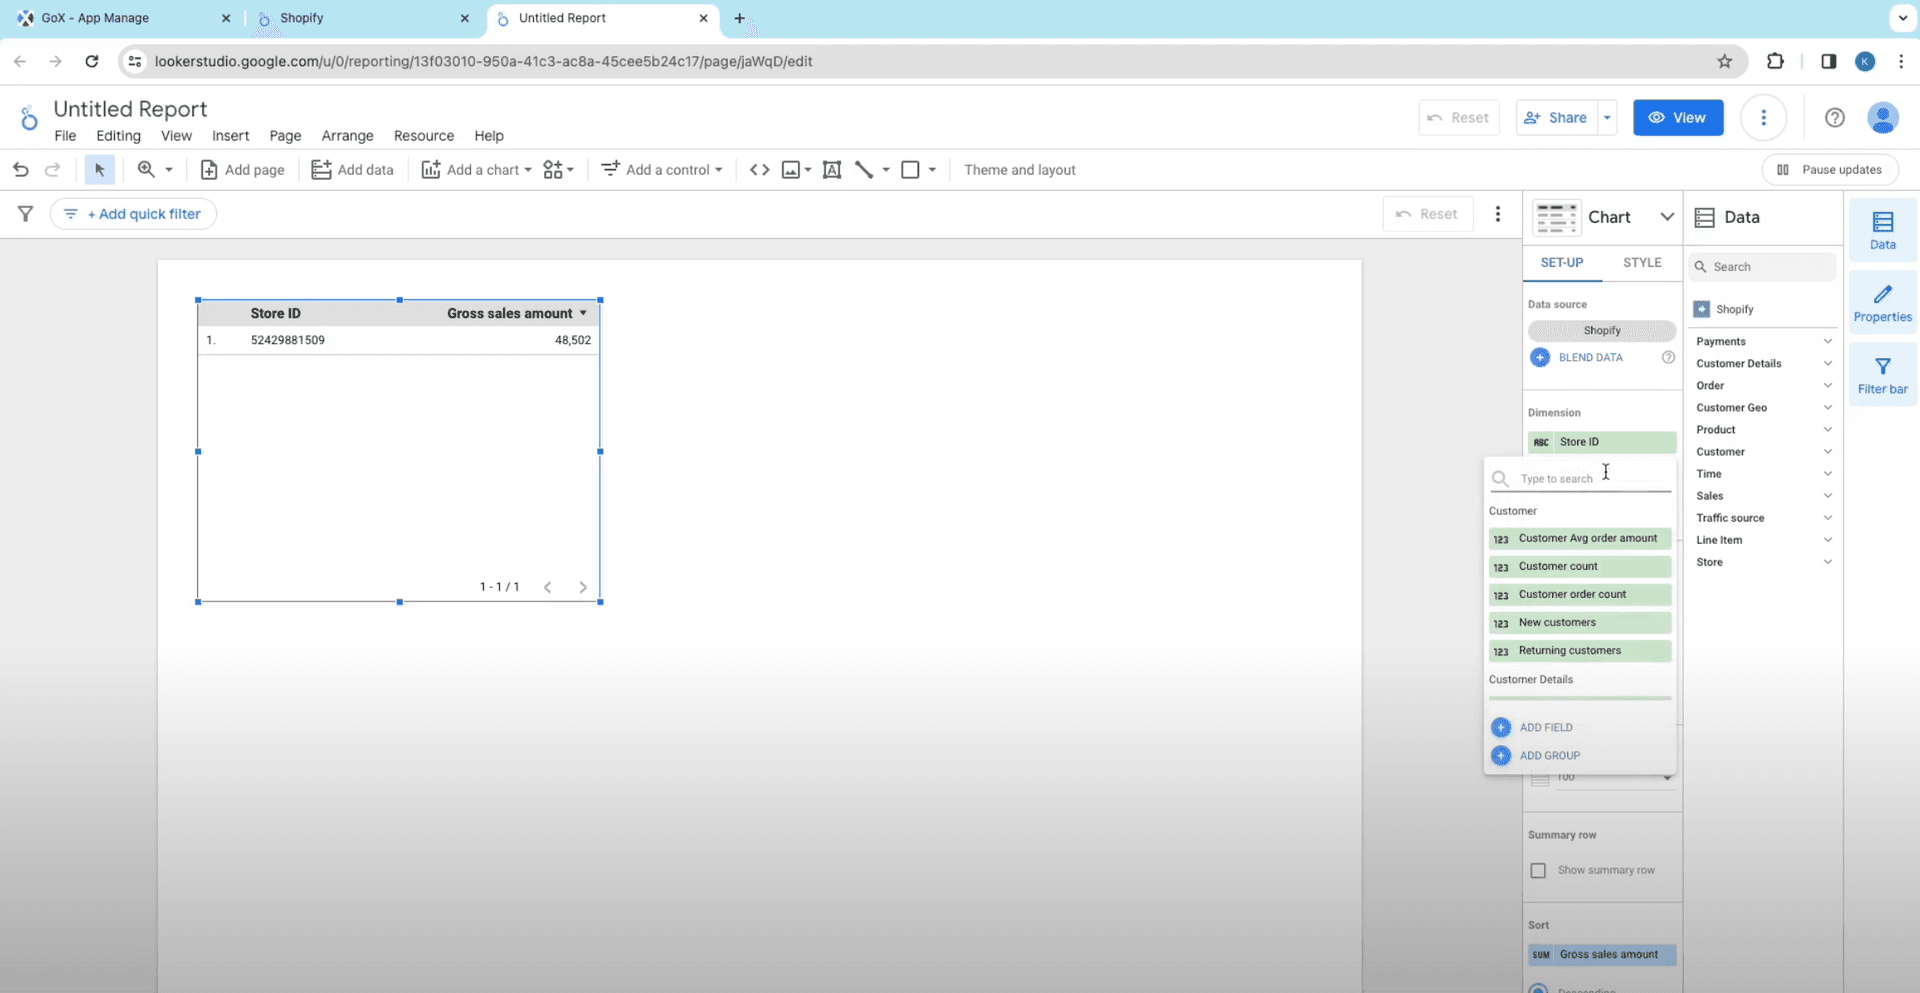
- Under Dimensions, you will get various options for average order value, customers count, new customer, order count, returning customers, etc. Click on the ones you wish to add to your report.
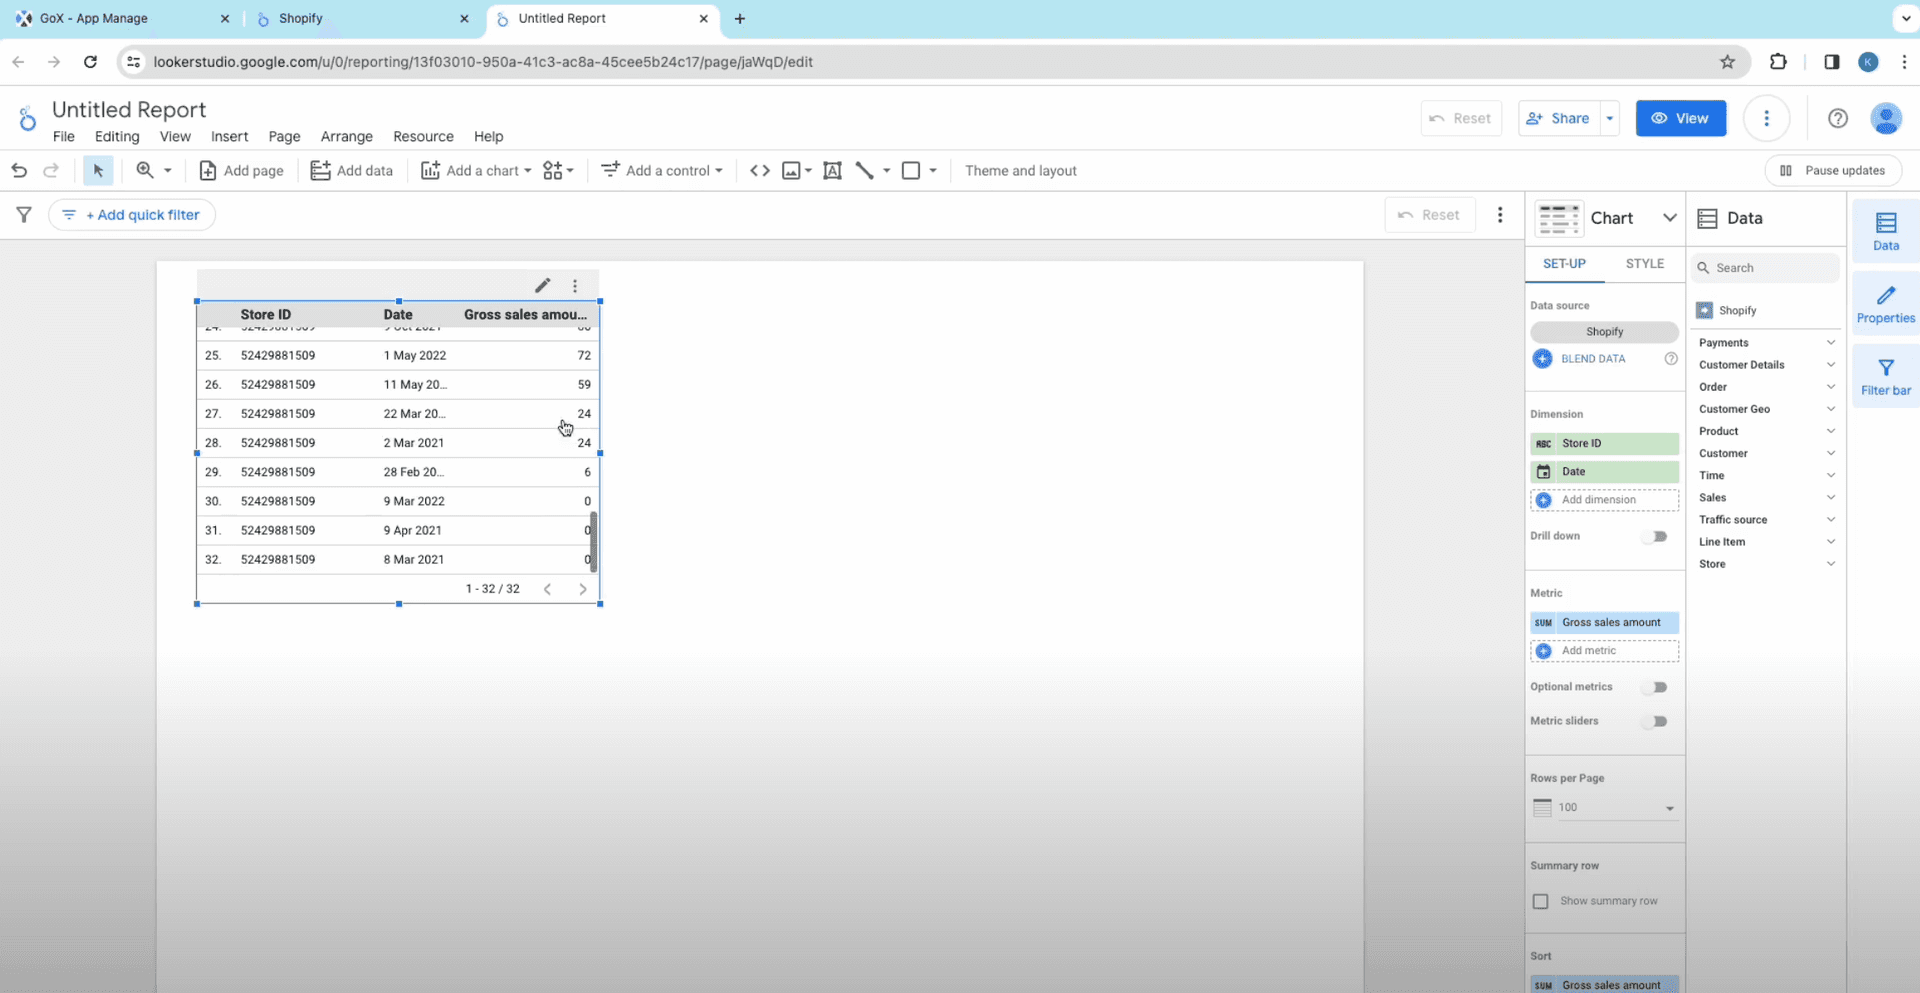
- You will see your IDs for stores, date and similar data in your table.
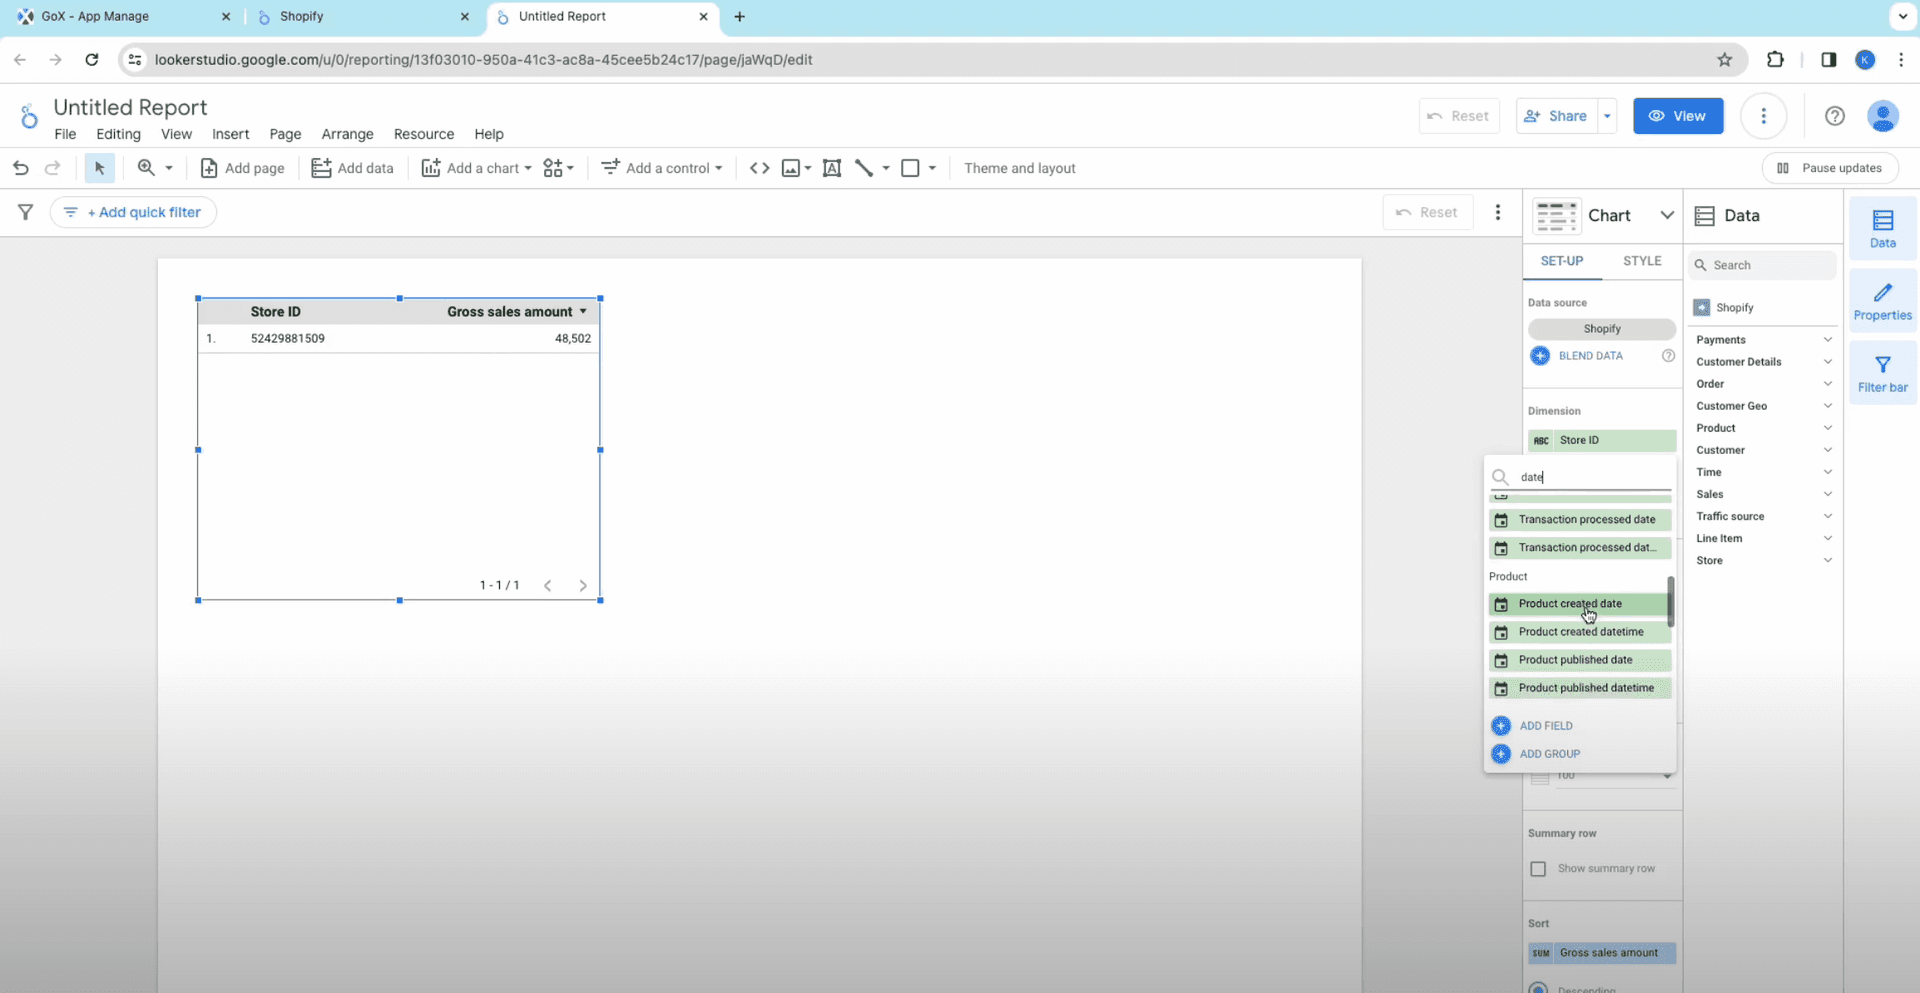
- Under Metrics, you will have numerous fields for discount, traffic source, customer details, line items, product, total sales, customer returns, bounce rate, etc. There are two ways you can add metrics and dimensions.
- You can either choose to drag and drop from the data sidebar column. Or like shown below, you can pick anything related to sales or order and drag it to the metrics or dimension field.

- Or, you can pick one from the list in the drop down.
Now just sit back and wait for Google Data Studio to visualize Shopify Data and create detailed reports for you.
Method 2: Connect Shopify to Looker Studio Using Templates
The initial steps of this method will remain the same. For a quick recap - You would need to go to Products -> Two Minute Reports for Looker Studio. Access Accounts, choose a team, and proceed to Data Connectors.
- Once done, now click on Create Report.
- Select Shopify-> add connection details-> save and authorize. In Query Configs, add a configuration and set all your Data Source and then click on Next.

- You will have all the built-in templates specifically designed for Shopify data studio. Select the report template that best fits your needs and connect Shopify to Google data studio.
- Select the team you want to collaborate with and click on Next.
- Now choose your query configurations and click on Connect.
- You will see all the parameters and fields for your Shopify reporting. Eliminate or add fields and parameters as per your need and click on Create Report.
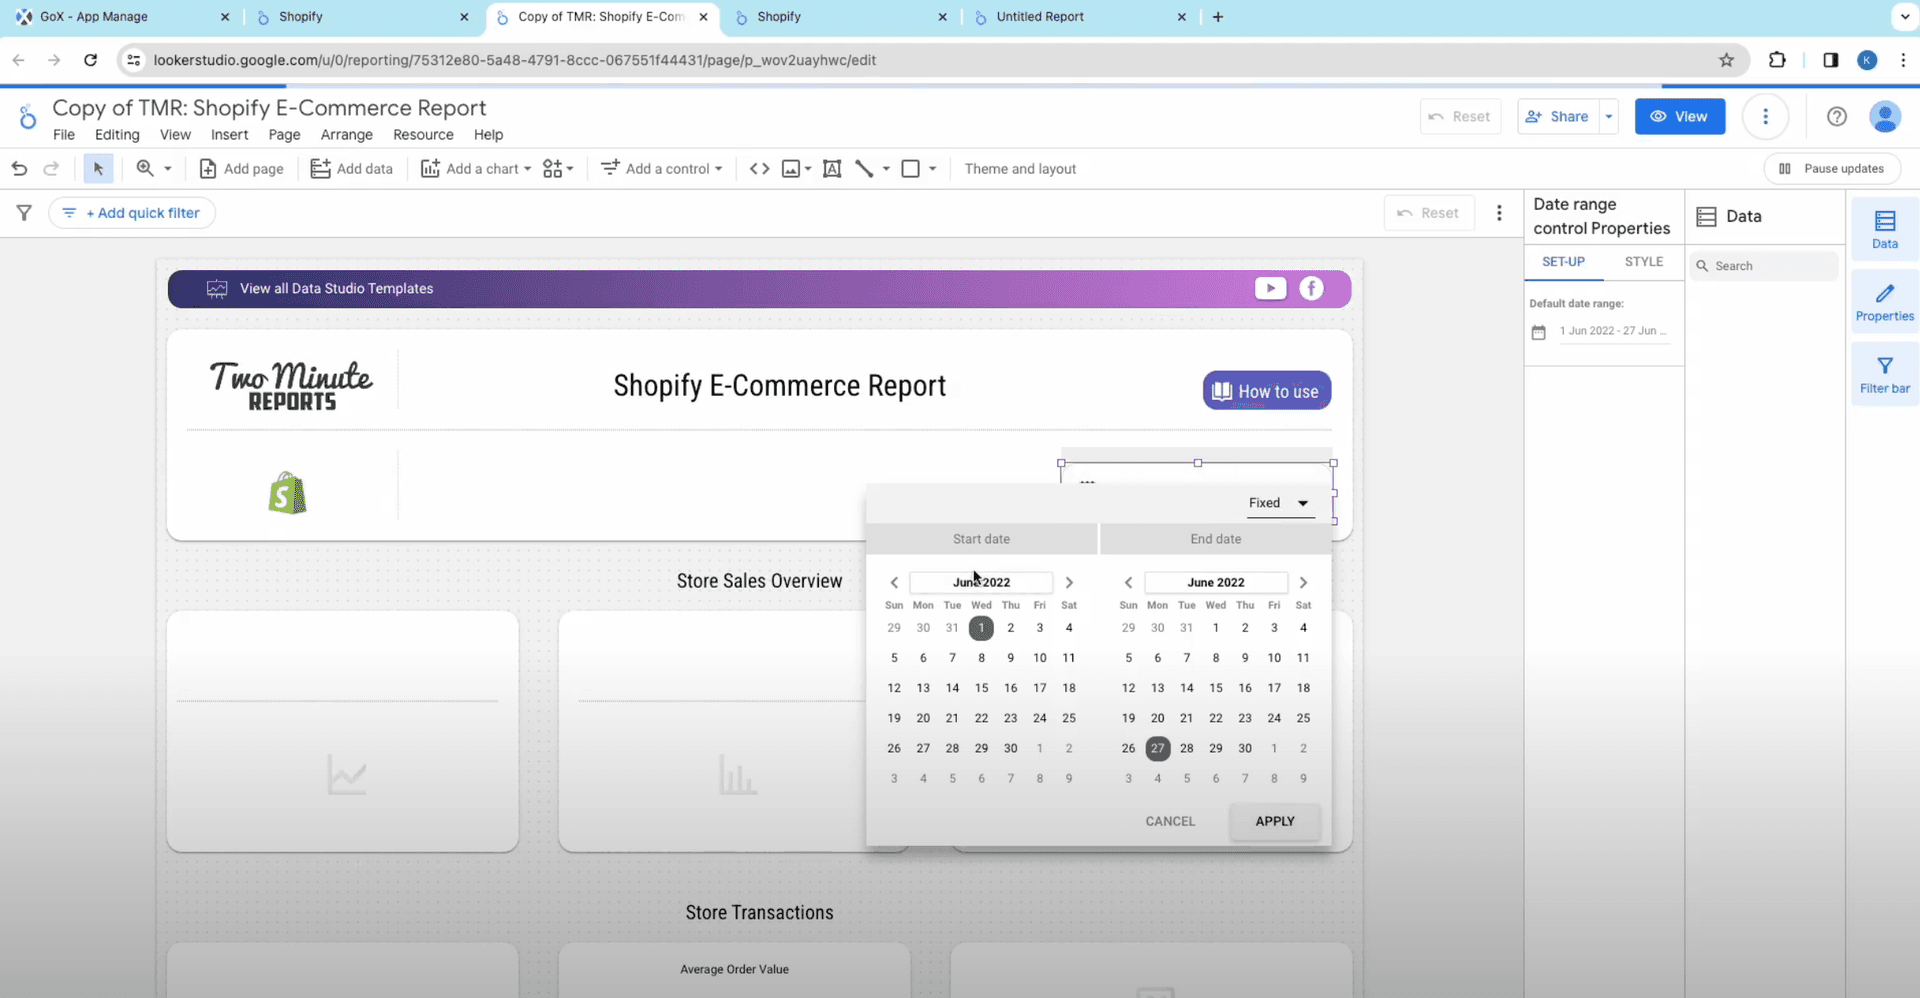
- A Google Data Studio doc for Shopify data will open up. You will see graphs and reports for various Shopify metrics like stores transactions, conversion rates, average order value, etc.

- Choose dates from the drop down menu on the doc. You can either select the date range manually, customize the duration or choose from the variety of date ranges available.
- Now set your table with preset metrics and dimensions available in the sidebar. You can choose order name, customer data, return customers, sales insights, other Shopify data you wish to add to your report template.
- Note that for both Dimensions and Metrics, there are two ways to add them - drag and drop from the data sidebar column or pick one from the drop-down list.
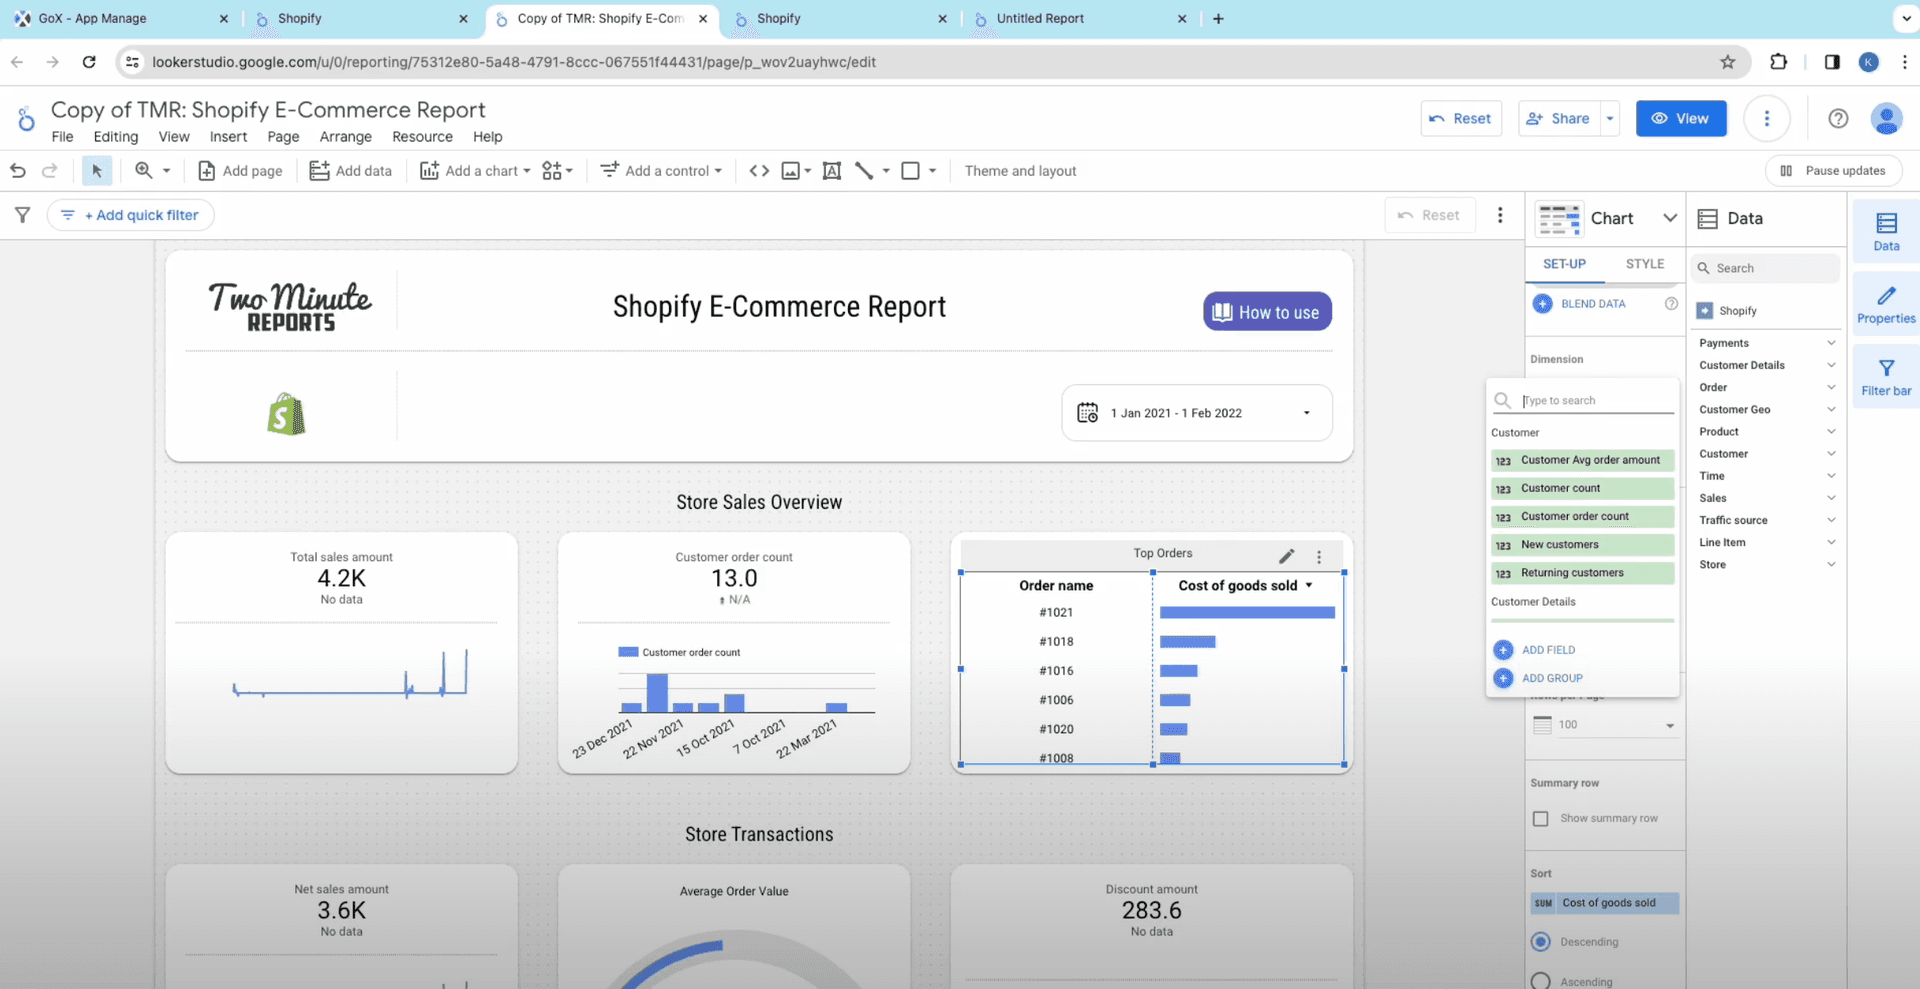
- Now watch your Looker Studio arrange all the Shopify metrics and Shopify data to create meaningful reports and help you analyze essential insights.
Start using these quick templates for looker studio now
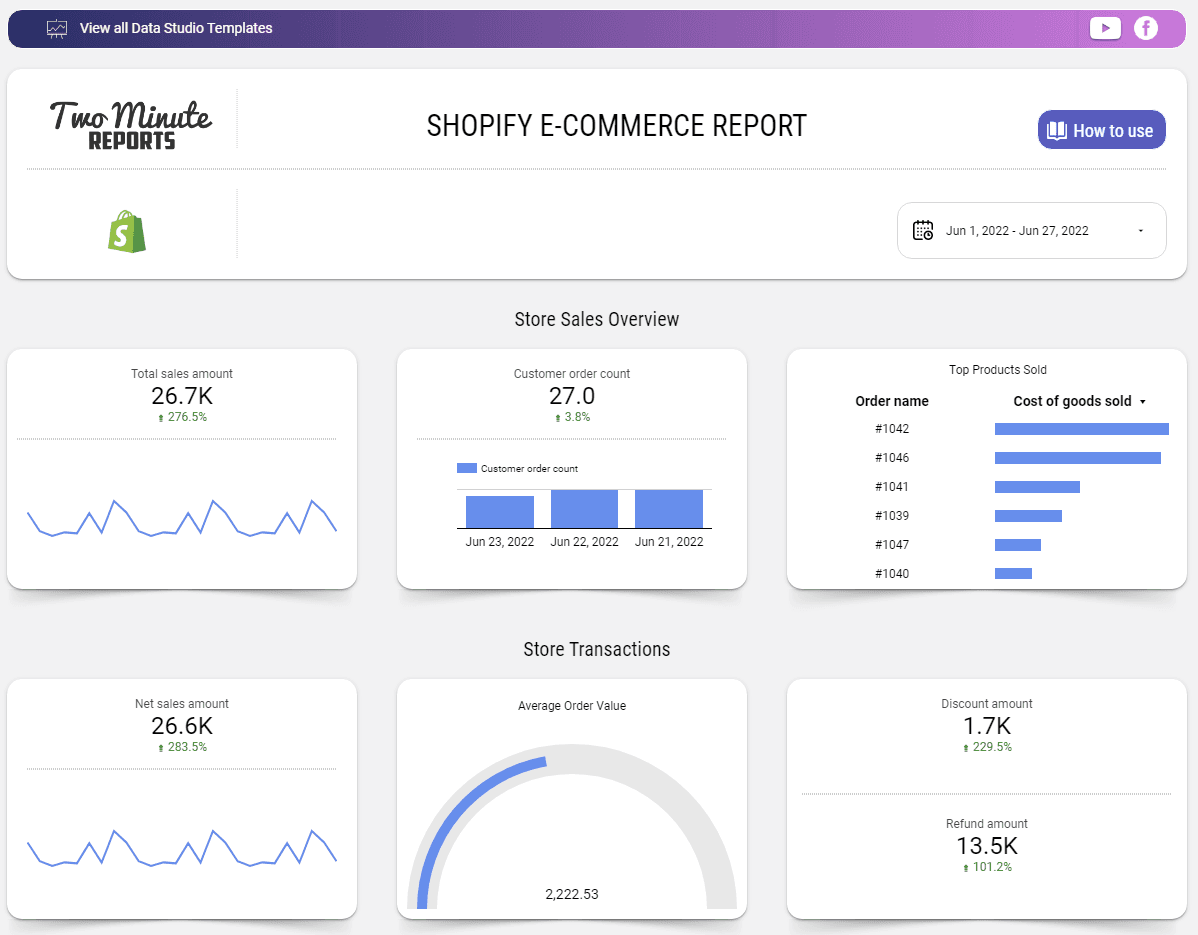
1. Shopify E-Commerce Report
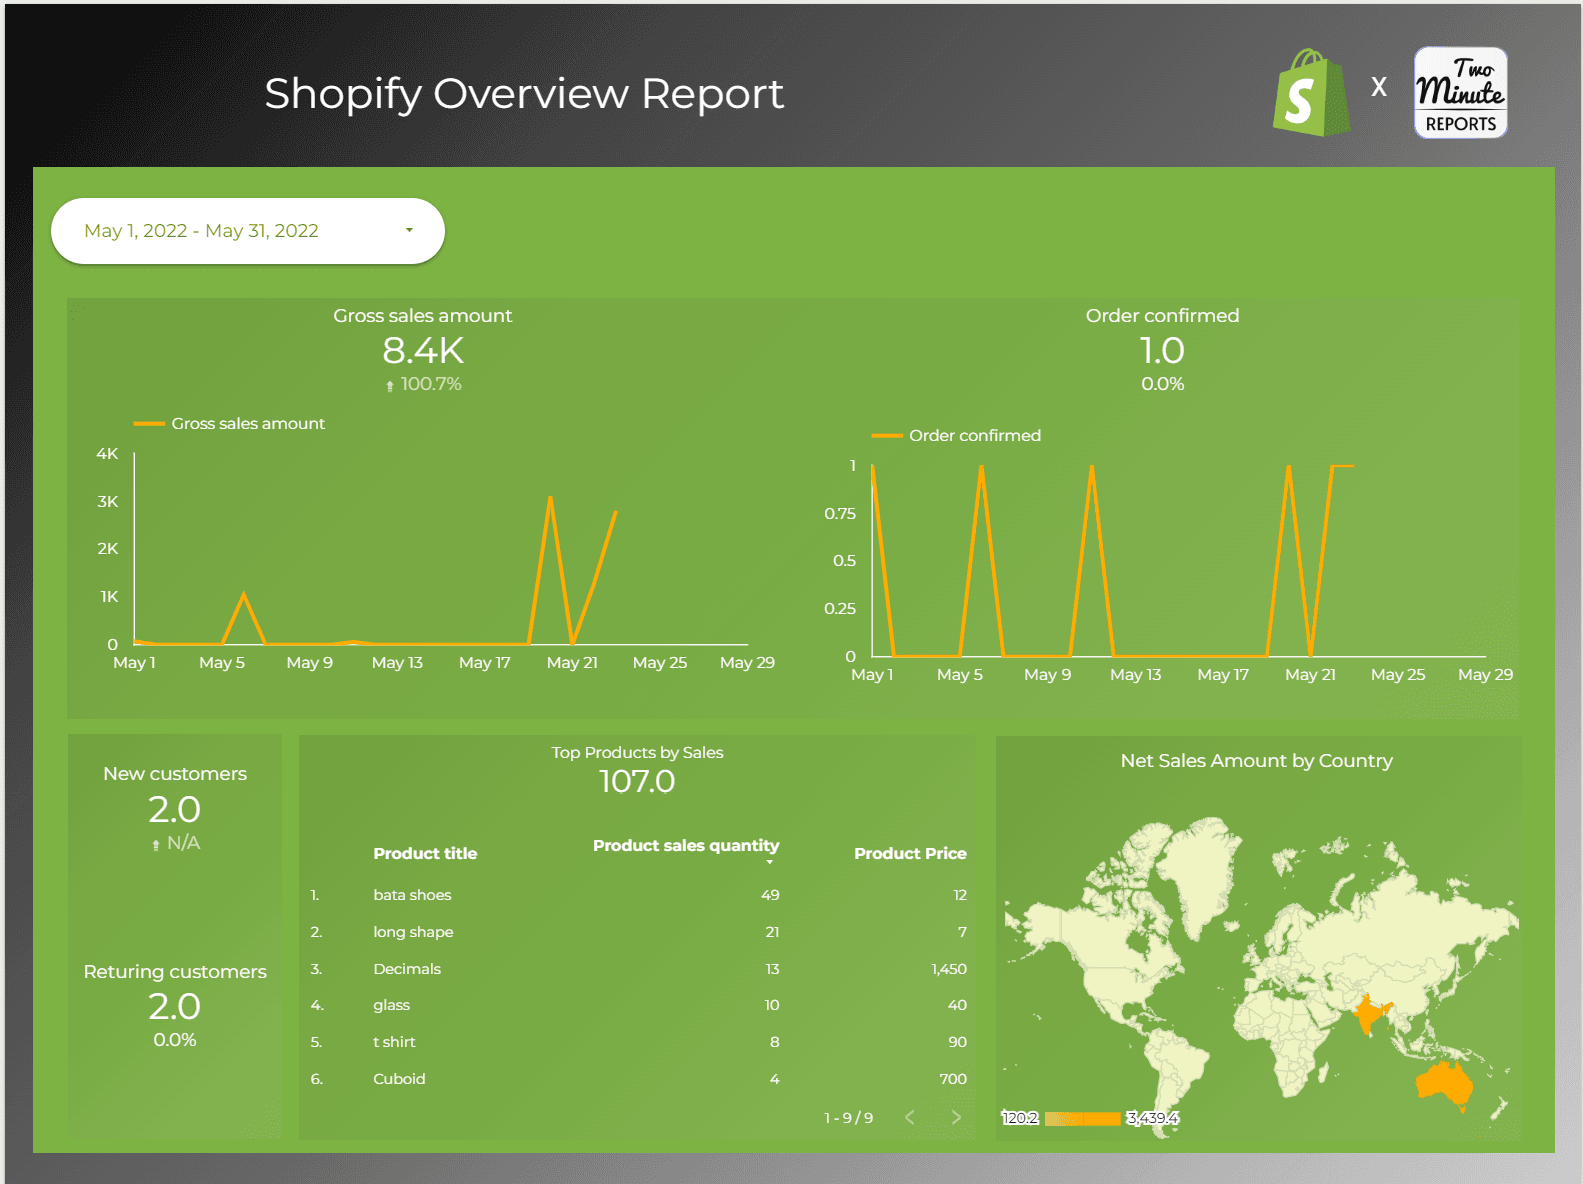
2. Shopify Overview Report
Why Connect Shopify to Looker Studio?
While standard marketing tools give you straightforward performance analytics, you won’t get in-depth understanding unless you apply customized filters and evaluate performance from a 360-degree perspective. This is where Two Minute Reports helps - by automating data extraction on a customized schedule and consolidating it in one place. Here’s why you should get your Shopify data to Looker Studio.
Easily visualize your Shopify data
Looker Studio empowers you to gain comprehensive visual insights into your Shopify data. Through direct connections to Shopify data, users can swiftly generate interactive, real-time dashboards and reports. This facilitates seamless monitoring of crucial indicators like total sales, returns, and customers behavior.
Refines your marketing strategies
Importing Shopify data into Looker Studio allows you to seamlessly integrate sales data with marketing reports. This integration enables you to identify the most effective marketing channels for driving traffic and sales. Consequently, it empowers you to optimize marketing tactics and enhance your return on ad spend.
Increased data accessibility and collaboration
Looker Studio facilitates effortless sharing of Shopify reports throughout your organization. Its collaborative features allow multiple users to access and edit the same report simultaneously, promoting data-driven decision-making across all departments.
Major KPIs to have in your Shopify Looker Studio Report
Thoughtful use of Shopify data in Looker Studio will not only help you unlock data driven decisions for your business but also save time by providing all essential data required for reporting at one place. Here are a few things you can explore while analyzing the Shopify data on Looker Studio.
Order
Analyze total sales, gross sales, discounts, and tax amounts in Shopify reports to identify areas for improvement in operations. Use insights from this data to adjust pricing strategies, discount offerings, and tax calculations for more profitable sales.
| Title | Description |
| Orders | The total number of orders placed. |
| Ordered quantity | The quantity of a product or item that has been ordered |
| Returned quantity | The quantity of a product or item that has been returned by a customer |
| Net quantity | The quantity of a product or item that remains after accounting for both ordered and returned quantities |
Sales
Examine total sales, gross sales, discounts, and tax amounts in Shopify reports to pinpoint operational improvement areas. Utilize insights to refine pricing strategies, discount offerings, and tax calculations, enhancing sales profitability.
| Title | Description |
| Total sales amount | The total sales of order amount |
| Discount amount | The total amount of discounts applied on the order and line |
| Refund amount | The total amount refunded for the order |
| Tax amount | The total amount of tax for the order & line. Takes returns into account |
Product
Assess product title, SKU, sales and inventory quantity, product ID, variant title, product type, price, inventory value, and cost of goods sold on Shopify to optimize operations.
| Title | Description |
| Inventory value | The sell value of the product inventory |
| Inventory quantity | The product quantity in inventory |
| Cost of goods sold | The total cost of all the units of goods sold. |
Customer Geo
Examine customer geo data to discern their origins. Tailor marketing campaigns and personalize product offerings based on customer location. Enhance operations by identifying areas with a high concentration of customers, potentially requiring additional resources.
Store
Identify store names and IDs to segment sales and customer behavior across stores. Compare performance across locations, determine best sellers, and assess promotional tactics to enhance operations. Utilize this information to pinpoint profitable stores and streamline inventory quantity.
| Title | Description |
| Store name | This is the count of impressions for Direct Ads and Sponsored Updates and sends for InMails. |
| Store ID | The unique identifier for the shopify store. |
Traffic source
Examine customer behavior and refine marketing strategies by utilizing Shopify's first and last visit sources, dates, and types. Enhance operations by generating targeted reports based on these insights to elevate conversion rates and increase revenue.
| Title | Description |
| FV: Date | The first visit date |
| FV: Source | The First visit Source from which the customer visited the store, such as a platform (Facebook, Google), email, direct, a website domain, QR code, or unknown. |
| LV: Source | The source from which the customer last visited the store, such as a platform (Facebook, Google), email, direct, a website domain, QR code, or unknown. |
| LV: UTM medium | The AD medium of a marketing campaign from which the customer last visited the store. |
Customer Insights
Evaluate customer behavior using email, names, unique IDs, customer types, and tags. Create detailed customer profiles, personalize outreach, optimize websites, update inventory, and enhance customer experience for improved marketing and data-driven decisions.
| Title | Description |
| Customer first name | The first name of the customer |
| Customer email | The email of the customer |
| Customer type | Whether the customer a Returing customer (Customers whose order history includes two or more orders) or a First-time customer. |
| Account created date | The date the customer was added to the online store |
Get Shopify data in Google Sheets too!
 Two Minute Reports is also available as a Google Sheets add-on. This add-on is designed to simplify complex data analysis and visualisation, making the best use of Google Sheets’ tools and features.
This add-on allows the creation of detailed reports and dashboards using insights from LinkedIn Ads without the complexity of manual data entry. TMR for Google Sheets also enables users to develop custom formulae in a user-friendly interface.
With seamless Shopify to Google Sheets integration, comprehensive analytical capabilities, and automated workflows, strategic business intelligence has just become quicker and more accessible.
Connect other Platform Data Sources with Google Sheets
Amazon Seller
E-commerce platform for third-party sellers to sell their products.
WooCommerce
E-commerce plugin for WordPress to create online stores.
FAQs
How To Display Shopify Sessions On Google Looker Studio?
You can use our Two Minute Reports. It will Analyze customer behavior and optimize marketing strategies using Shopify's first and last visit sources, dates, and types.
Can I connect Looker Studio to multiple Shopify stores?
Yes, most connectors allow you to connect multiple stores of Shopify to Looker Studio. Our personalized templates like Shopify Overview will consolidate all data and give you a holistic overview of all your stores.
What kind of Shopify data can I explore in Looker Studio?
You can explore sales, order, product, customer details, time, line items, and more