
Traffic Dashboard with 12 Month Trend Chart and MoM Change%
![]()
For use with Google Sheets
About the Template
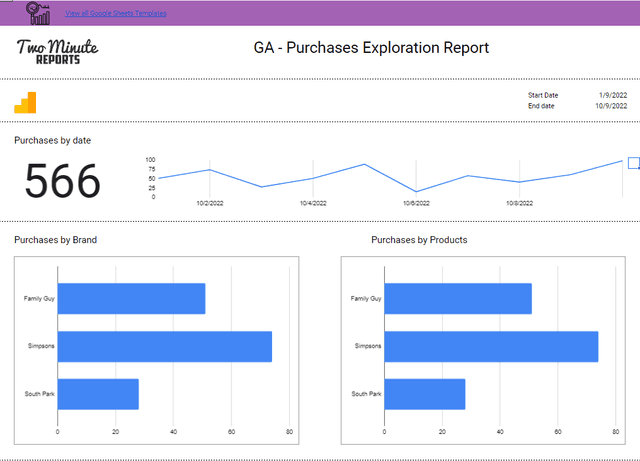
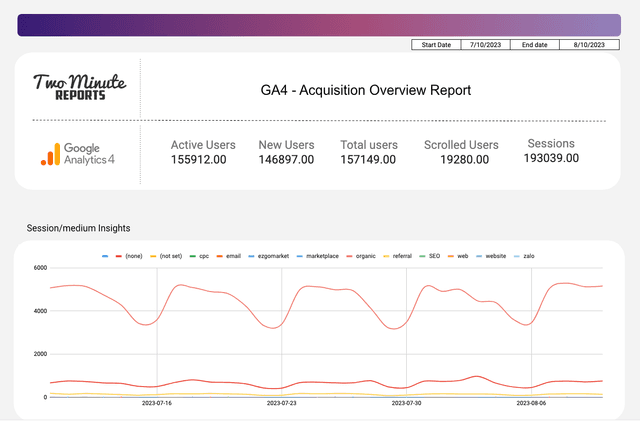
This is an interactive dashboard which consists of data like Sessions, 12 month trend chart, Users, Pageviews per Session, Transactions, Avg. Time on Page, Bounce Rate and also an interactive chart on user by medium and month.
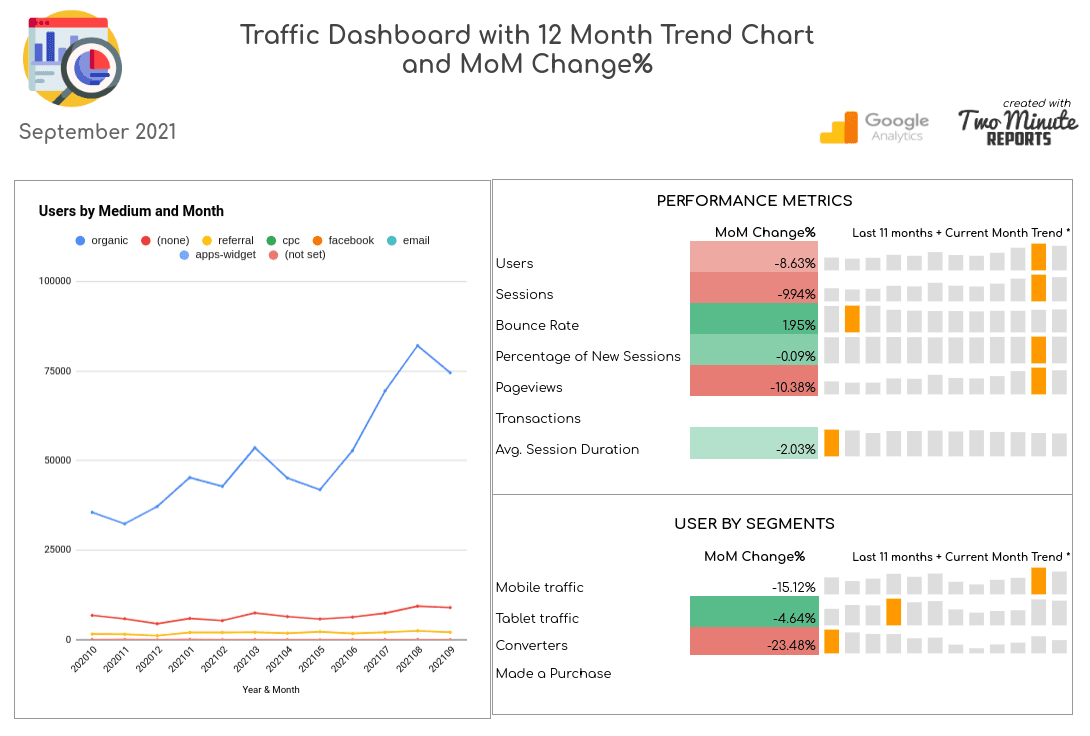
1. The User by Medium and Month refers to all the top sources of data from the past 12 months of the query.
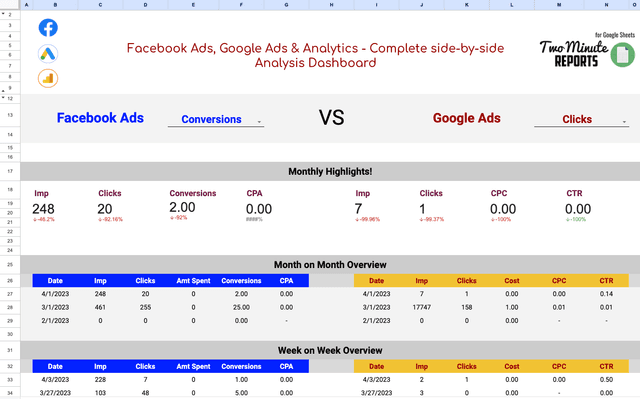
2. Performance Metrics refer to vital Metrics data such as users, sessions, bounce rate, percentage of new sessions, pageviews, transactions, and average session duration. It provides the Month on Month change percentage of these metrics and also provides the Last 11 months + Current Month Trend chart for monthly data representation.
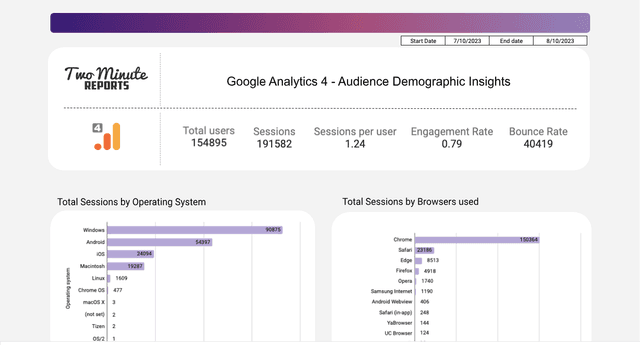
3. User by Segments gives the data of users by segments such as Mobile traffic, tablet traffic, Converters and made a purchase users. It provides the Month on Month change percentage of these Segment users and also provides the Last 11 months + Current Month Trend chart for monthly data representation.
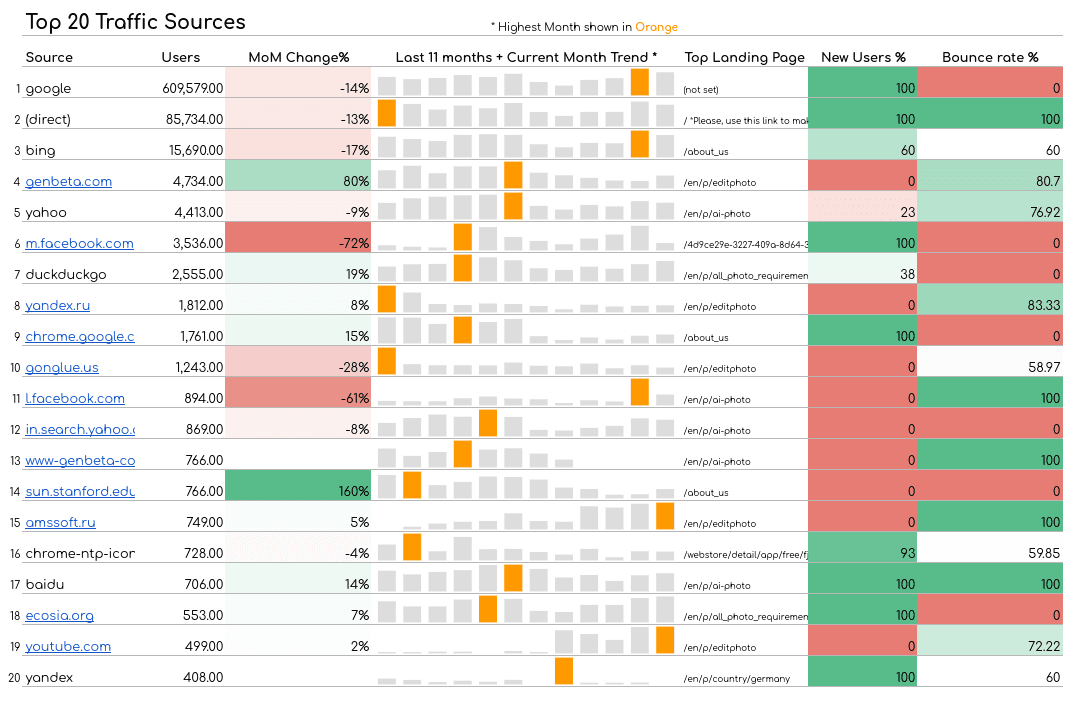
- 4. The Top 20 Traffic Source is the most sophisticated and best chart with the best data available for a user. It represents your Top 20 Traffic Sources with their number of users, Month on Month change percentage, Last 11 months + Current Month Trend chart, the top landing page of the user in that current source, percentage of new users and the bounce rate percentage of users.