Google Analytics Overview Report
By Two Minute Reports - May 9, 2022
Web Analytics
![]()
For use with Looker Studio
License Type : Free with Two Minute Reports
About the Template
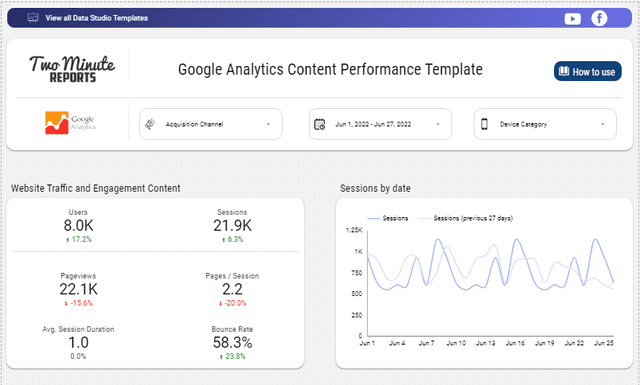
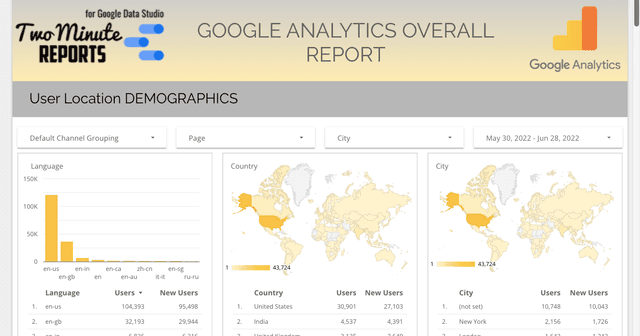
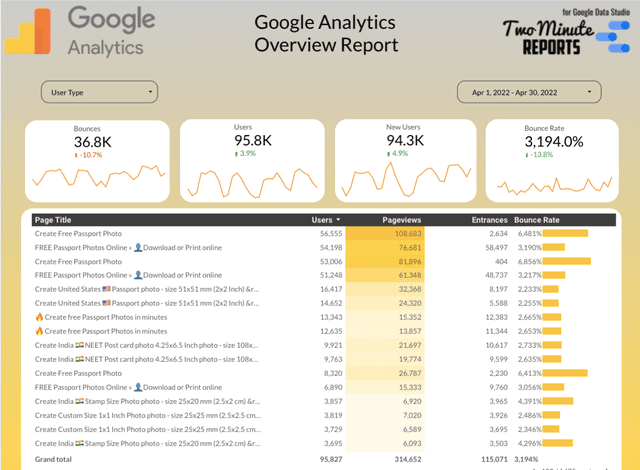
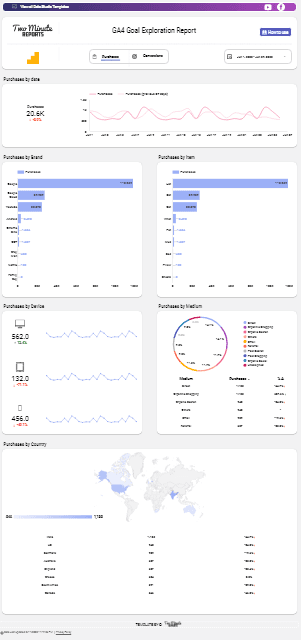
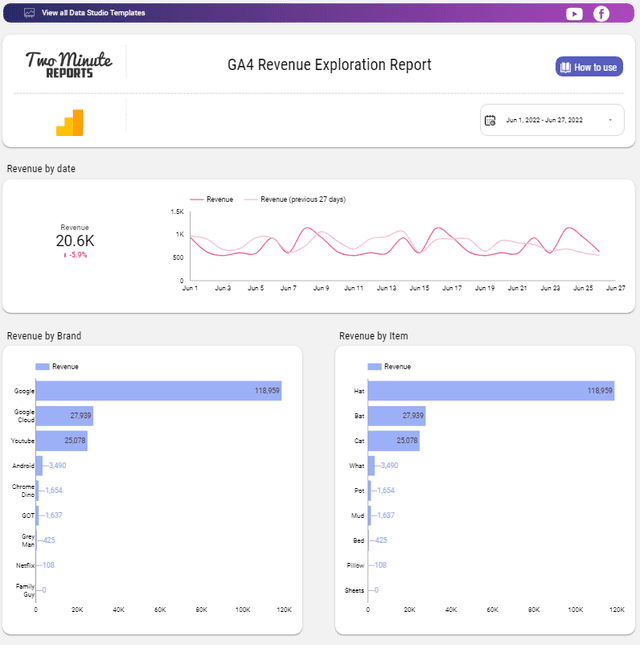
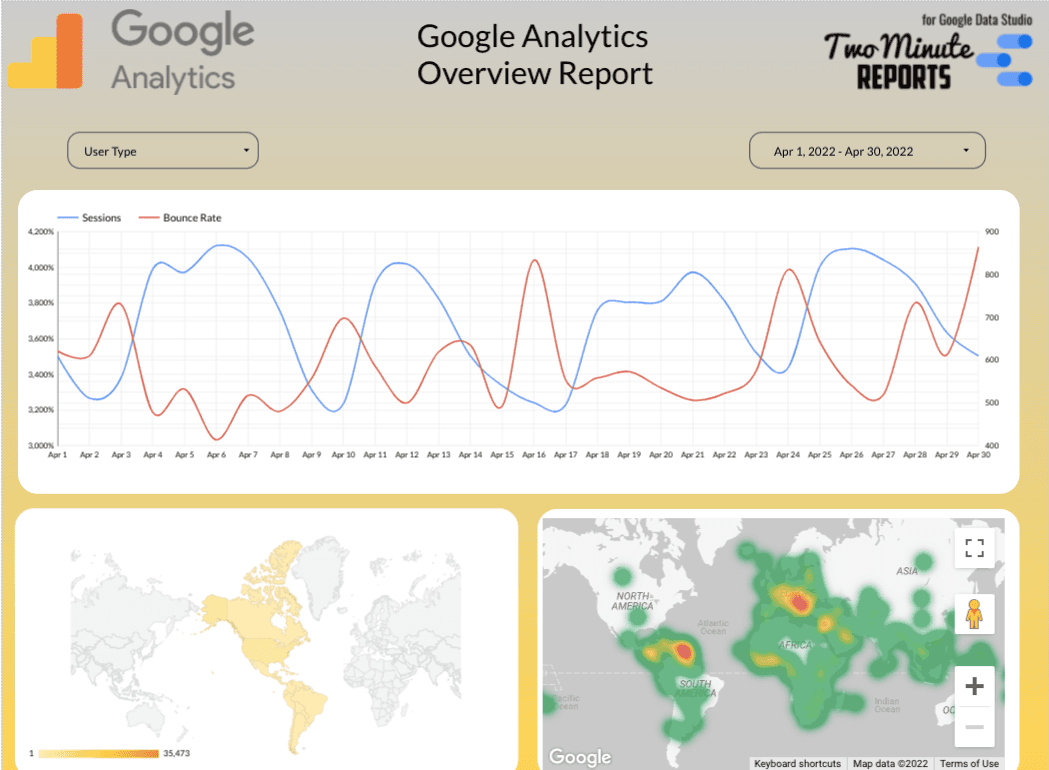
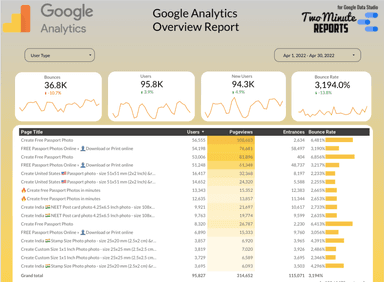
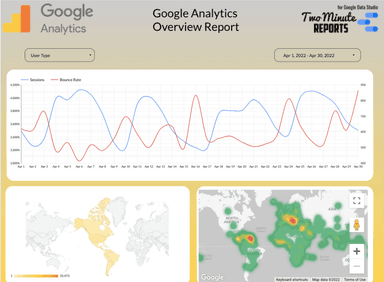
This is a unique and interactive template on Google analytics. You get Descriptive scorecards with comparison data and graphs of the respective date ranges for Bounces, Bounce rate, Users and New Users. You get a table with heatmaps and bar graphs for Page titles, Users, Page views, Entrances and Bounce Rate. You also get a dedicated line graph with dual color scheme for Sessions and bounce rate, day wise. And finally you get 2 Geo charts for world and Continent wise users. All of these metrics can be controlled using the 2 control bars on top, which can change the User type and Date. Click on preview to get an idea of this sophisticated Template.