With Two Minute Reports, marketers can create customized reports. The benefit of using TMR is you can pull data from any of your favorite data sources and then connect it with Google’s data visualization tool Looker Studio.
Looker Studio is a Google product and has limited data sources. With TMR, you can now track all your KPIs and metrics like CPC, organic reach and more from 30+ data sources like Facebook Ads, GA4, etc.
To get started with creating a dashboard, you need to go through three sections–adding data sources, creating reports and optionally sharing reports.
Step 1: Add Data Sources
Here is a quick video to help you connect your Data Source with Looker Studio using Two Minute Reports.
First step is allowing Two Minute Reports to access and acquire your data from your favorite data source. It requires authorization and authentication, but TMR makes it easy to do so. You may choose to connect any data source of your choice.
Select Connectors or Data Sources
- Choose the connector you want from a long list of connectors.

Authorize Data Sources
Authorize the community connector with your email account by allowing access.

Customize Query Configs
You may also customize its query configs in which you define which data to pull from your data source.
- Name your query config, and select your pages from the drop-down.
- Select your query config from the drop-down, and click connect.

Step 2: Create a report
The following video will teach you the nuts and bolts of creating an Interactive report from Scratch in 2 Minutes.
Once you have added your Data Source, it’s time to use Looker Studio. You will spend the most time here, but below are small quick steps to create a new report.
- Select Blank Report from Looker Studio.

- Under data sources, select the Two Minute Reports data source added earlier.
- Click on Connect at the top right of the screen.
- A new report is created.
- Add a new chart by click in Add a chart

- Add a date by clicking on Add a control.

- Drag to canvas.
- Select dimensions, metrics and other data points from the right panel for your use cases.

If you need additional information on charts, learn more about creating a report in How to Create a Report in Looker Studio.
You can select various Looker Studio templates if you would rather not create a report manually.
Step 3: Share your Report
Teams need to constantly share reports with one another. But most of the time collaboration between teams is a problem due to limited access and having no tool to do the job. Two Minute Reports solves that problem.
What’s amazing with Two Minute Reports is that the pulled data is still intact. For example, once a Facebook Ads report is created with TMR and shared in Looker Studio, anyone across your team can see the reports without any hassle. You can also adjust different sharing permissions so that you can have granular control over your teammates’ access. Below are quick steps to do that.
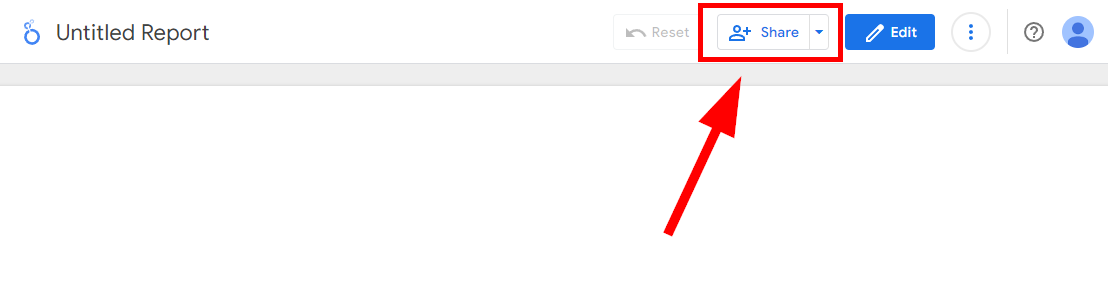
- Click on the share icon located on the top right of the screen to open the menu bar.
- Add the email address you want to share the report with
- Give permission access or roles such as Viewer or Editor.
- (Optional) You may also send a notification to those email addresses that now have access to the report. Tick Notify people.

- If everything is good to go, click Send.
If you need additional information, learn more about sharing a report in How to share a report.