Connect GA4 to Looker Studio: Tutorial, Templates & More! (2024)

How to export Google Analytics 4 data to your Looker Studio?
With Two Minute Reports, you can create comprehensive Google Analytics 4 Reports in Looker Studio. Here is a step-by-step guide to creating Google Analytics 4 Data to to Looker Studio to create dashboards.
To export data onto Looker Studio, you need to log in to Two Minute Reports through the apps portal .
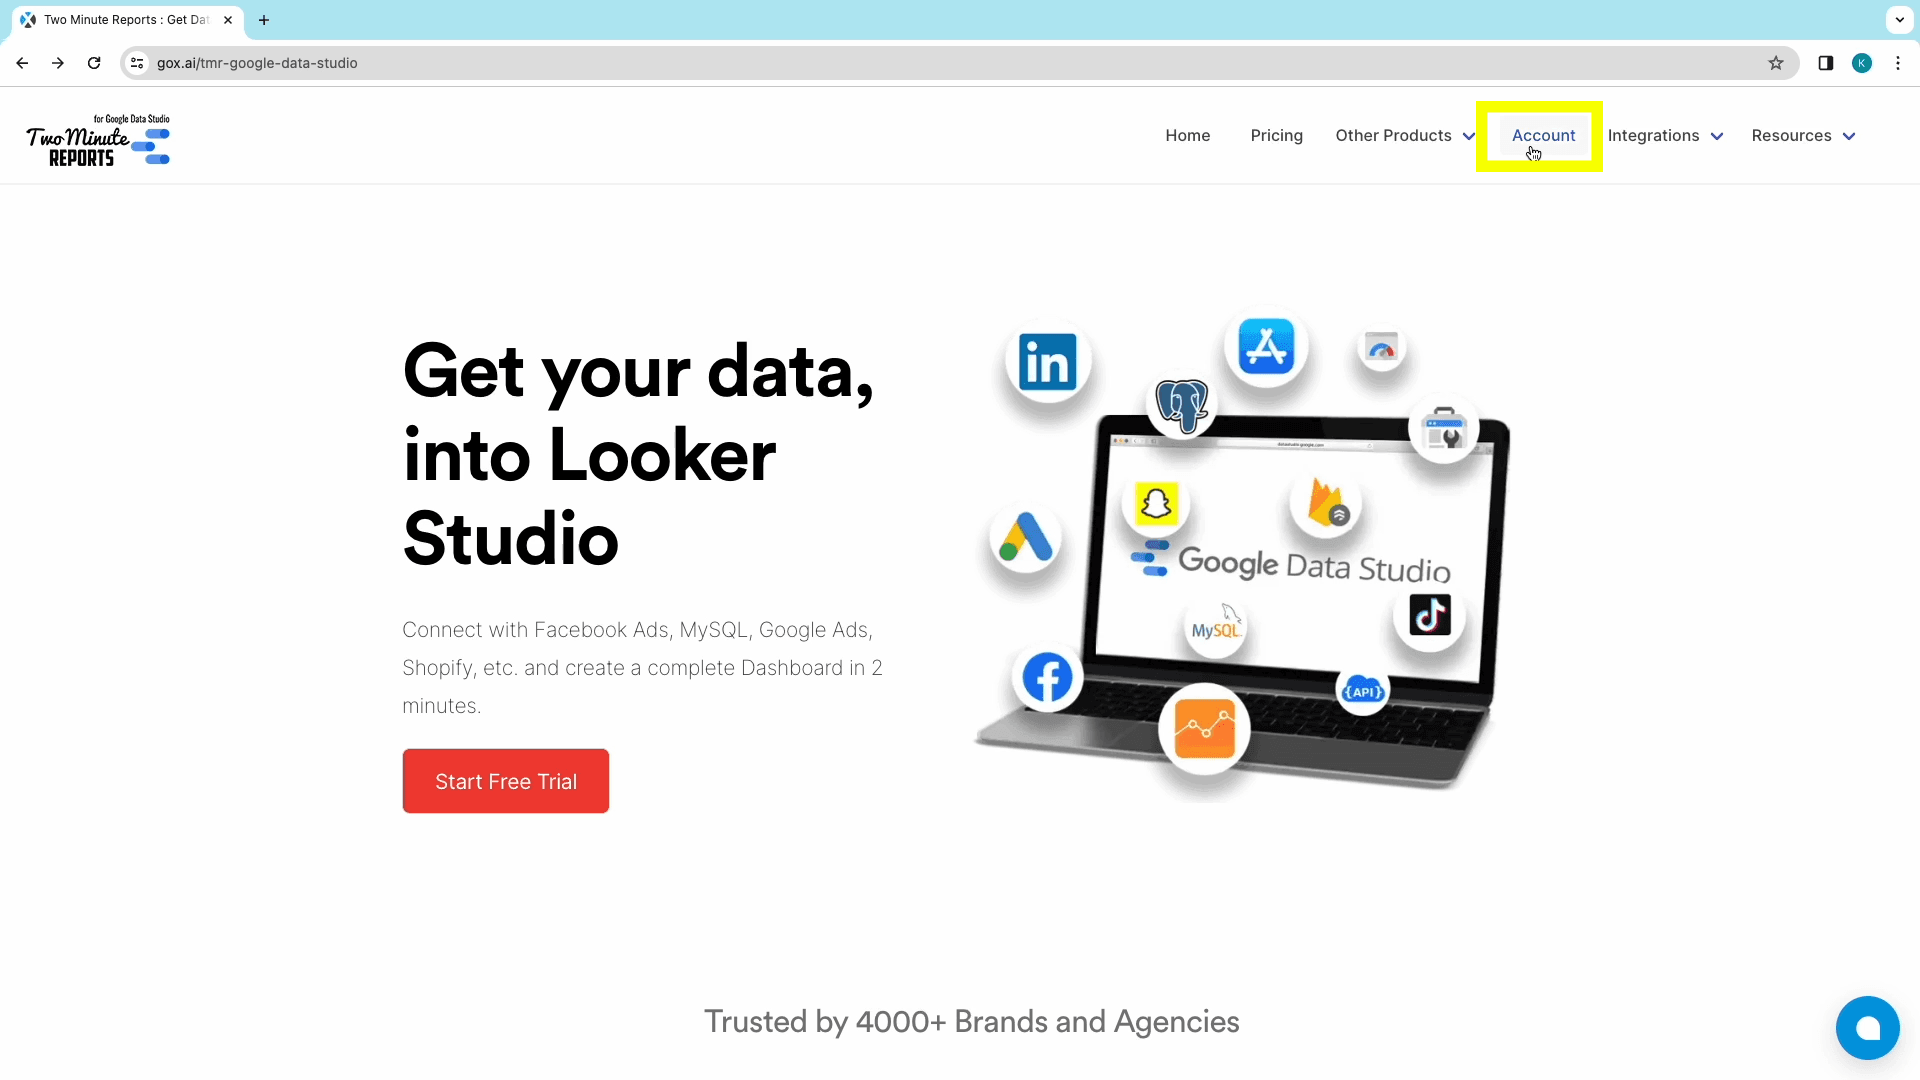
This is where you can access all data sources available in Two Minute Reports, including Google Analytics 4.
Once logged in, there are two methods you can follow to create a Google Analytics 4 dashboard on Looker Studio using Two Minute Reports:
Method 1: Creating a Google Analytics 4 Dashboard from scratch using Two minute Reports Sidebar.
Method 2: Creating a Google Analytics 4 Dashboard using in-built Templates of Two Minute Reports.
Method 1: Creating a GA 4 Dashboard from scratch
Step 1: Adding the Data Source
 Log into Two Minute Reports through the apps portal and into your team’s dashboard.
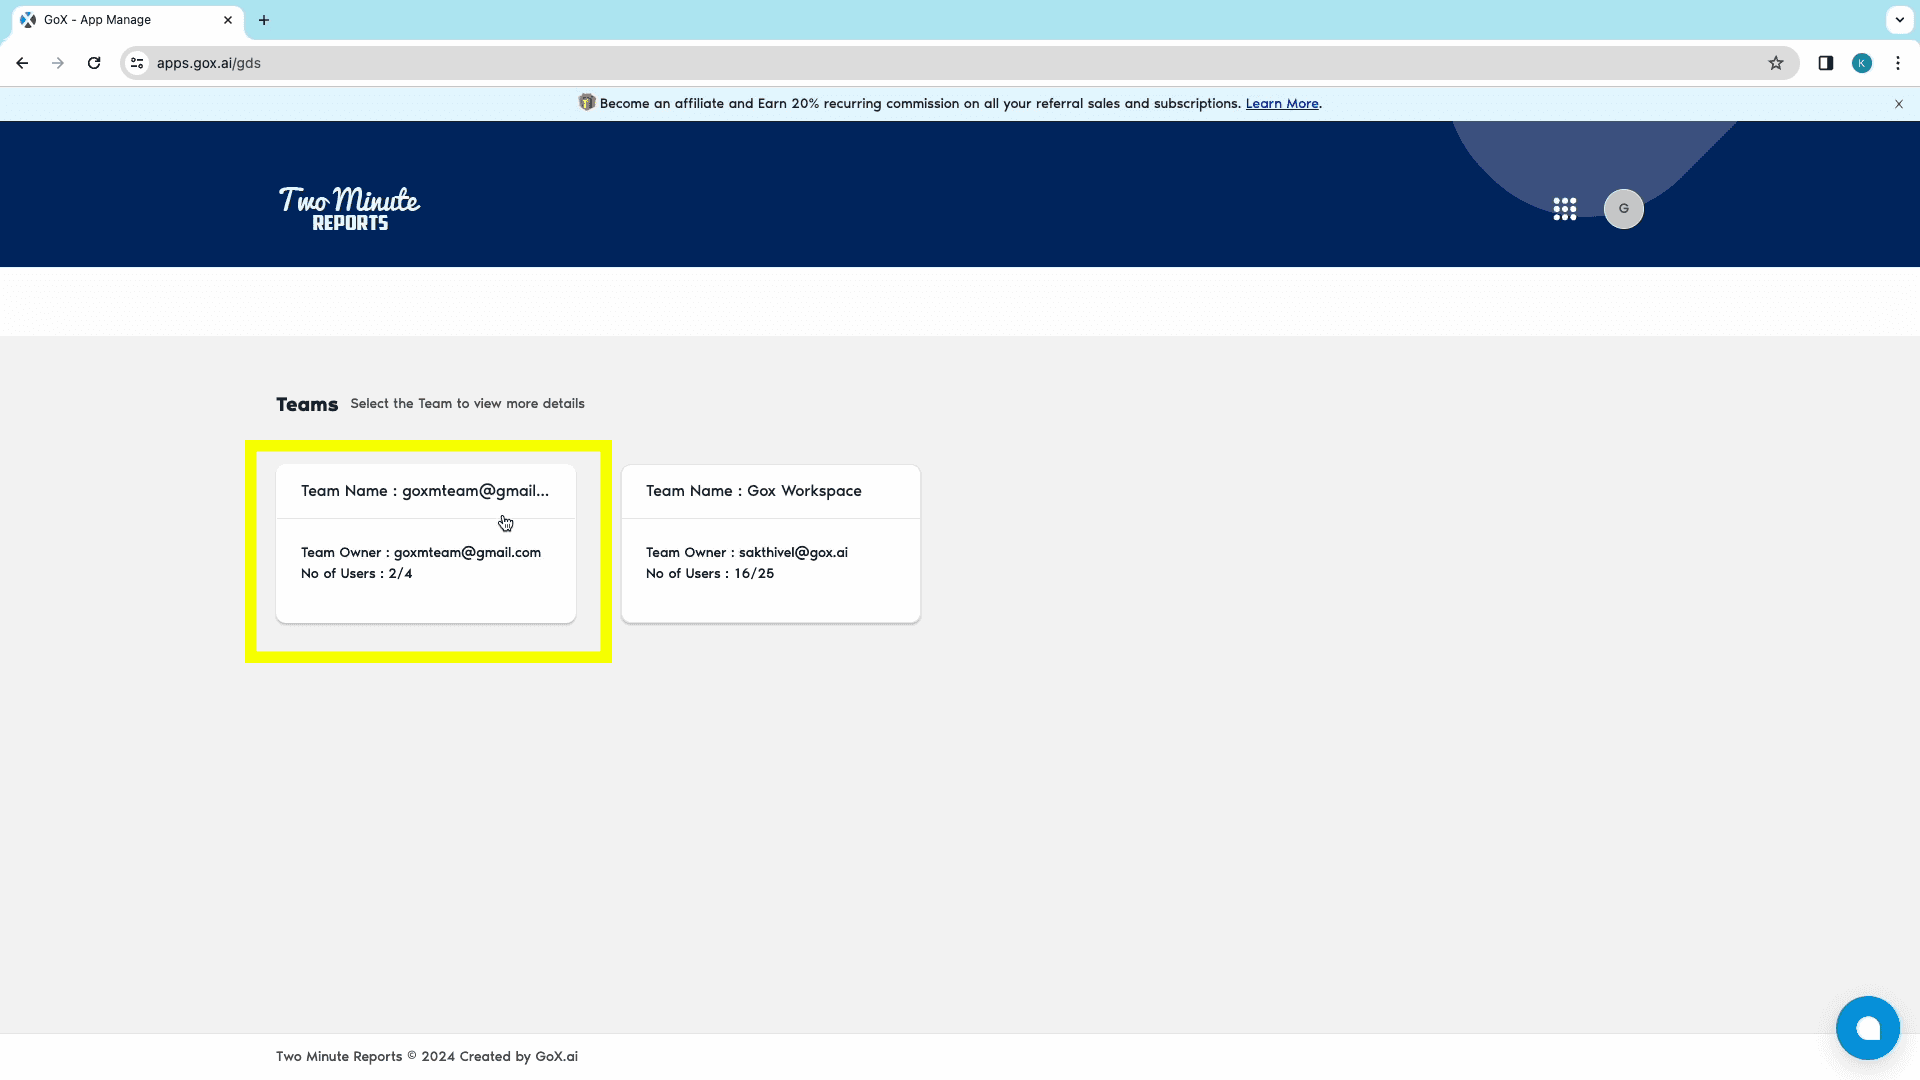
- If you work with multiple teams, you need to select the relevant team.
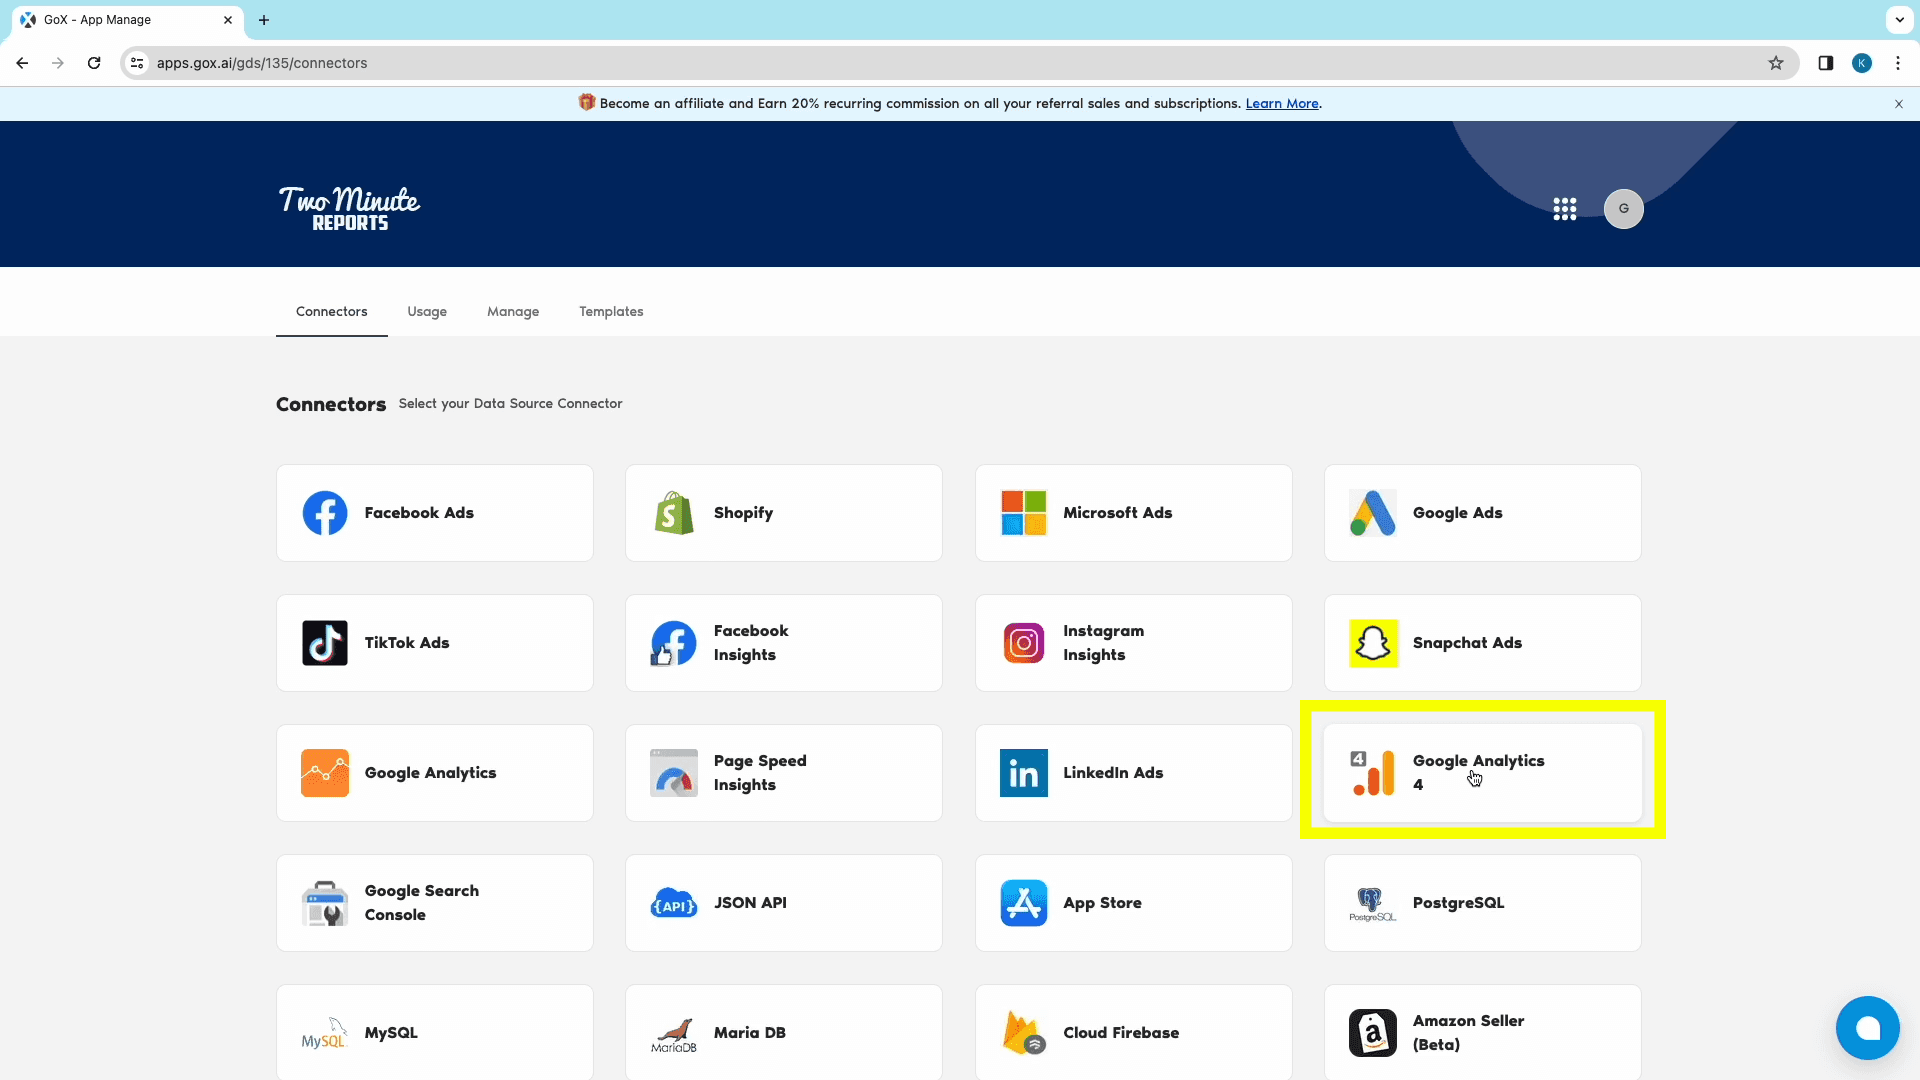
- If you aren’t added to multiple teams, you’ll be redirected to the Connectors Page.
- Choose the relevant data source connector from the connectors page: in this case, click on Google Analytics 4. You’ll then proceed to create a GA4 report.
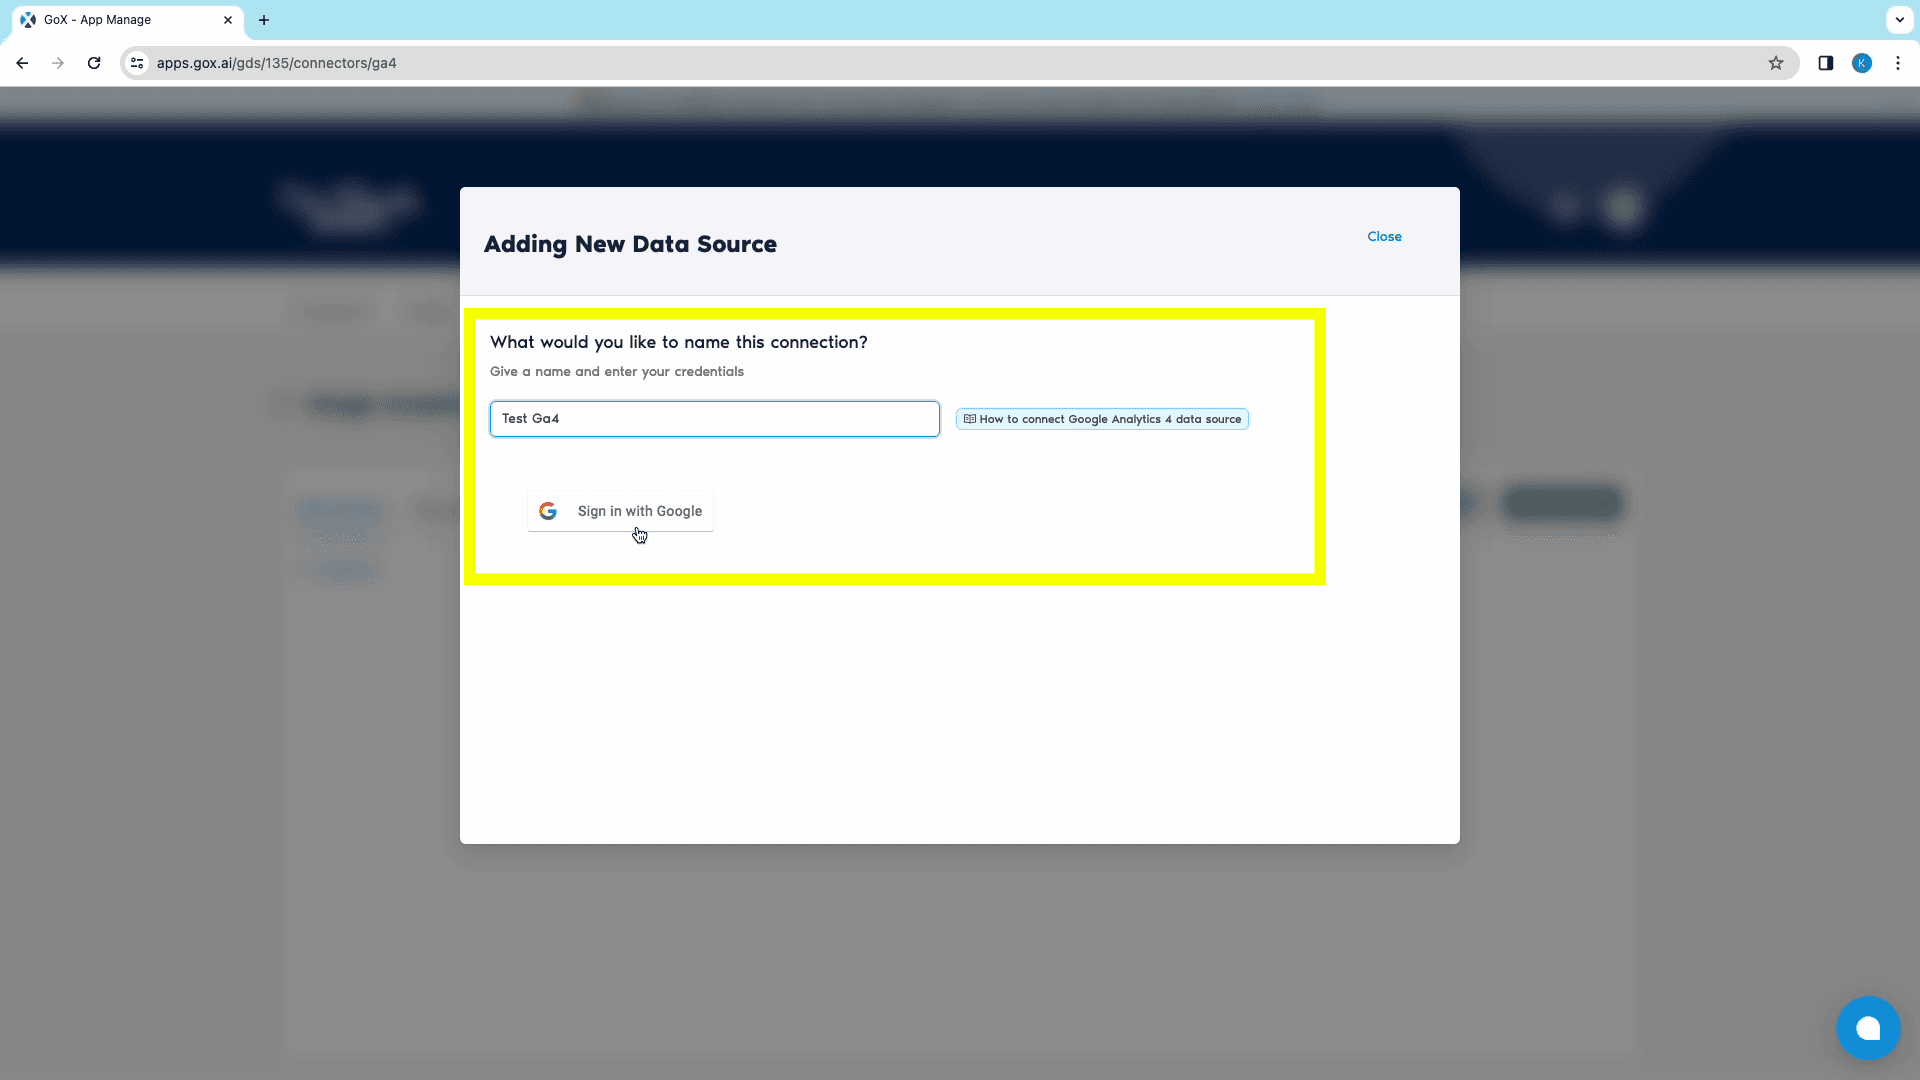
- Click “Add New” from the Data Sources section to open the “Adding New Data Source” window.
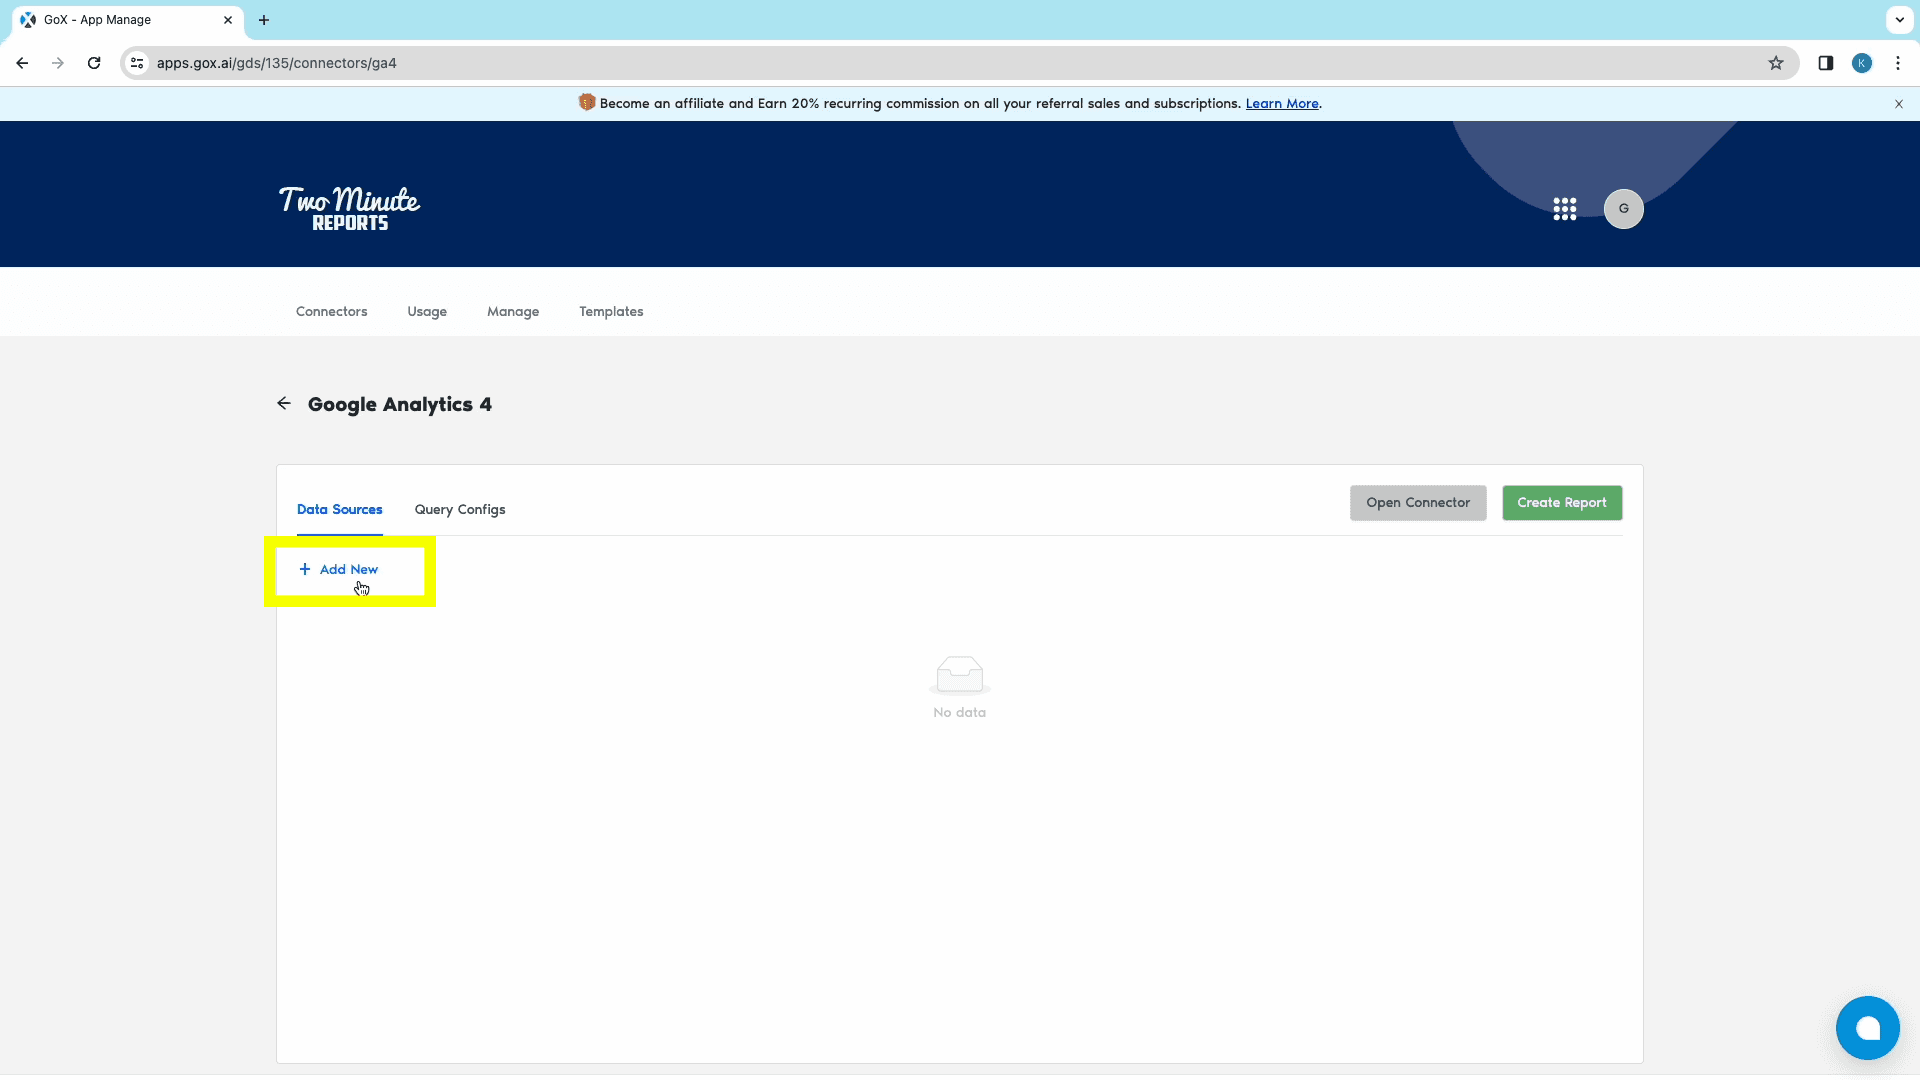
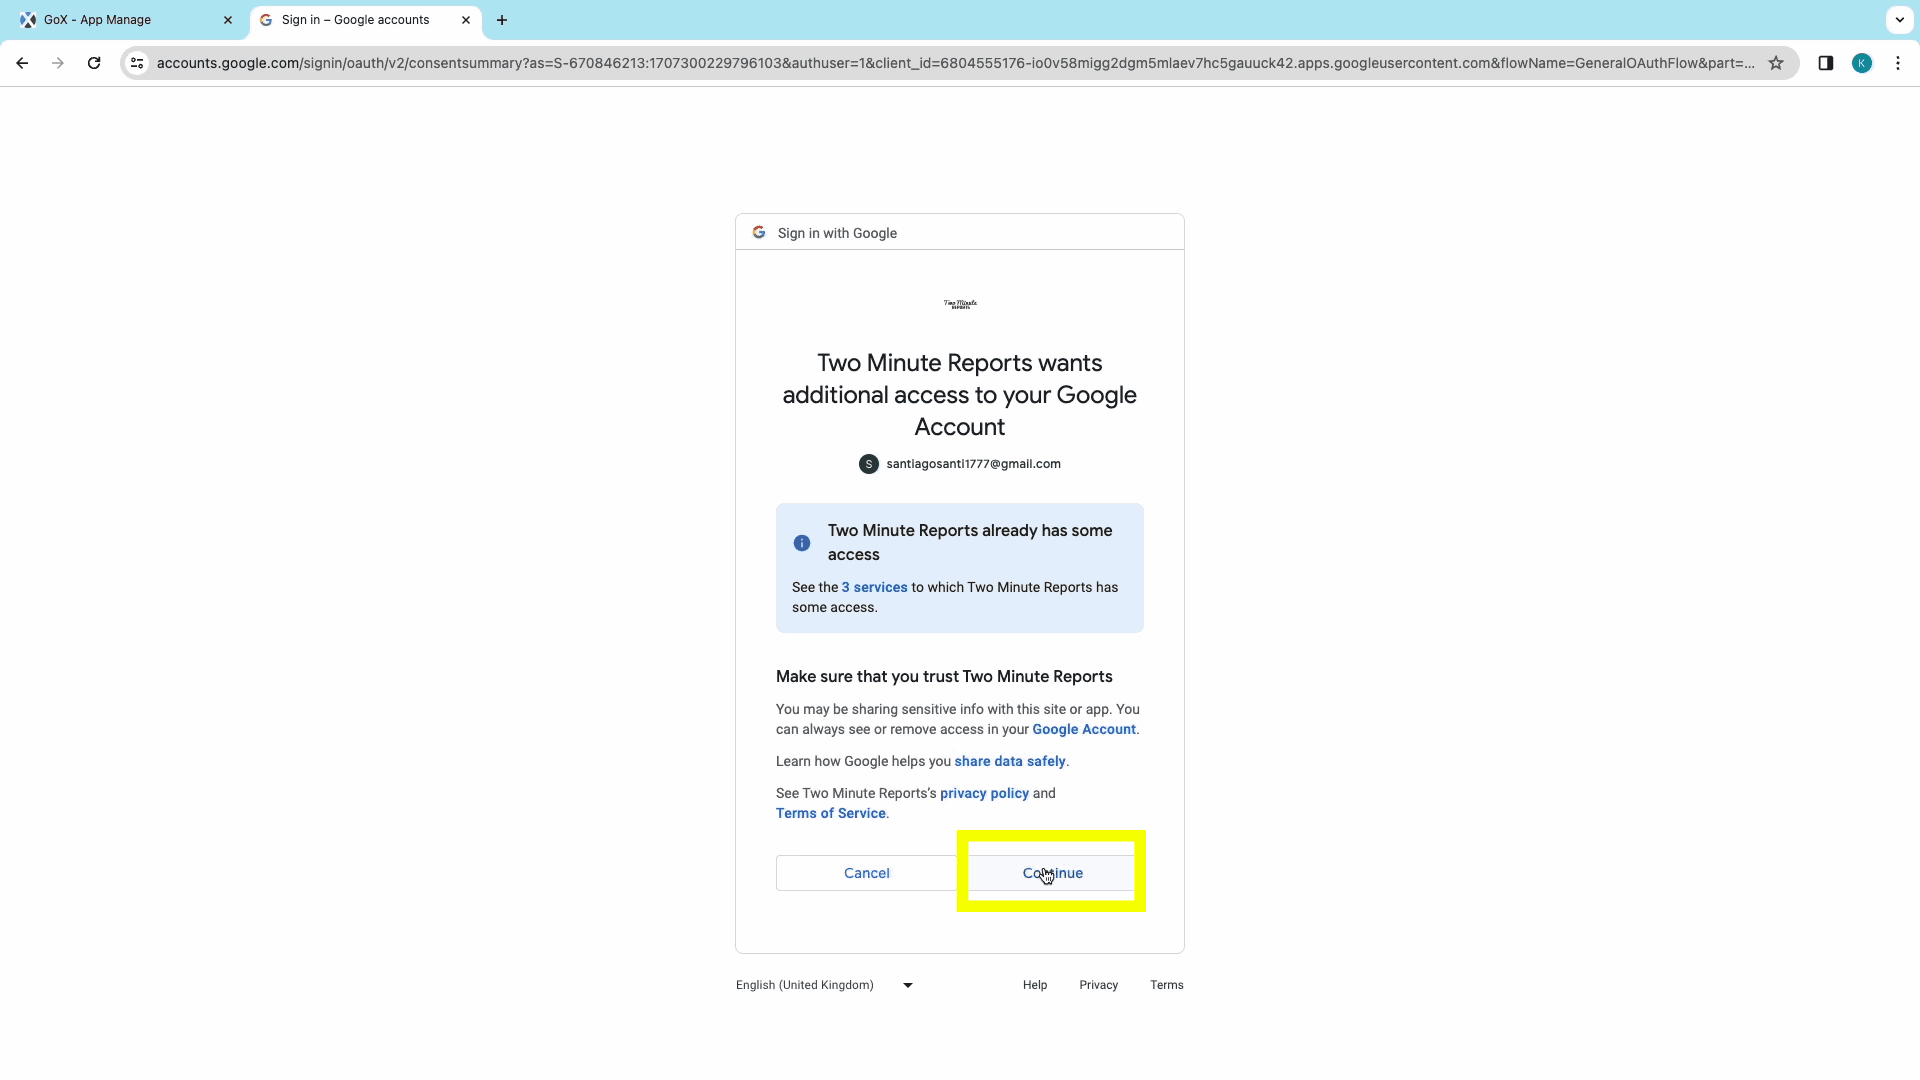
- Once you’ve named your source, log into your Google Analytics account to authorize TMR’s Google Analytics Looker Studio connector. With this step, your Google Analytics account has been added as one of the data sources.
Step 2: Query Configuration
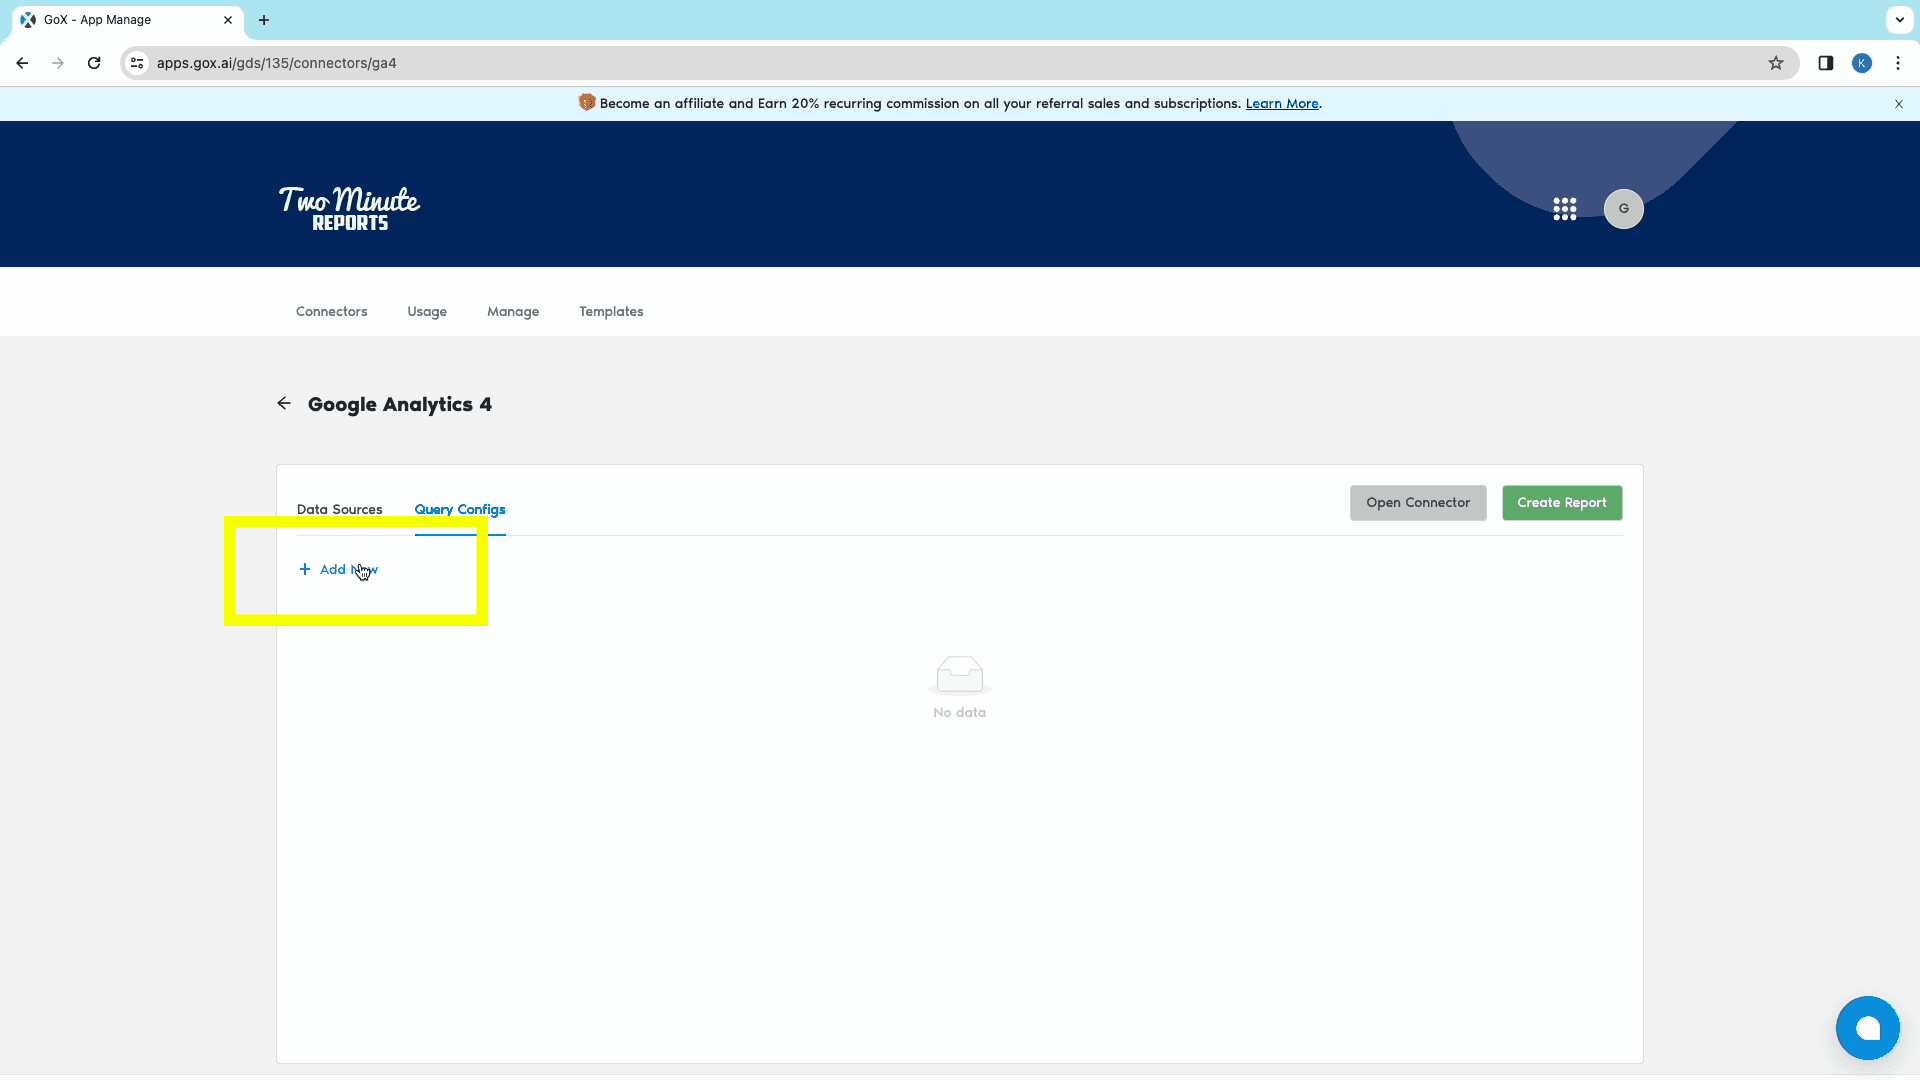
- Next, we can shift to the “Query Configs” section to start configuring a query to export data from GA4 to Looker Studio.
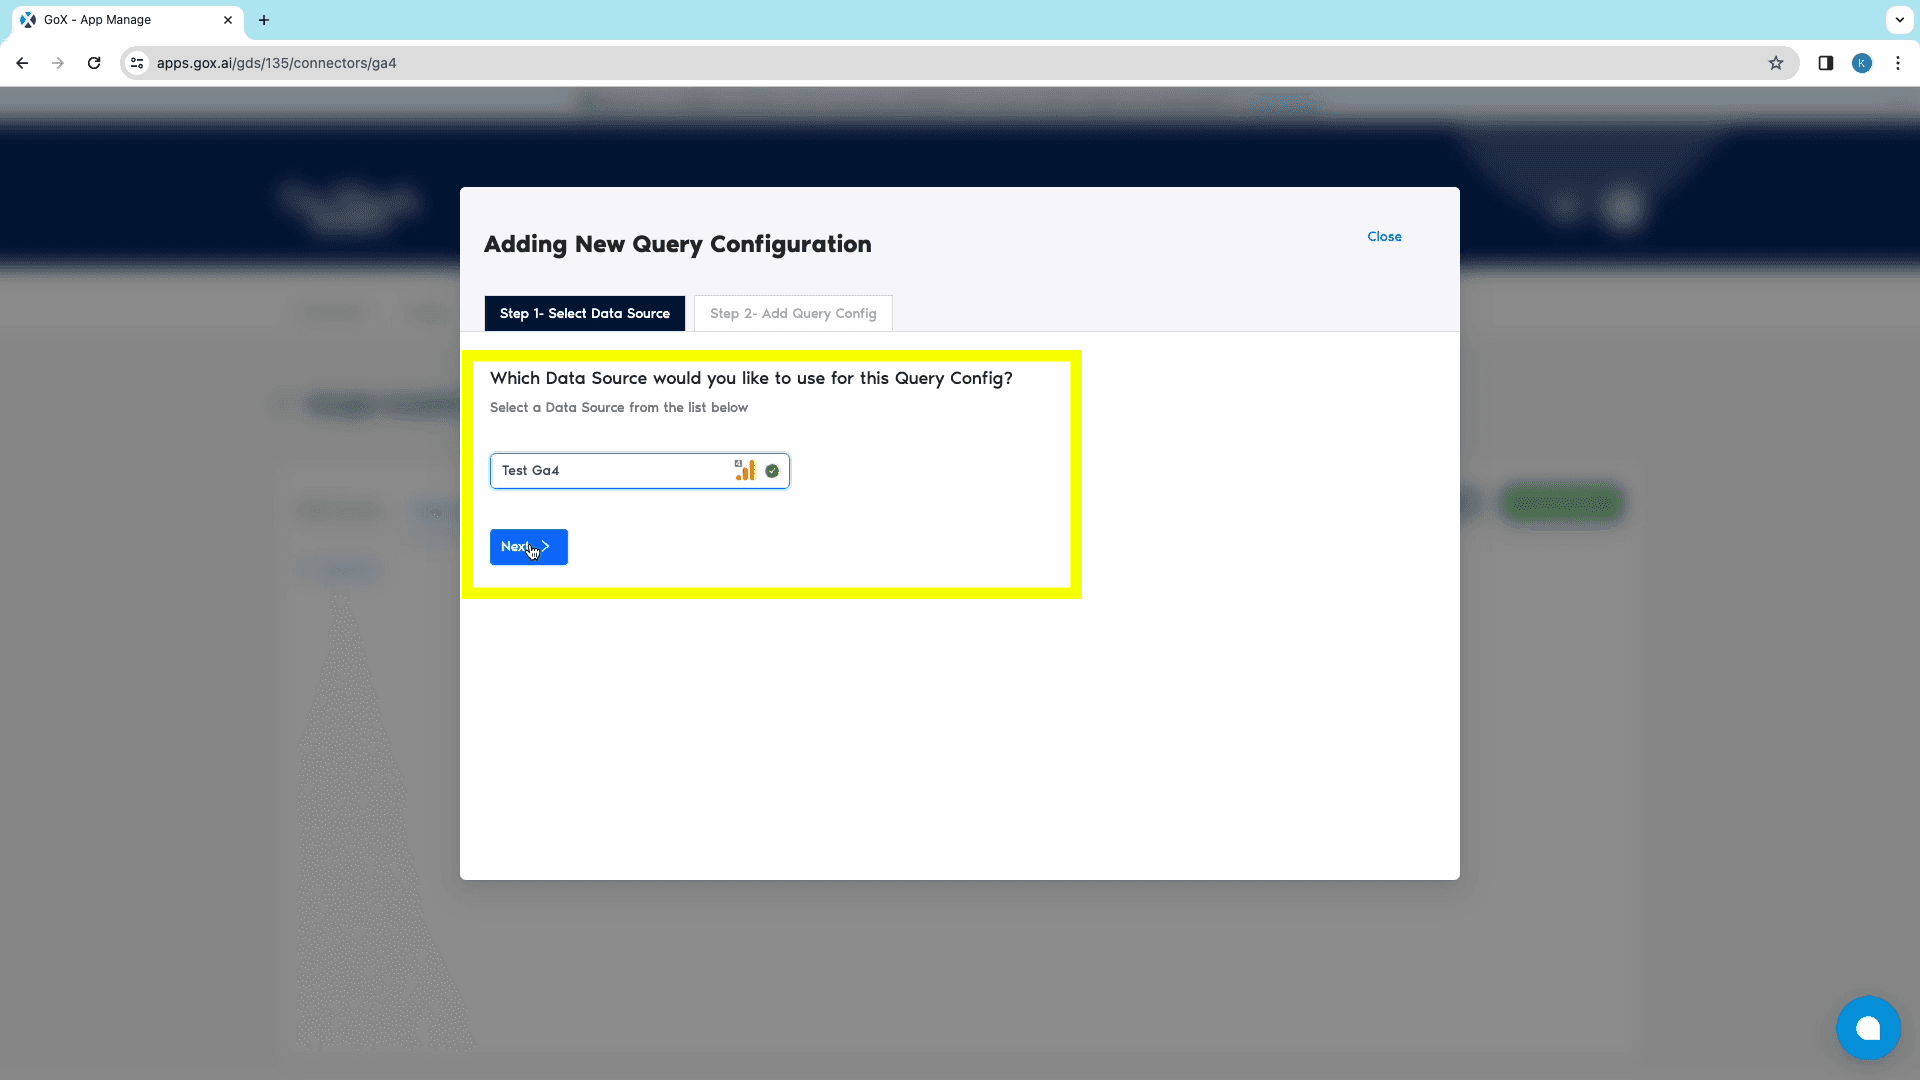
- Click “Add New” to open the “Adding New Query Configuration” window. `From here, select the data source which you’ve already created.
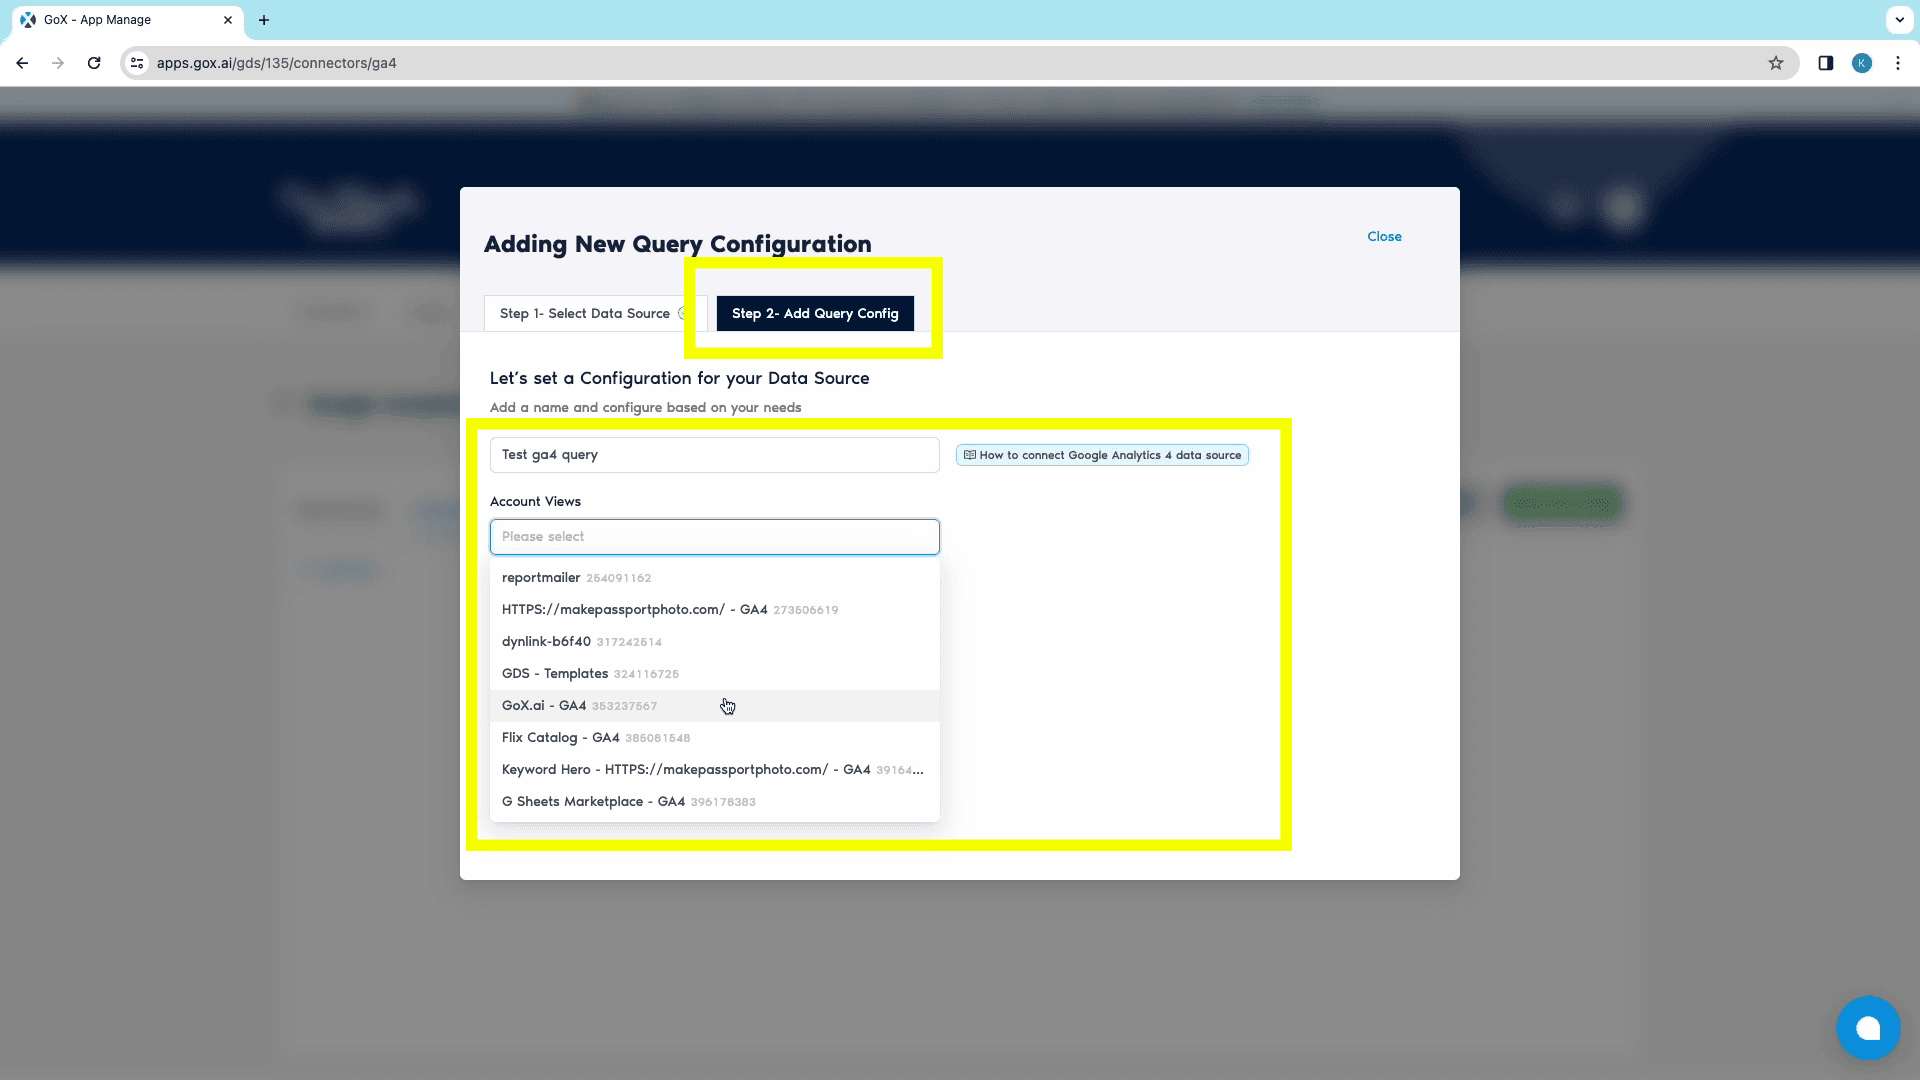
- Move on to the next tab to Name the Query, and click on the next button.
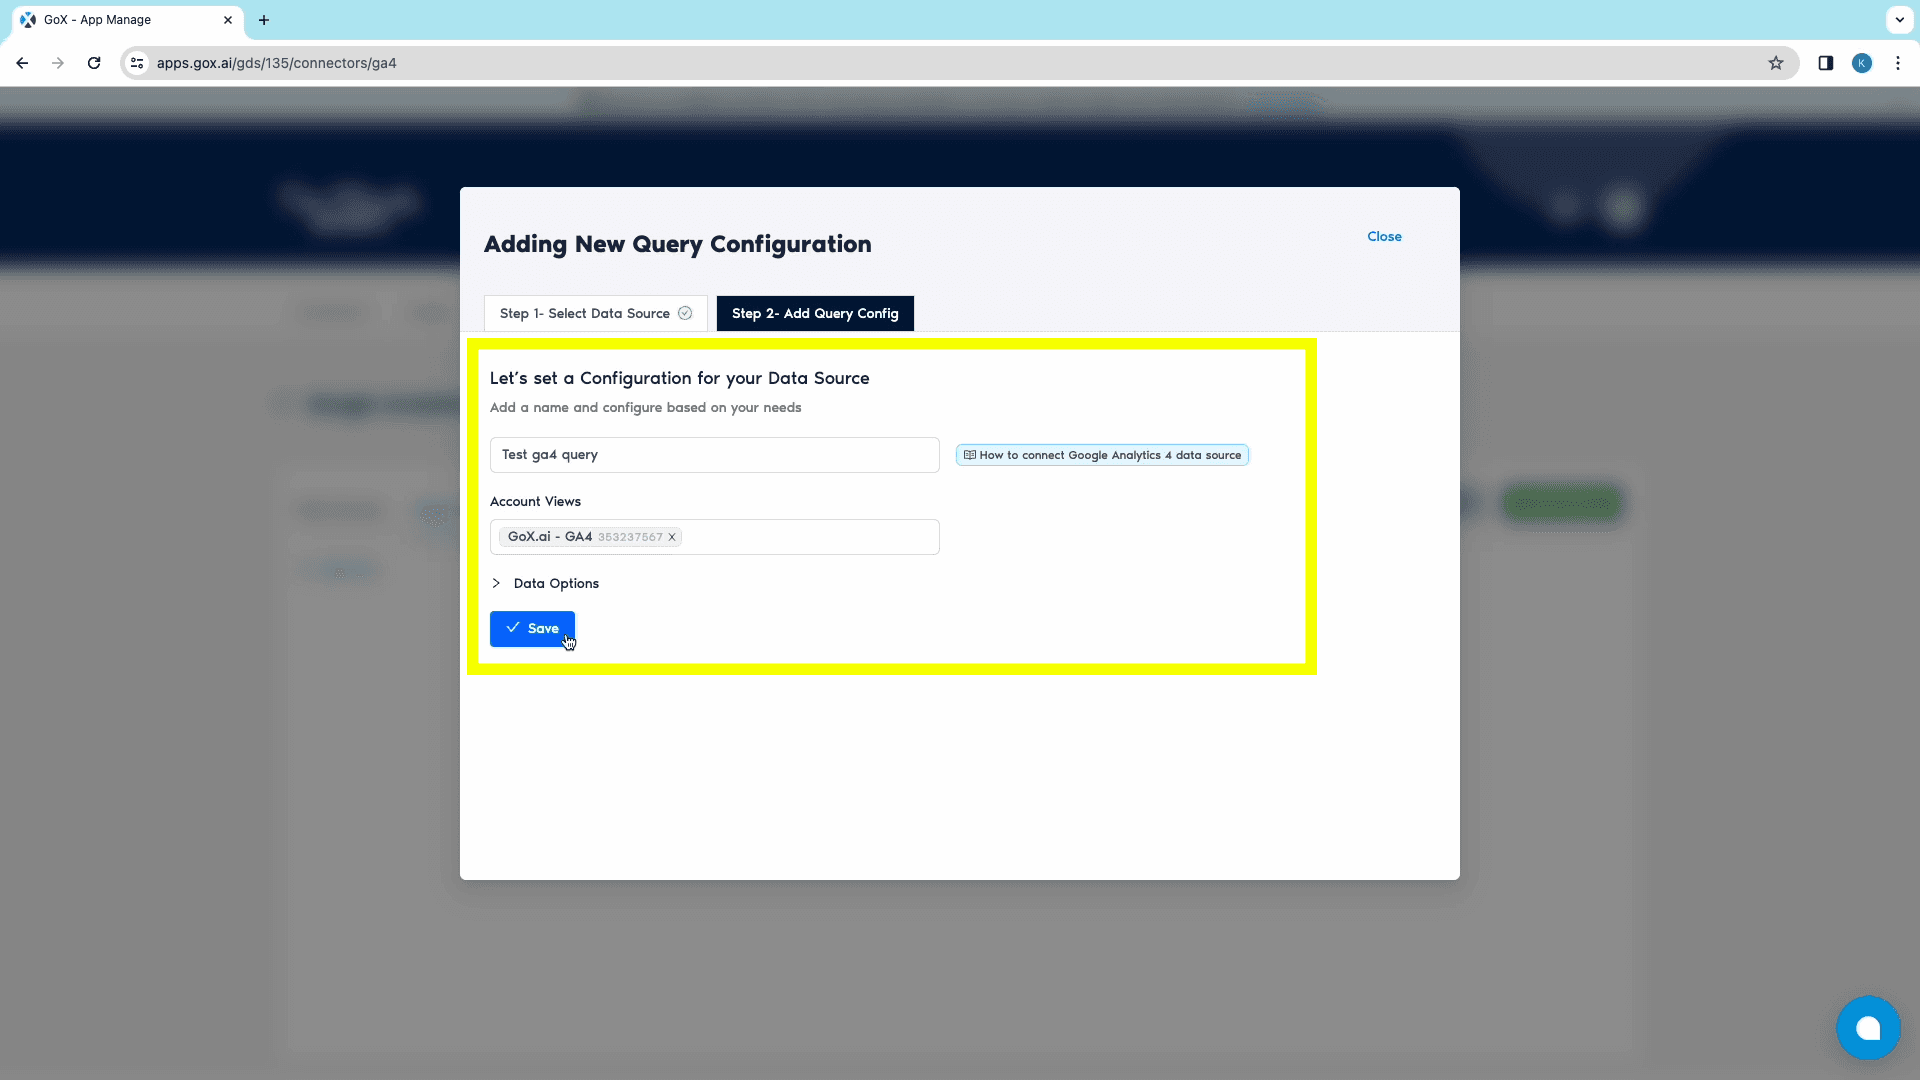
- In the next tab, choose the required Account Views. From this tab can also modify your data from the Data Options dropdown below.
- Click on Save to complete creating the Query Configuration.
Step 3: Creating the Looker Studio dashboard
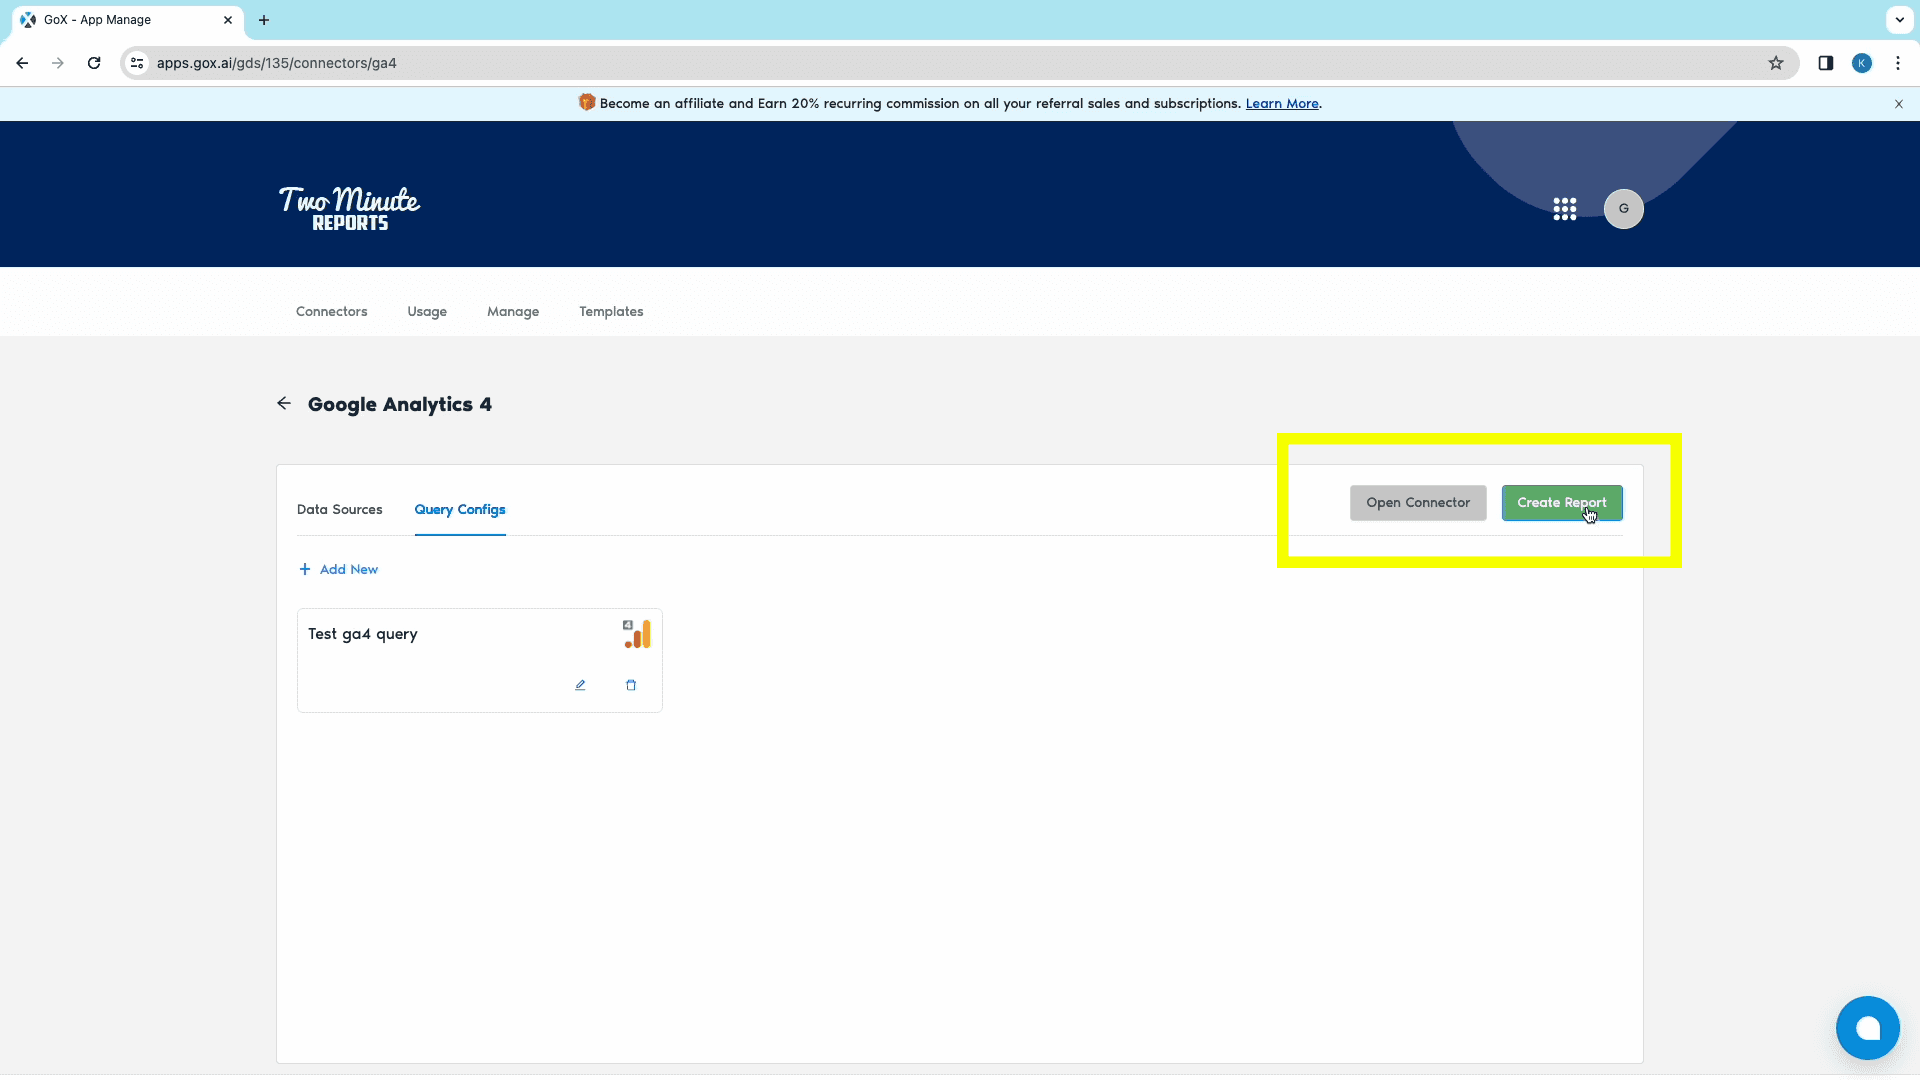
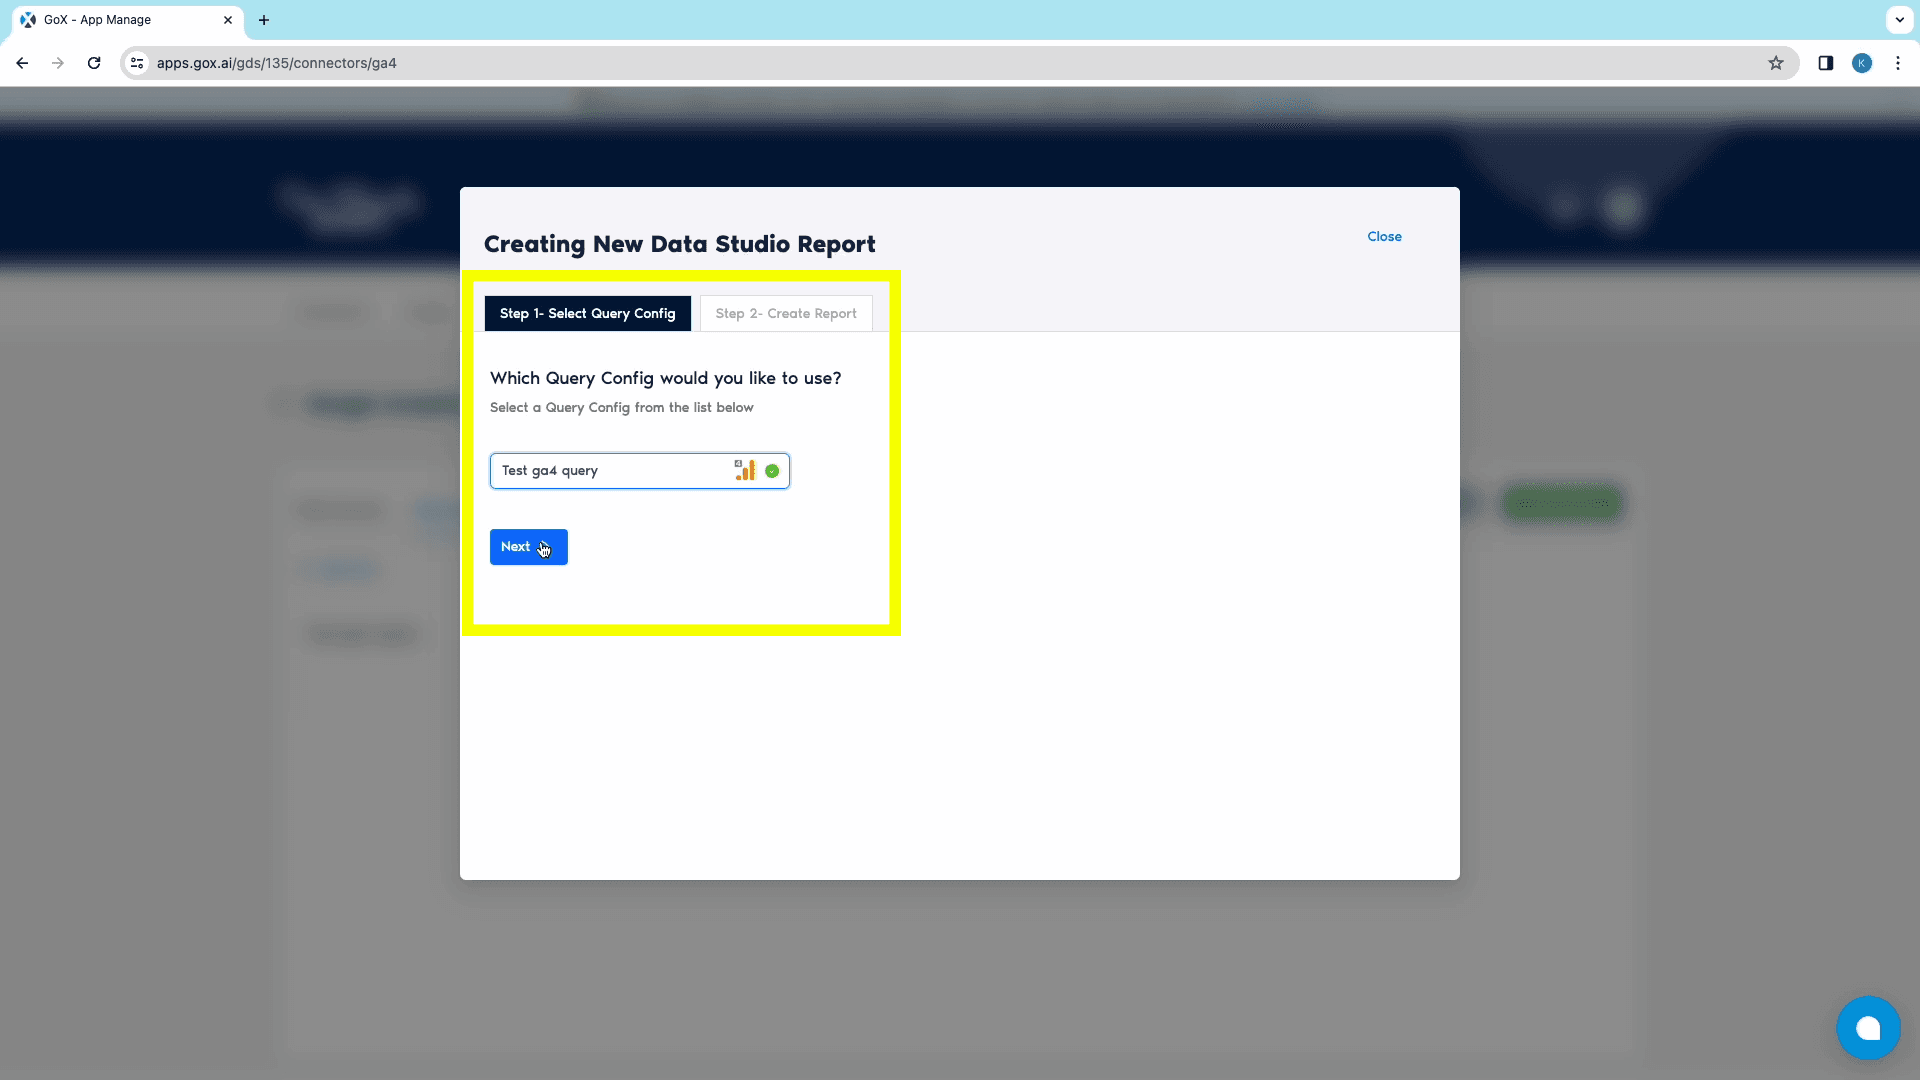
- After adding data source and query configs, click on the green “Create Report” button to open the “Creating New Data Studio Report” window.
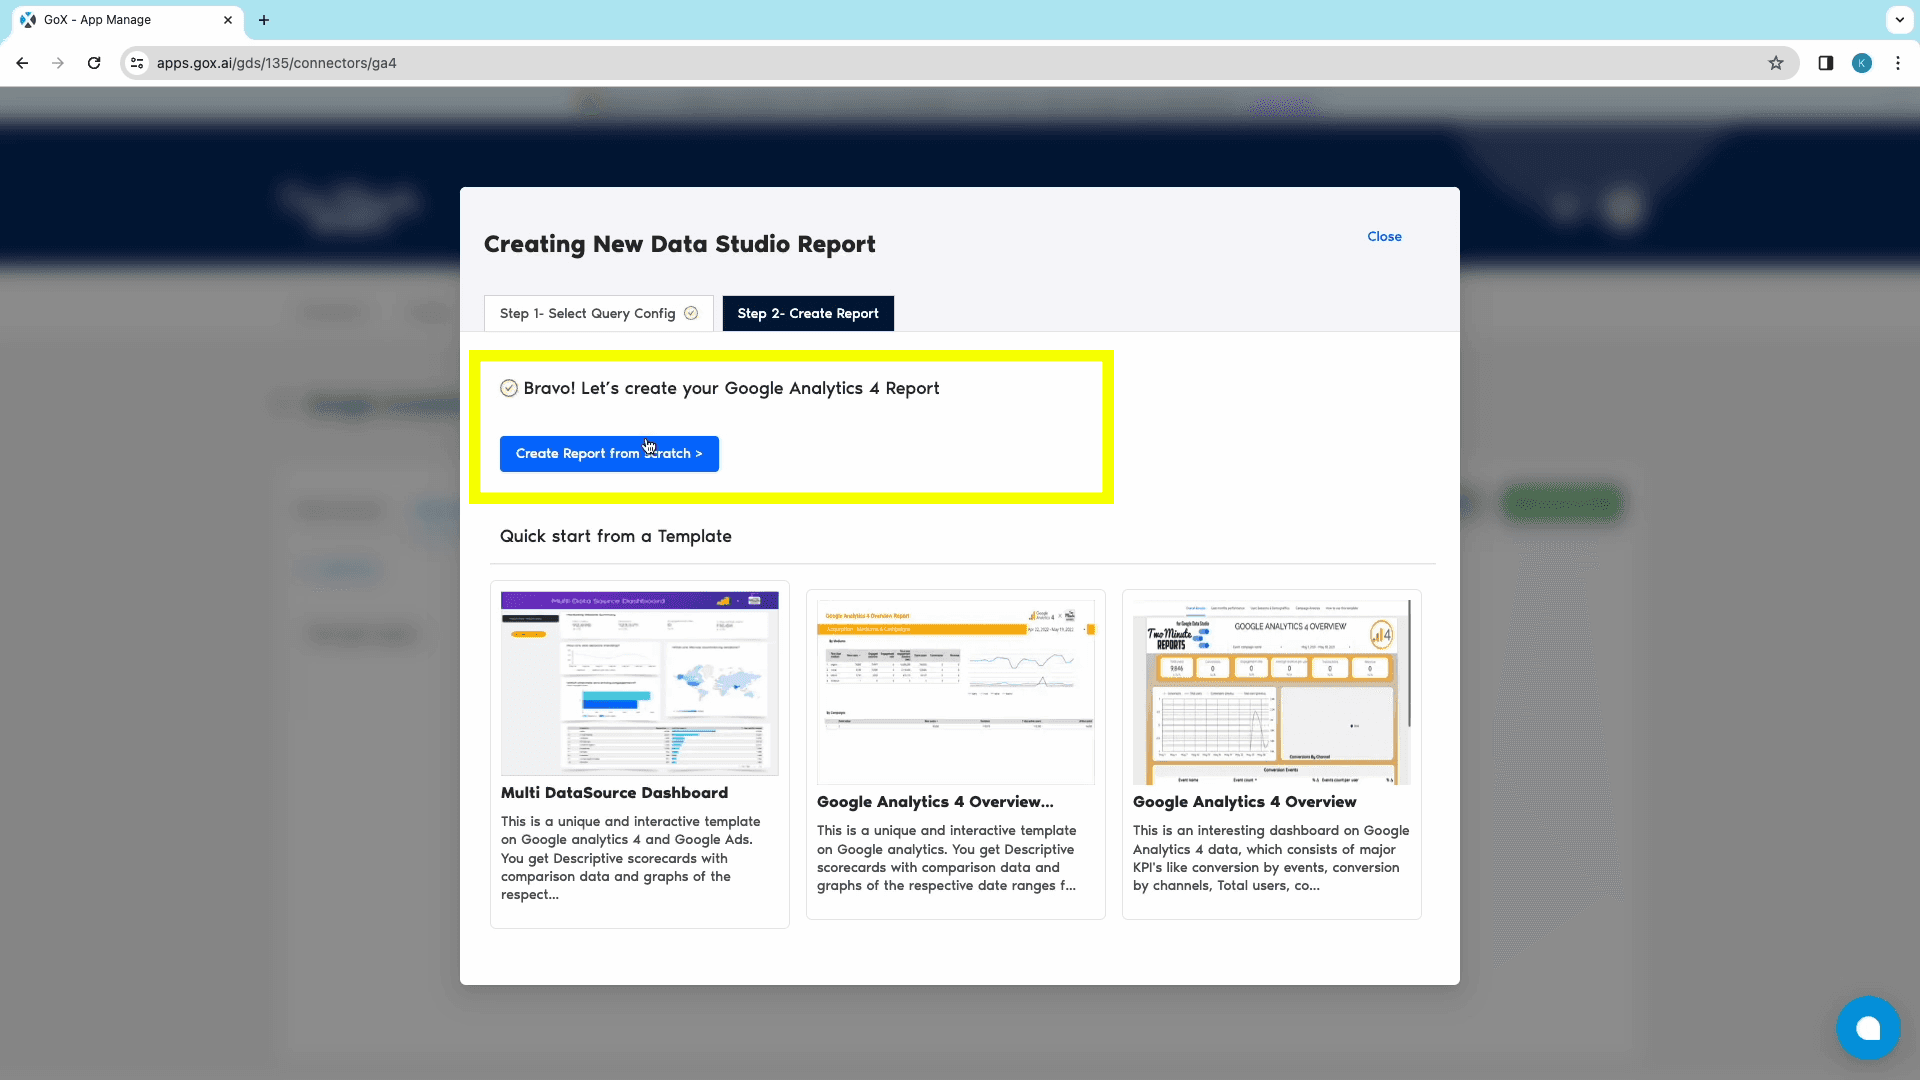
- From this window, choose the relevant previously created Query Config from the search bar, and click on the Next button.
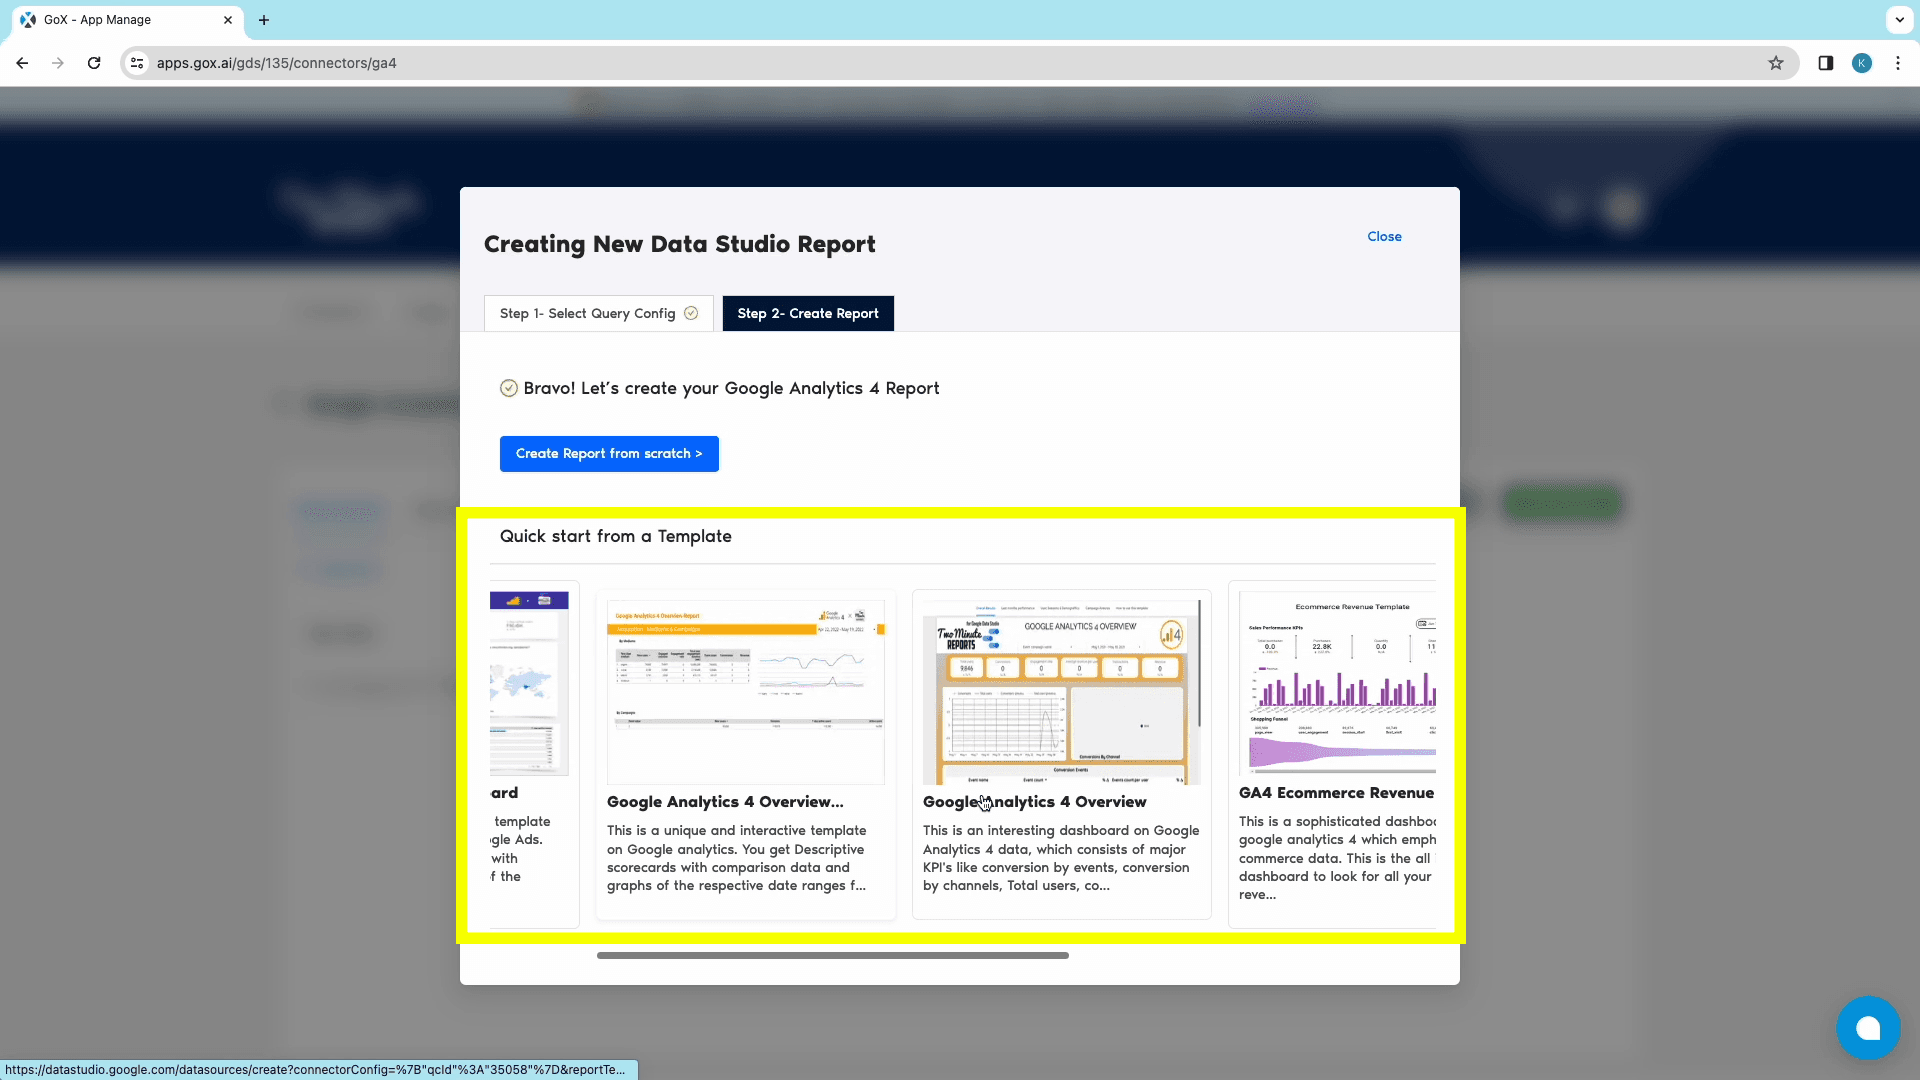
- From the next Create Report tab, click on “Create Report from scratch” to open Looker Studio.
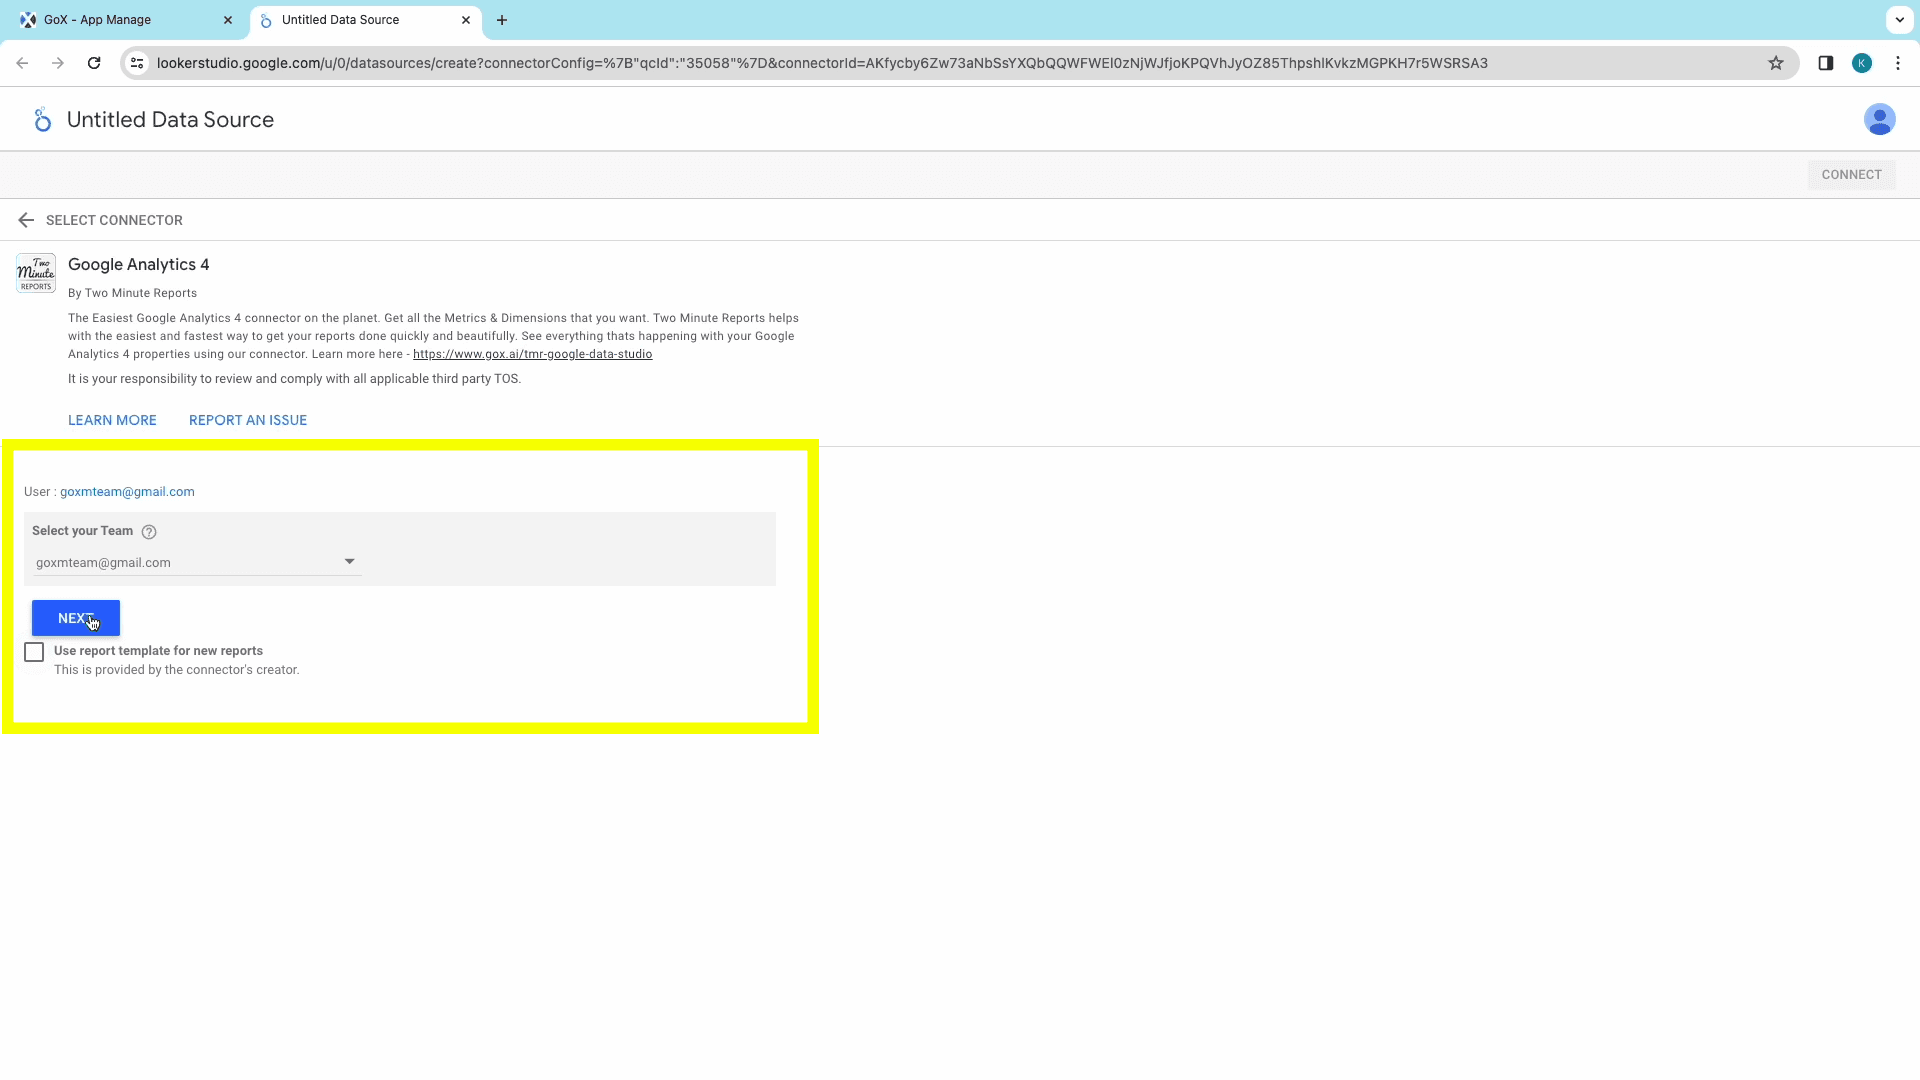
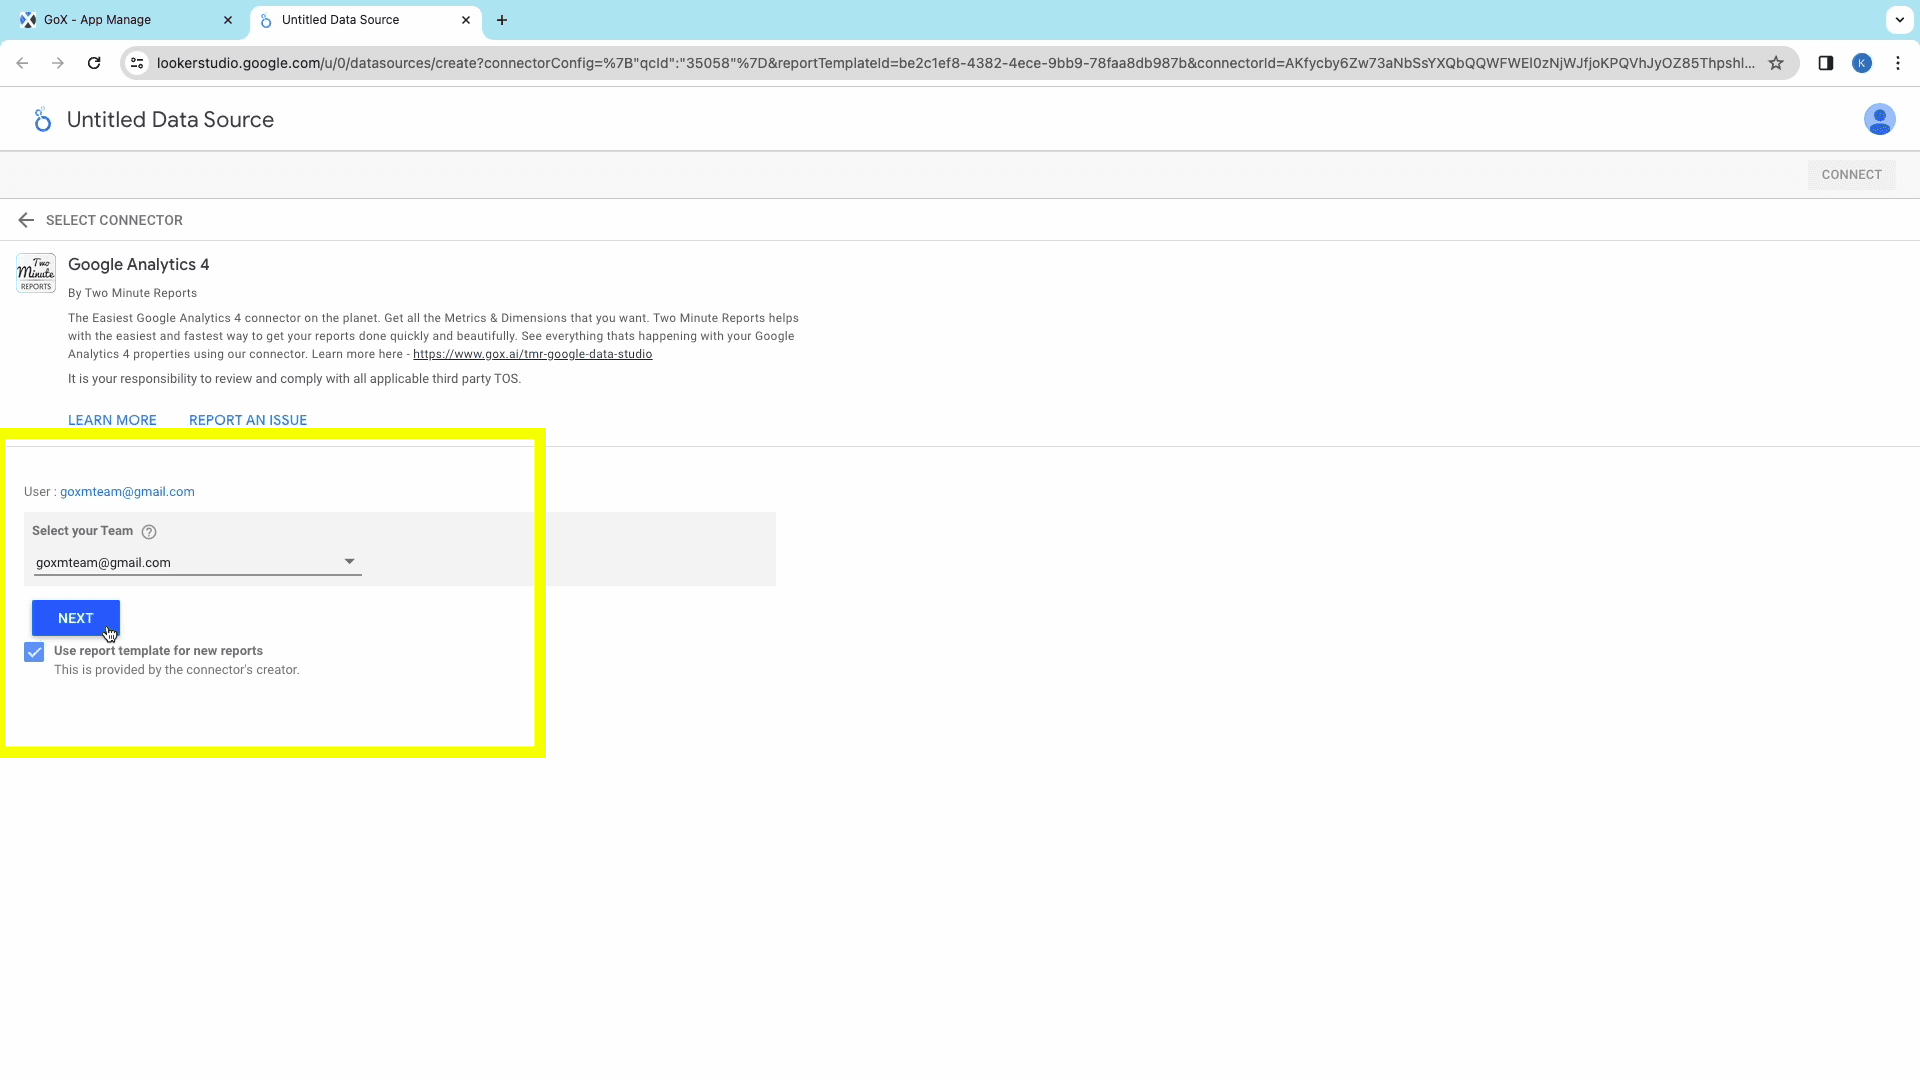
- Once Looker Studio opens up, choose the relevant team. Also, ensure that “Use report template for new reports” is unchecked. Once done, click on Next to continue.
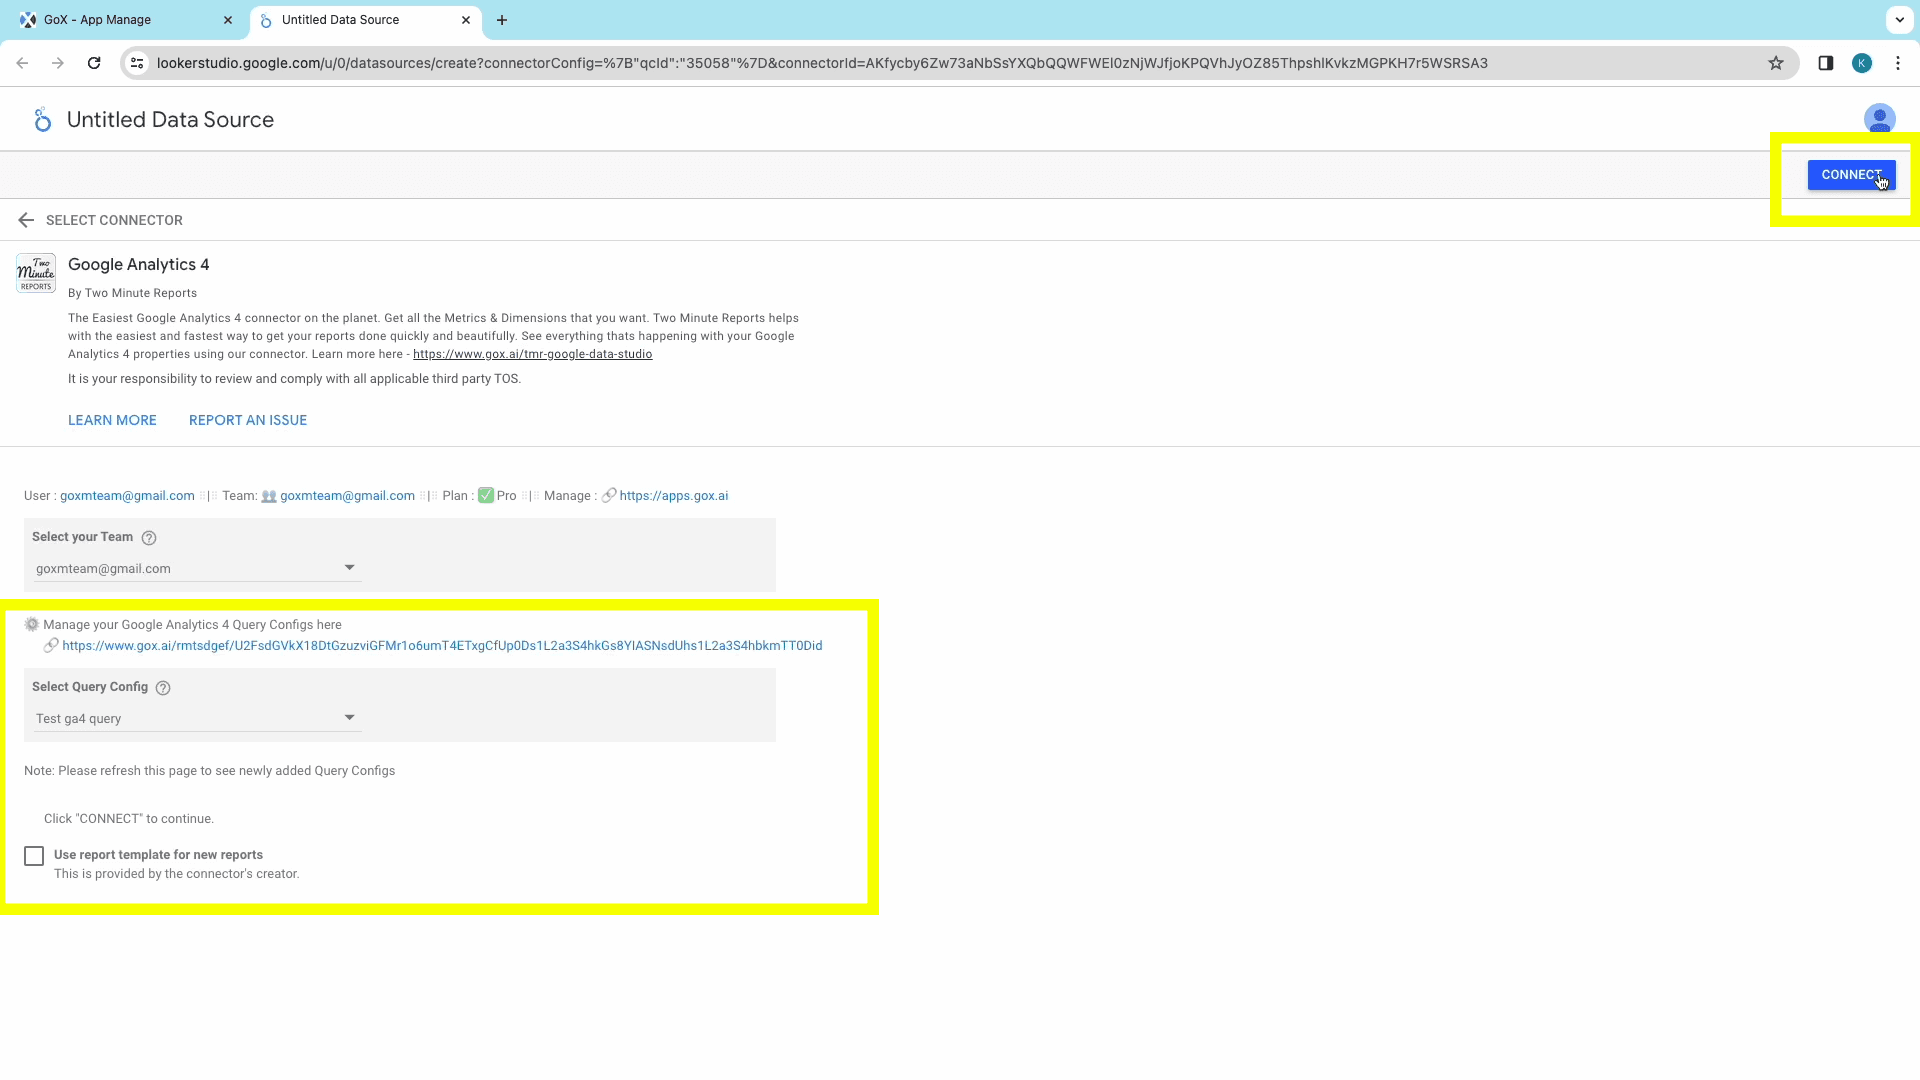
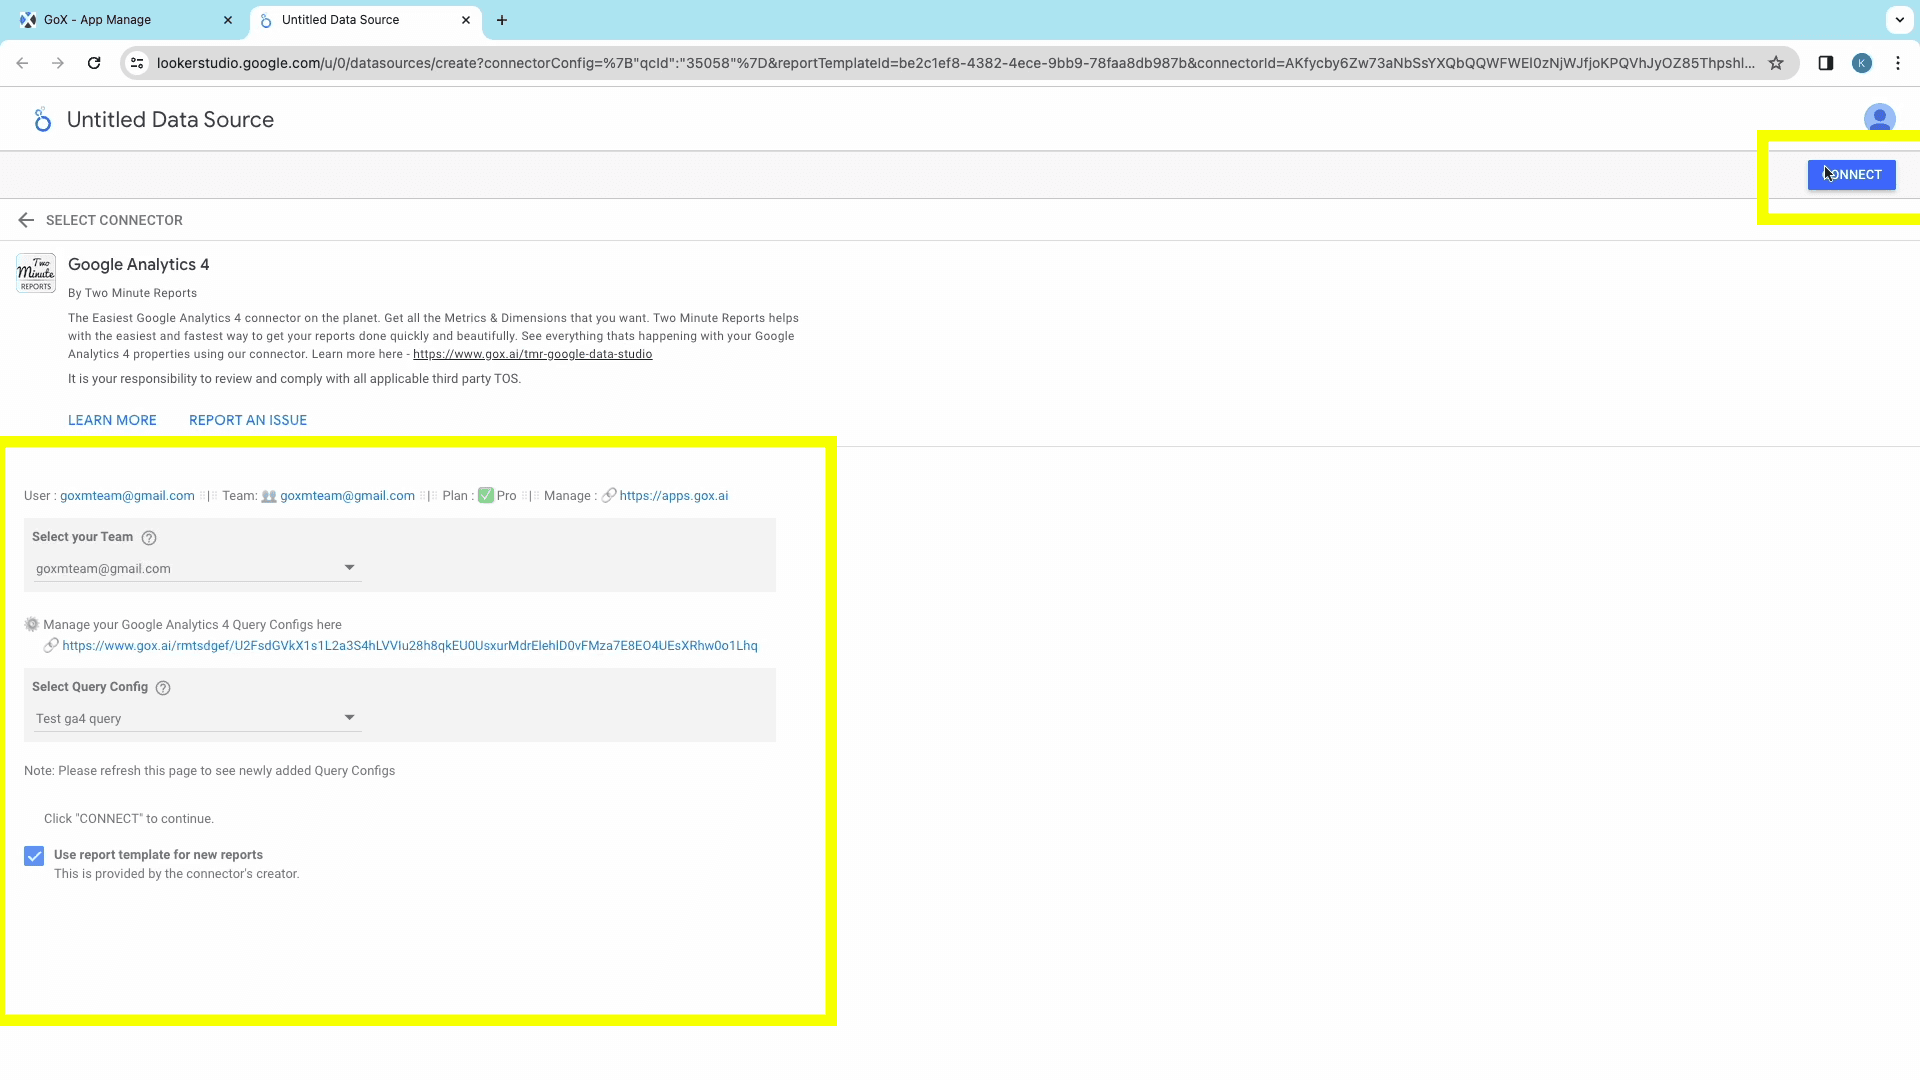
- Then, select the relevant Query Config for the data source and click on the Connect button at the top-right corner. This step connects TMR to Looker Studio.
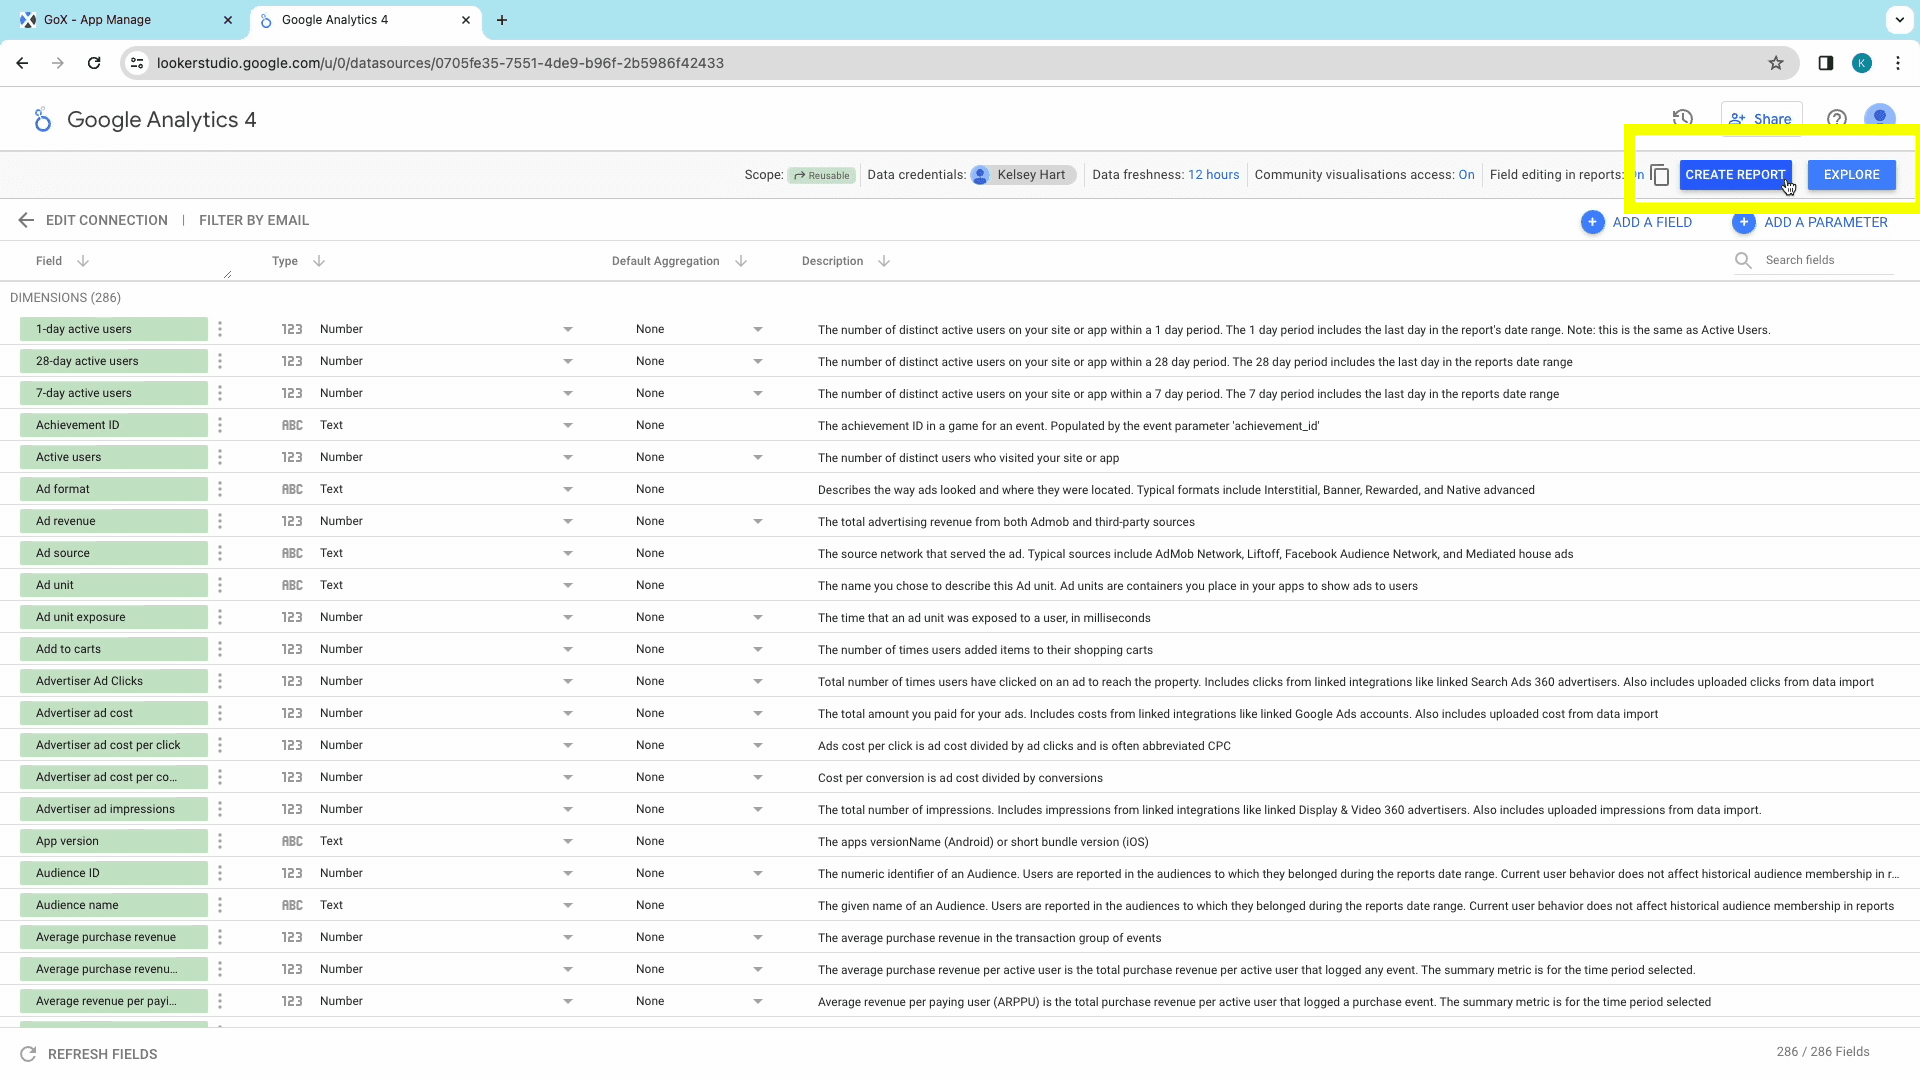
- The next window shows all the available Google Analytics 4 metrics, ready for the report. You can modify the metrics, or click on the Create Report button at the top-right corner.
- You’ll then be notified about the addition of new data to the Looker Studio report. Click on Add to Report to authorize the activity.
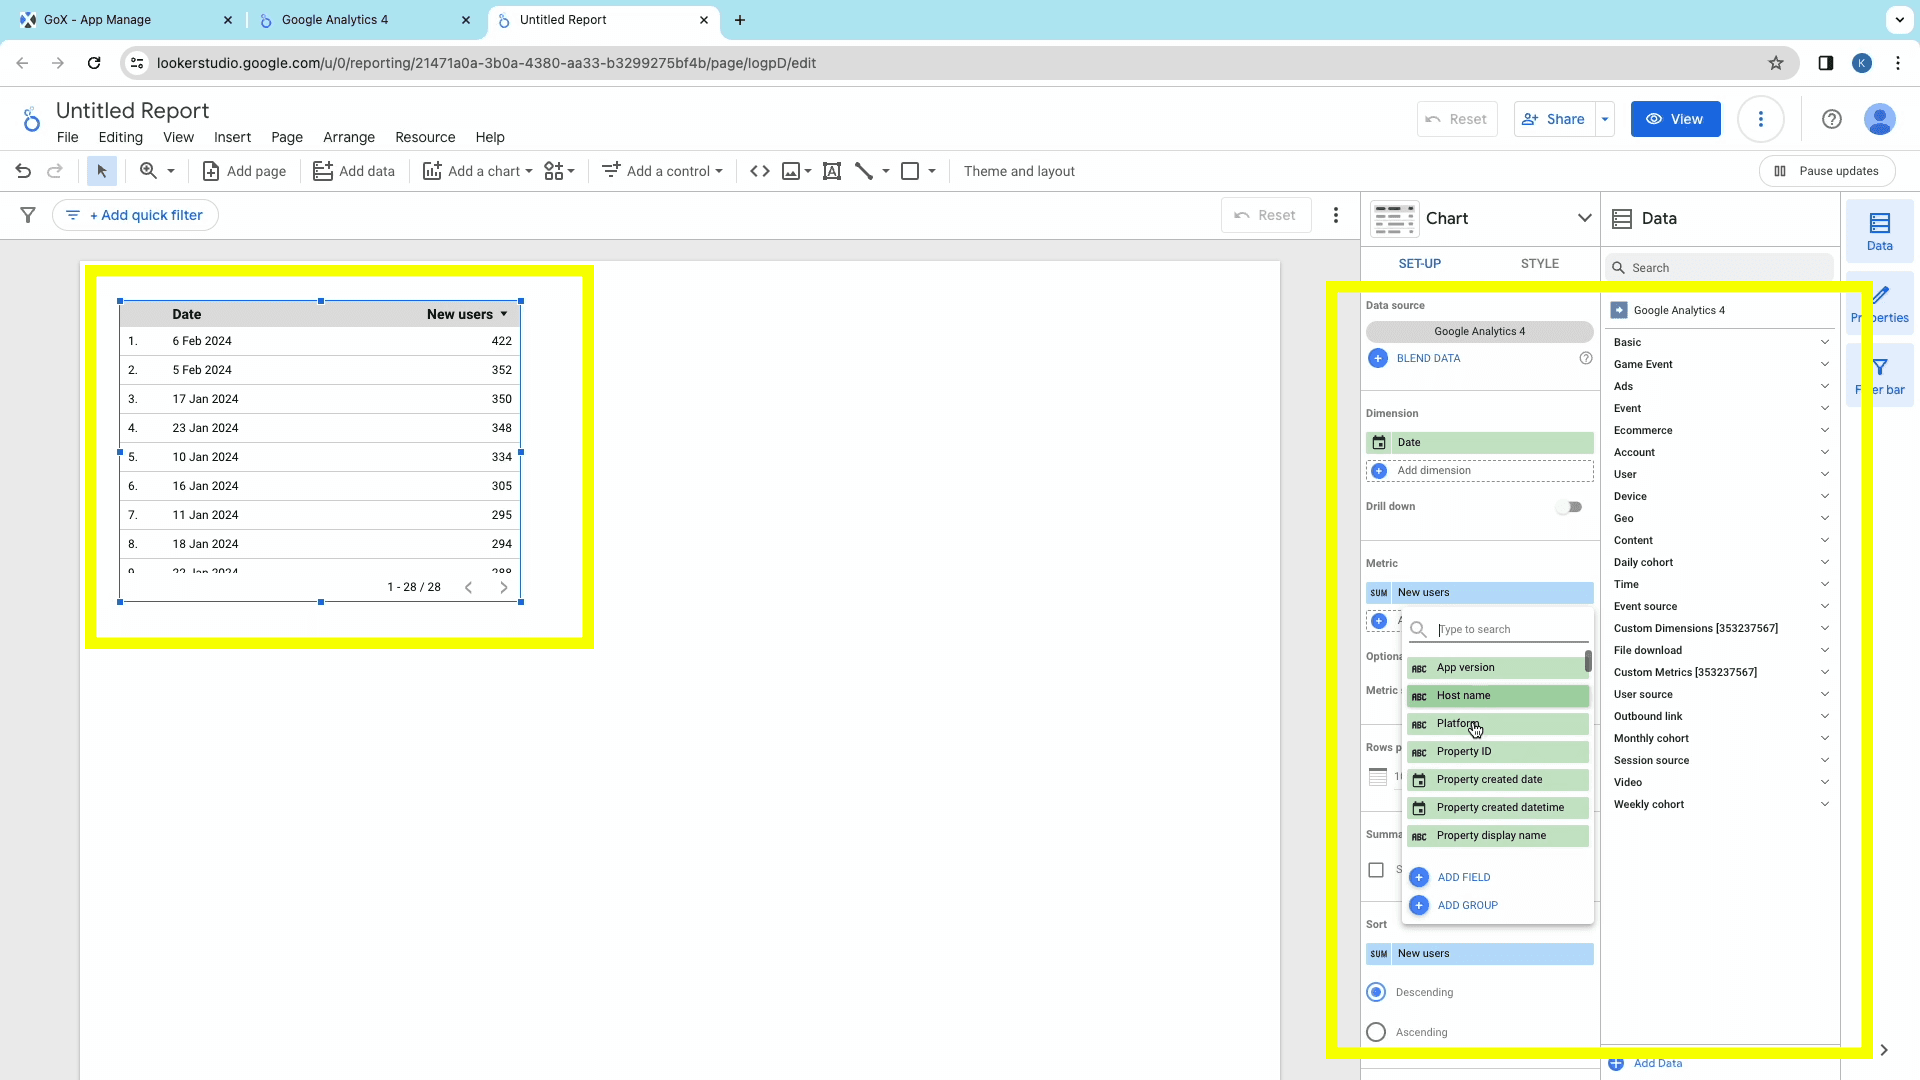
You now have all the metrics and dimensions available on the sidebar to add to the report. To create a table/chart with a particular metric:
- Create a table or chart at the relevant position.
- With the table/chart selected, choose the metrics that you need in your report. Make sure to explore the various categories in the “Metrics” dropdown menu to explore all the metrics available for your report.
- Next, we set the dimensions of the report. Choose the right dimensions to add to your report, under the categories in the “Dimensions” dropdown menu.
You can repeat the same steps to add the required tables/charts to the new report.
Method 2: Creating a Google Analytics 4 Dashboard using templates
To make the process even quicker, Two Minute Reports has a gallery of templates: preset dashboards combining relevant marketing data for specific use cases. These templates also shorten the time spent on the report editor, manually creating charts, tables, and graphs.
Two-Minute Reports Templates
TMR’s templates enable reports to combine the right metrics and dimensions and present them visually within minutes.
To create a Looker Studio dashboard using templates, follow Steps 1 and 2 from the previous method.
- Click on the green “Create Report” button to open the “Creating New Data Studio Report” window.
- From this window, choose the relevant previously created Query Config from the search bar, and click on the Next button.
- From the Create Report tab, you can explore TMR’s templates from the Template Gallery. Once you’ve selected the required template, double-click on it to open Looker Studio.
- Once Looker Studio opens up, choose the relevant team and check the box next to “Use report template for new reports”. Click on Next to continue.
- Then, select the relevant Query Config for the data source and click on the Connect button at the top-right corner. This step connects TMR to Looker Studio.
- The next window shows all the available Google Analytics 4 metrics, ready for the report. You can modify the metrics, or click on the Create Report button at the top-right corner.
- Next, authorize the data export activity and complete creating the report with preset tables and charts with your metrics.
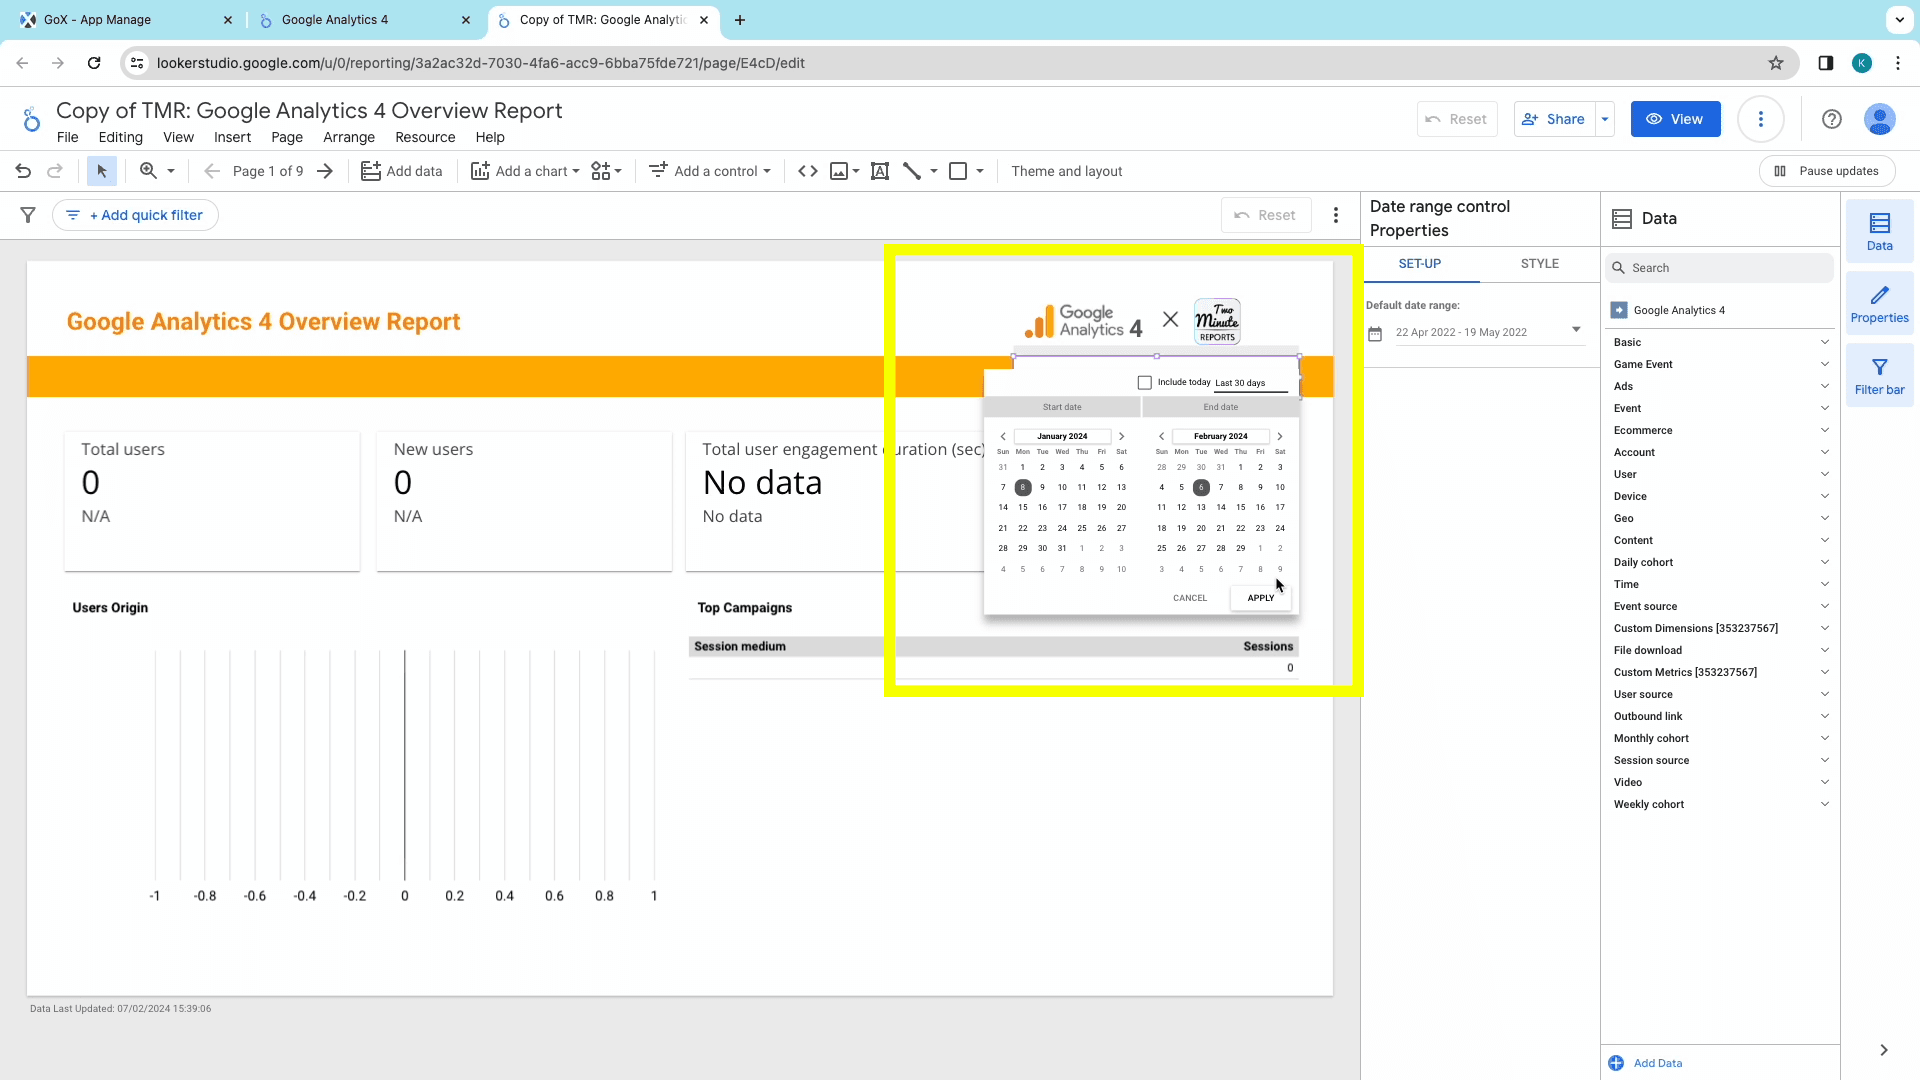
- Set a date range from the dashboard to display the relevant data.
And like that, you’ve created your GA4 report on Looker Studio. You can modify the tables/charts, metrics, and dimensions from the TMR Sidebar , and schedule reports to your email to keep getting that real-time data!
Start using these quick templates for looker studio now
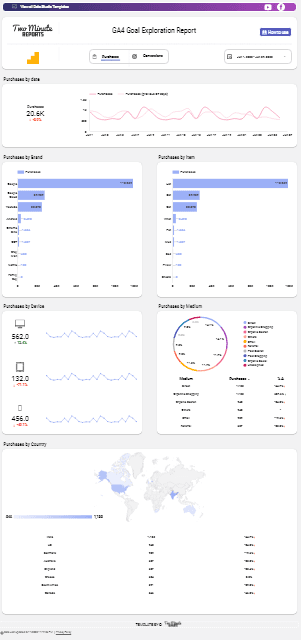
1. GA4 - Purchase, Conversions Exploration Template
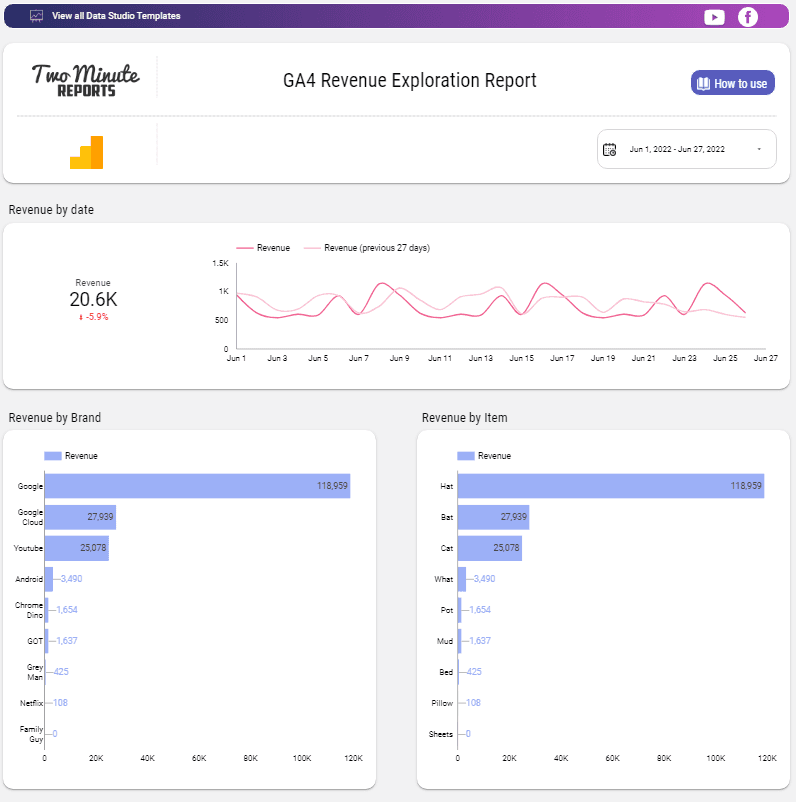
2. GA4 Revenue Exploration Report
Why connect GA4 to Looker Studio?
Google Looker Studio (formerly Google Data Studio) is a popular, open-source, tool for report creation and data analysis. The interactive dashboards and the easy-to-use interface enable business owners, analysts, and marketers to stay ahead of multiple data sources.
Ease of Use:
Looker Studio’s user-friendly interface requires minimal technical expertise. With just a few drags and drops, this coding-free tool helps make complex data manipulation and visualization simpler.
Data Connectivity:
With a connector like Two Minute Reports, one can integrate over 75 popular platforms, right from web analytics, to social media platforms. Creating a Looker Studio dashboard with TMR eliminates manual data imports and ensures that your data is up-to-date.
Visualization Variety:
With Looker Studio’s robust array of graphs, charts and other visual aides, you can effectively communicate and visualize data for all functions. You can create bar charts, line graphs, pie charts, maps, and much more to match your preferences.
Comprehensive Analysis
Insightful Metrics and Collaborative Accessibility are key benefits when using Looker Studio to manage your website/app’s performance. You can dissect and analyze data, compare them, and create custom metrics that align with your business goals.
Collaborative Access
Building a Looker Studio Dashboard also allows for seamless collaboration between functions in your organization. The ease of accessibility allows teams to work together with real-time data, fostering a highly collaborative environment.
Customization and Flexibility:
Importing GA4 data into Looker Studio allows you to customize your reports according to your specific needs. Looker Studio also enables proper representation of the metrics and dimensions that are most relevant to your business goals. Looker Studio also allows scheduling reports to be delivered to your email automatically. This ensures constant real-time data, and avoids frequent check-ins.
Workflow Efficiency
Setting up automated workflows to channel data from GA 4 to Looker Studio, effectively streamlines the data journey from source to analysis. This process ensures seamless synchronization enabling consistent workflow management.
Marketing Strategy Enhancement
When you export GA4 data into Looker Studio, you can conduct multi-channel analyses to simultaneously evaluate performance across multiple channels. This approach enables you to make data-driven decisions that enhance marketing performance.
Top KPIs of GA4 used in Looker Studio
Basic
GA4 can provide basic information about your application or website which helps you understand the users from your website. Add this information to your data report to optimize your website/app’s operations, improve engagement, and experience.
TMR’s add-on can fetch several important metrics like:
- Number of Sessions
- Total Users
- Views
- New Users
- Engaged Sessions
- Engagement Rate
- Active Users
- Total User Engagement Duration
- Average Session Duration
- 7-day active users
Performance
The data under this category can help you determine the performance to increase engagement and optimize your website/app:
Some important metrics available through our connector include:
- Popular Pages/Screens
- First-Time Visitors
- Engaged Sessions and Users
- Engagement Rate
- Active Users
- User Engagement Duration
Event
The data under this category helps you analyze the most popular events on your website/app, and their frequency. These insights can help improve events and improve revenue with increased ARPU(Average revenue per user).
- Conversion rates
- Event Counts
- Revenue
- Transactions
This category also helps you learn about your users’ behavior with metrics such as:
- Events per Session
- Events Count per User
Time
Analyzing the date of the event with Google Analytics 4 helps you identify patterns in user behavior, compare data points across months, and identify trends to optimize operational strategy.
Some metrics that are covered in our connector include the Month, Year, or even the Week number of the Event, in both Saturday-to-Monday or Monday-to-Sunday formats. TMR also allows you to use the Year-Month format to create concise and reader-friendly reports.
Session Source
Identify where your site visitors originate from the Session Source metrics to optimize your marketing campaigns, analyze user behavior, and track your site’s growth.
Some important metrics available through our connector include:
- Source
- Medium
- Channel Grouping
- Campaign Name
- Keyword(s)
- Group Name
Content
This data can be a prominent indicator of your website/app’s performance. Optimizing content can help improve content operations, and make data-driven decisions.
Some actionable metrics available through our connector include:
- Page Path, Title, and Location from Frequent User Visits
- Landing page from Frequent User Visits
- Page Path, Query String, and Screen Class to understand User Interaction
Geo
Discover where your audience is from with Google Analytics 4’s Geo Metrics. This information can help target marketing efforts and improve User Experience for the corresponding locations. This data can also help you identify potential regions to target first.
Some popular metrics in our add on include:
- Country
- City
- Region
Property
These specific data are focussed on user behavior across different platforms. These insights will help you improve User Experience, and monitor which versions of your website/app perform the best.
Some important metrics include:
- Source of Traffic
- Host Name
- Stream Name
- Stream ID
Device
These Google Analytics metrics can help you track the devices your users use to visit your website/app. Use these insights to improve design, optimize User Experience, and optimize language code for content targeting. Some effective metrics include:
- Type of Device
- Operating System
- Language Setting
- Screen Resolution
- Browser
- Device Model and Manufacturer
E-commerce Metrics
The Website/App is the largest asset in the e-commerce biz. Identifying the top-selling products, the effectiveness of functions, product categories, and the checkout process are crucial to improving experience and increasing conversions. If you’re in the e-commerce biz, add these data to your report.
- Purchases
- Item Revenue
- Item Name
- Item Brand
- Item Category 3
- Add to carts
Get Google Analytics 4 data in Google Sheets too!

Two Minute Reports is also available as a Google Sheets add-on. This add-on is designed to simplify complex data analysis and visualisation, making the best use of Google Sheets’ tools and features.
This add-on allows the creation of detailed reports and dashboards using insights from GA4 without the complexity of manual data entry. TMR for Google Sheets also enables users to develop custom formulae in a user-friendly interface.
With seamless GA4 to Google Sheets integration, comprehensive analytical capabilities, and automated workflows, strategic business intelligence has just become quicker and more accessible.
Connect other Platform Data Sources with Google Sheets
Google Analytics
Website analytics platform from Google for data-driven insights.
FAQs
What are data sources?
The Data source of a report is where you grab data for analysis, comparison, and decision-making. Determining and adding a data source is the first step for report creation.
What are Dimensions in GA4?
Dimensions are additional attributes of your website which provide information about it. For example, the “Date” dimension tells the date a visitor visited your website.
How do I connect Google Analytics 4 to Looker studio?
You can use Looker Studio’s native features, or connectors like Two Minute Reports to create reports, visualise data, and compare data from other platforms. Here’s how you do it: Connect GA4 to Looker Studio.
What data to pull from Google Analytics 4?
The best data to pull from Google Analytics 4 varies from your business needs and types. Ensure that your data informs you about your user’s behaviours, your website/app’s performance and User Experience.
What are “Teams” in Two Minute Reports?
To ensure the management of workflows, reports, and collaborative projects within an organisation, Two Minute Reports has the “Teams” Feature. This feature allows your organisation to create separate groups within the product to enable collaboration.
What is Two Minute Reports?
It is a Google Analytics connector for Looker Studio, which helps you integrate data from GA and GA4 to Looker studio, create reports, and analyse data effectively and seamlessly.
Why use TMR when Looker Studio supports direct GA4 export?
Apart from easy access to data and metrics, Looker Studio connectors like Two Minute Reports also helps combine data from other platforms, create visualizations, blend data and audience segments, and gain valuable insights for your business.
How to create custom Looker Studio Reports?
Make use of Looker Studio’s robust tools and features to create custom reports. You can also use connectors like Two Minute Reports to utilise their function-based templates.