Connect TikTok Ads to Looker Studio : Free Templates (2024)

TikTok has become a staple of the marketing world, making it essential for advertisement in social media. When investing time and money into these ads, it is important to assess their performance and this is an overwhelming task.
Looker Studio provides users with the data they need to evaluate performance, such as clicks, click-through rates, locations, and top-performing ads. Unfortunately, TikTok is not a native connector to Looker Studio. Two Minute Reports solves this problem for you. TMR connects with other data sources so you can easily reduce your time creating manual reports.
By simply selecting the metric data of interest, the user can have the raw data they need in their sheet within a minute. Here’s a guide on how to do that.
Connect to a TikTok Data source
The first thing to do is to go through our portal and select the data source you want to add.

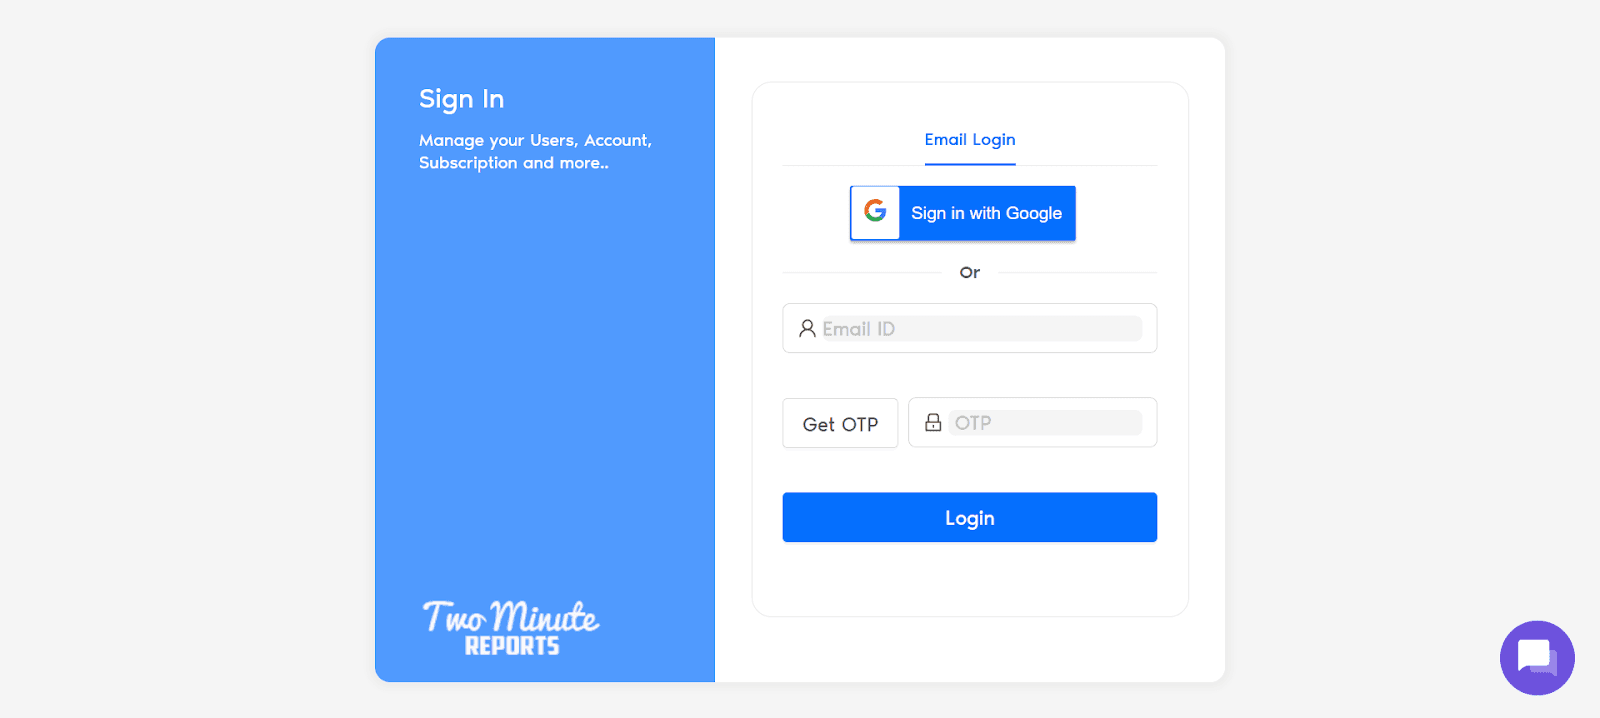
Go to apps.gox.ai and Login to your account.
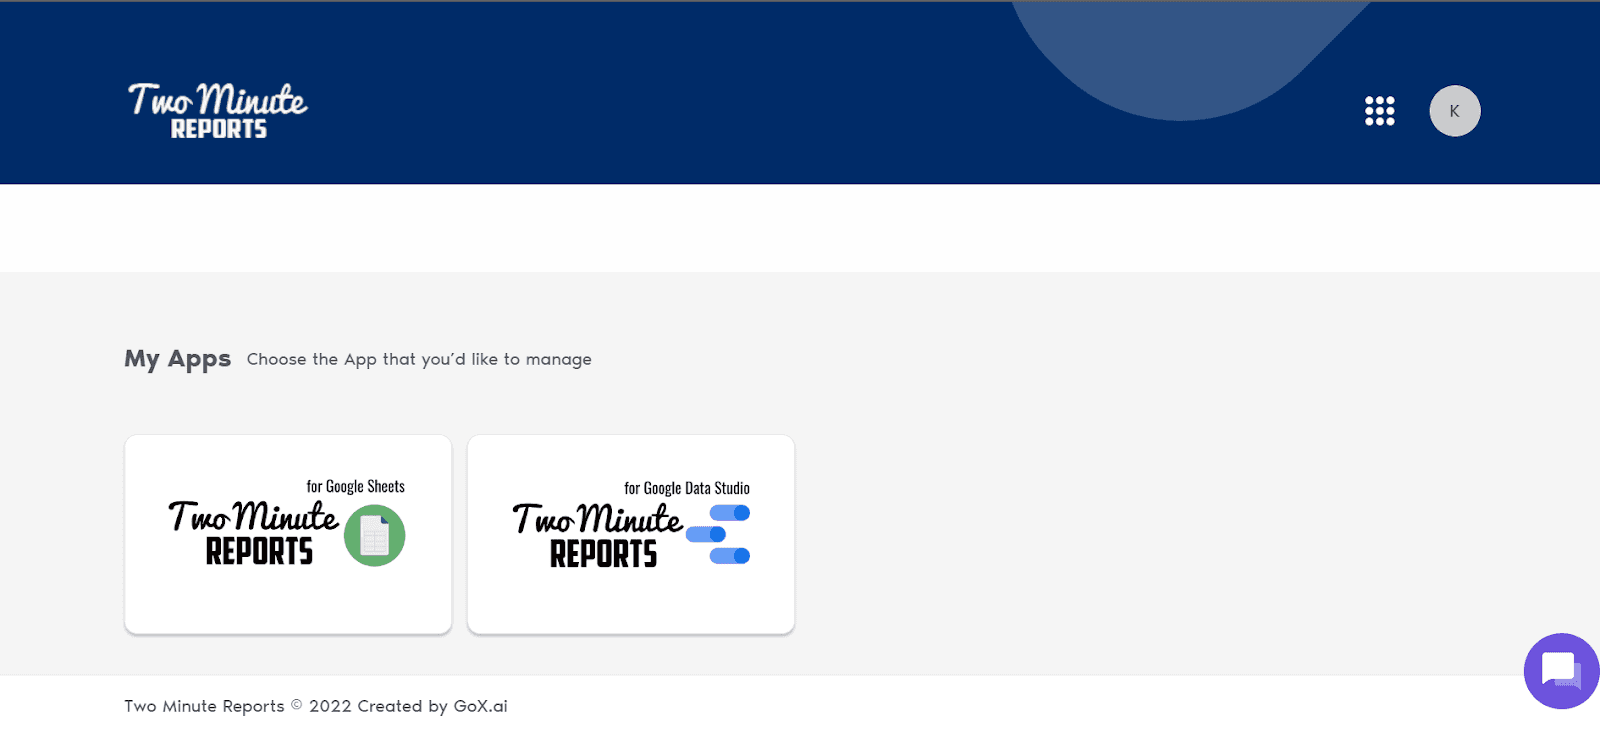
Choose Two Minute Reports for Looker Studio (the blue one).
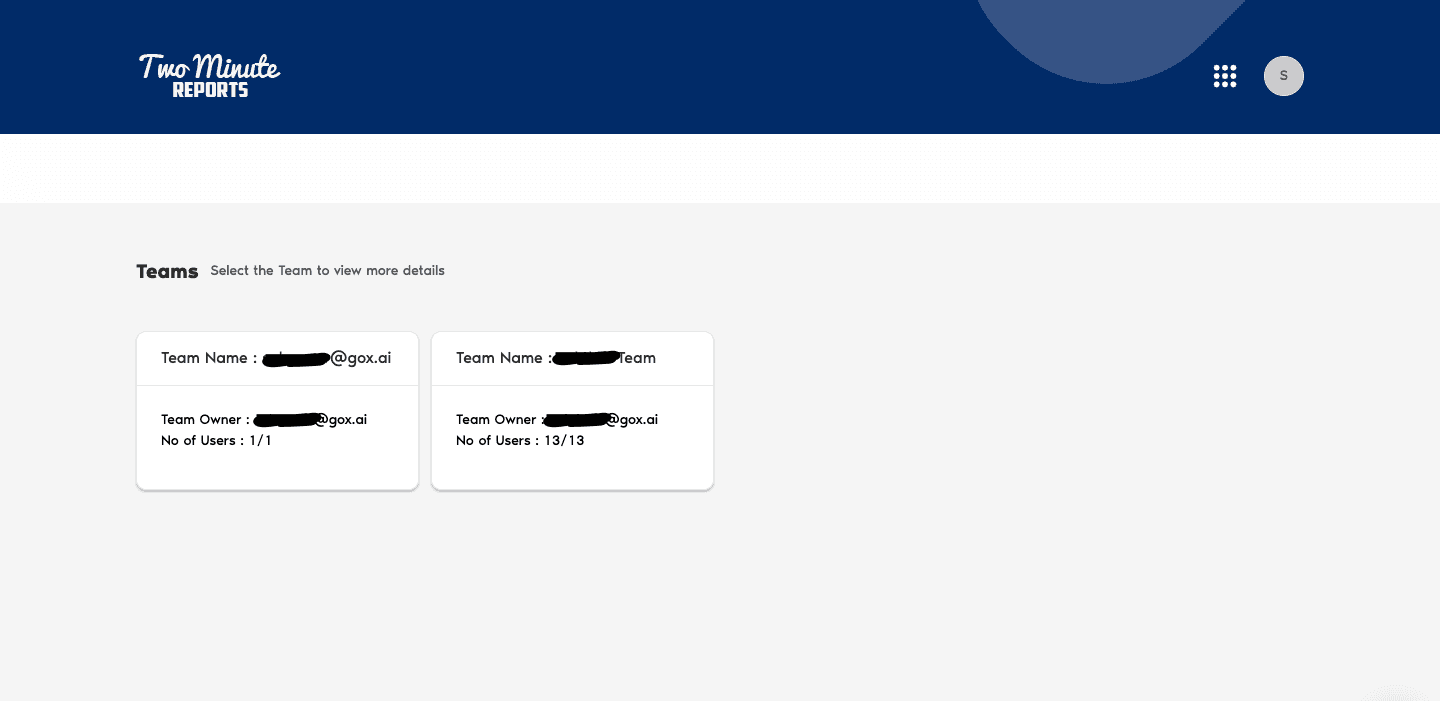
- Select your team. If you only have one team, you skip this and TMR automatically redirects you to the connectors page.
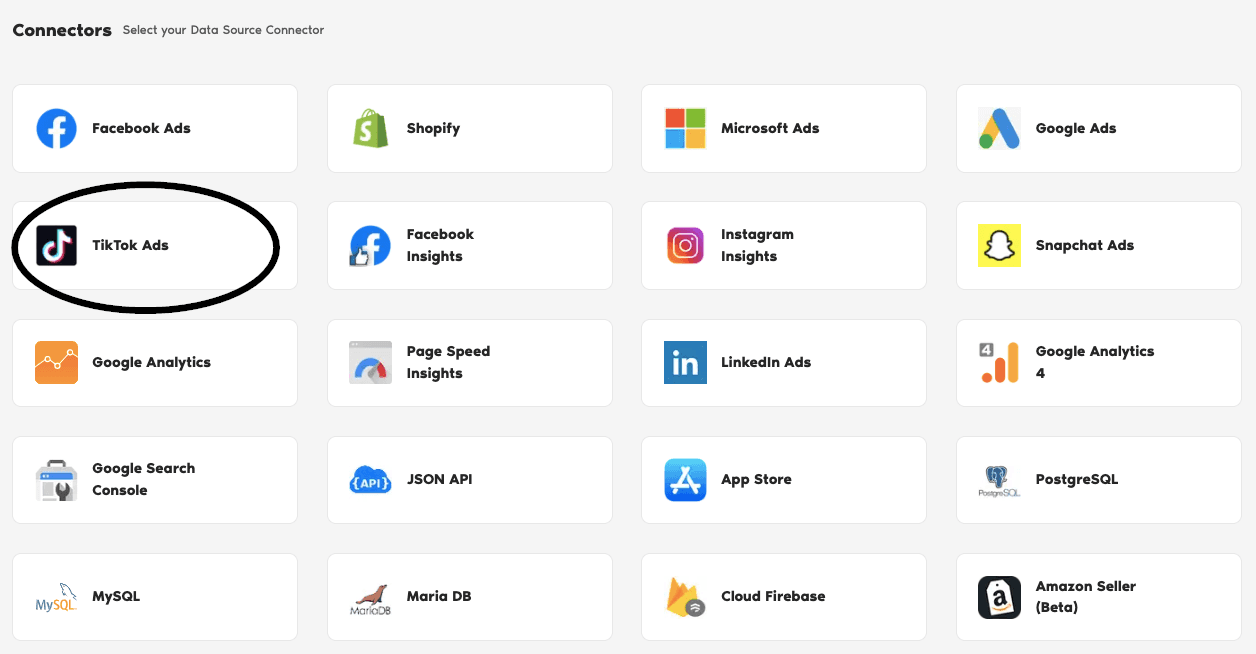
You will now see the connectors page.
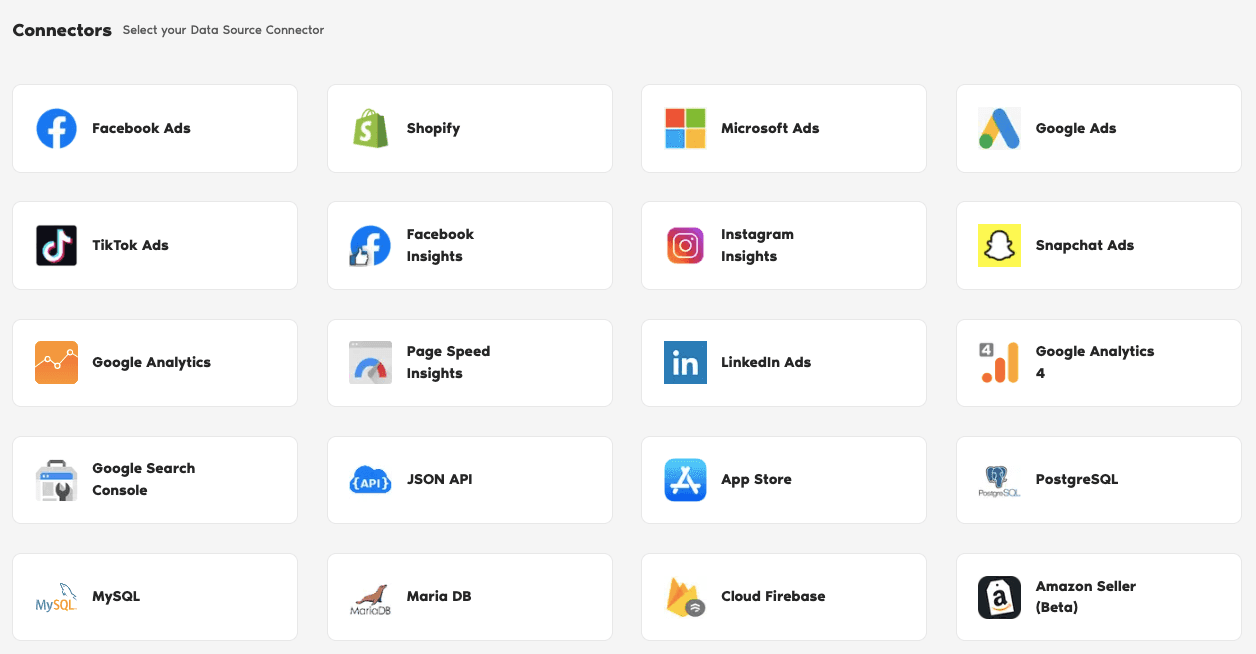
In the connectors page, find and select TikTok Ads.
Login to Your TikTok Account
In this section, you need to login to your TikTok account for authentication making sure it connects with TMR and Looker Studio.
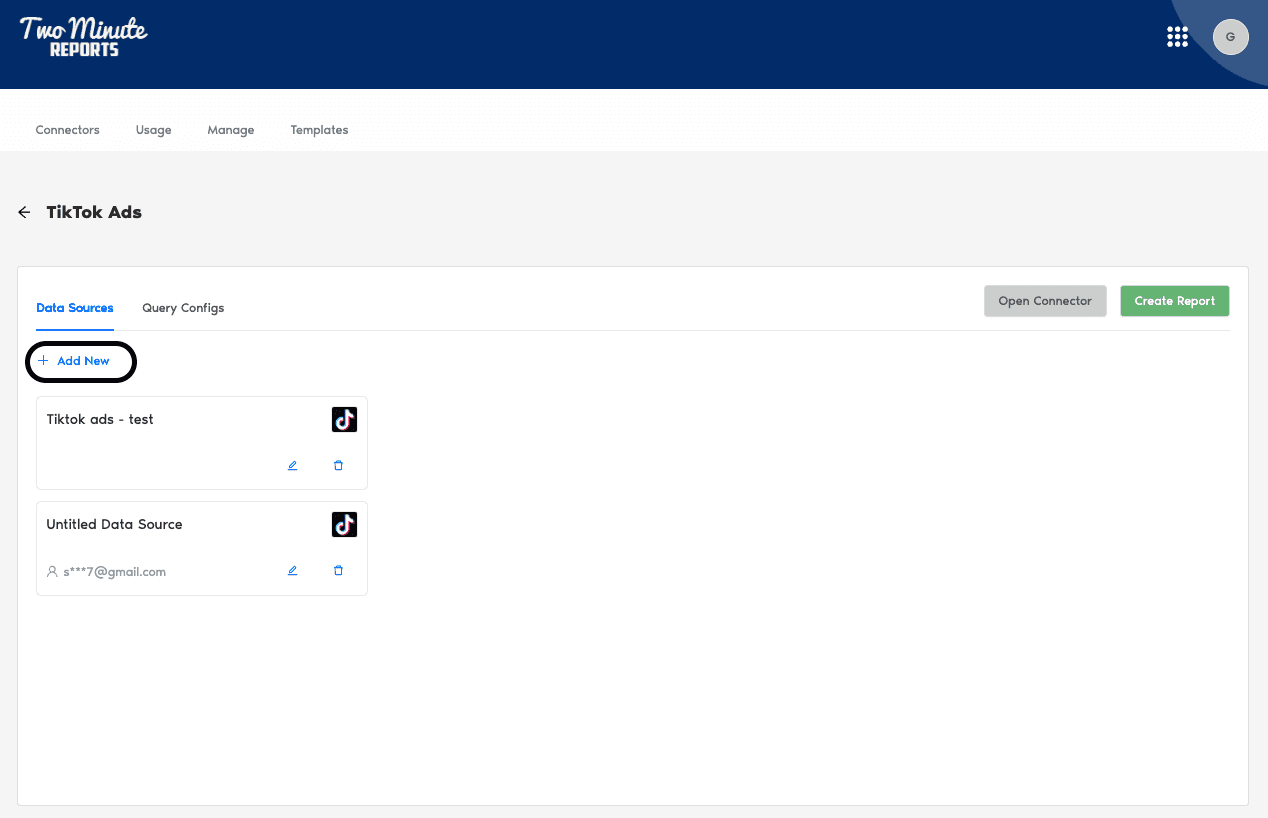
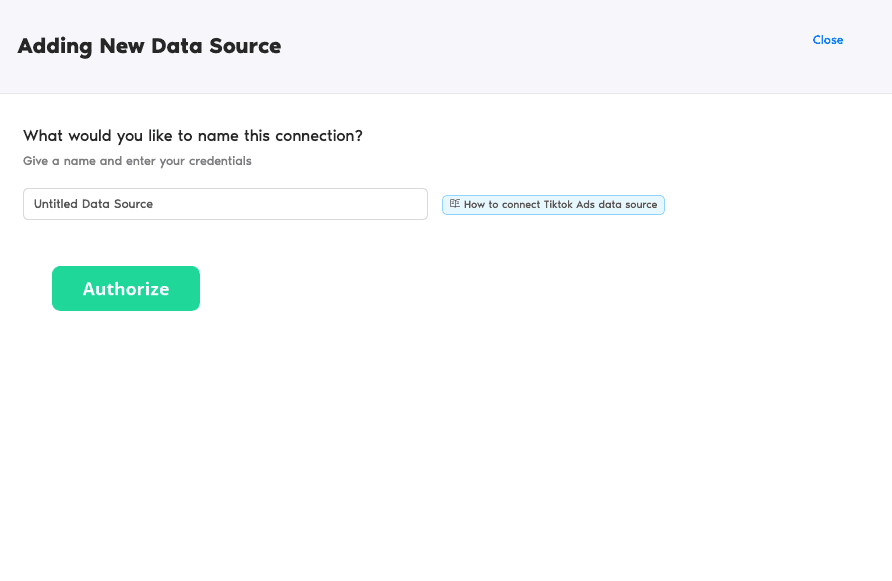
Under Data Sources, click +Add New button. Name your data source and click the green Authorize button.
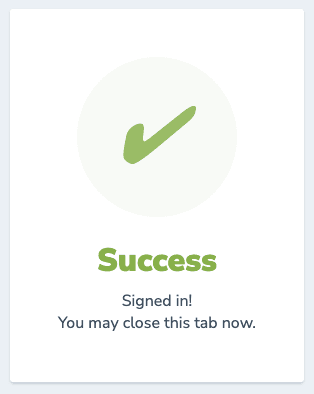
- Go through the entire authentication in TikTok. If successful, Two Minute Reports gives a prompt “Signed in! You may close this tab now.“
Configuring Your TikTok Account with TMR
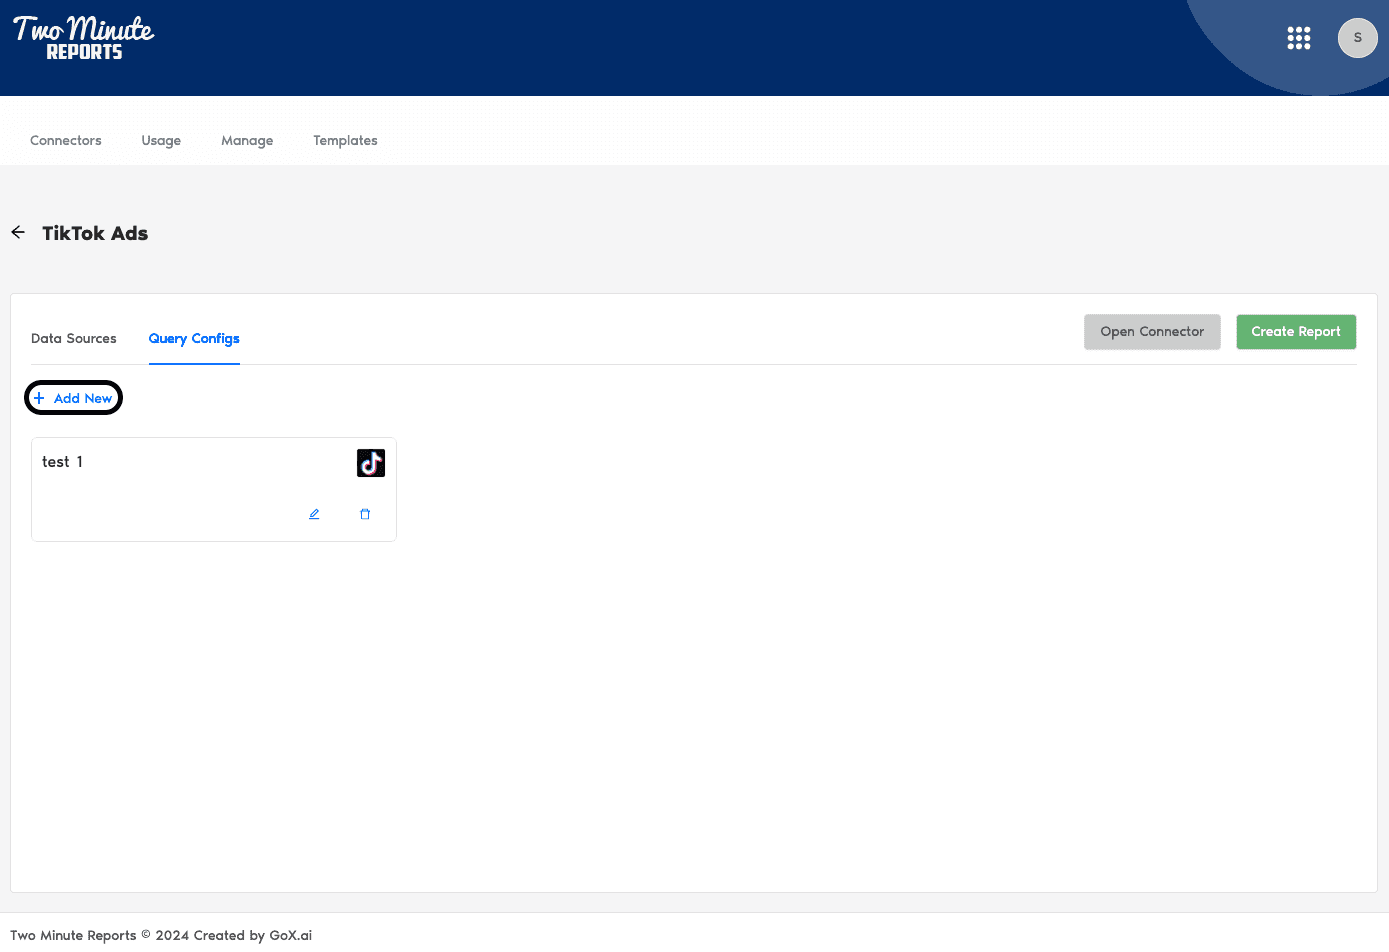
- In the Query Configs section, click + Add New button. Choose the data source you added earlier. Click Next.
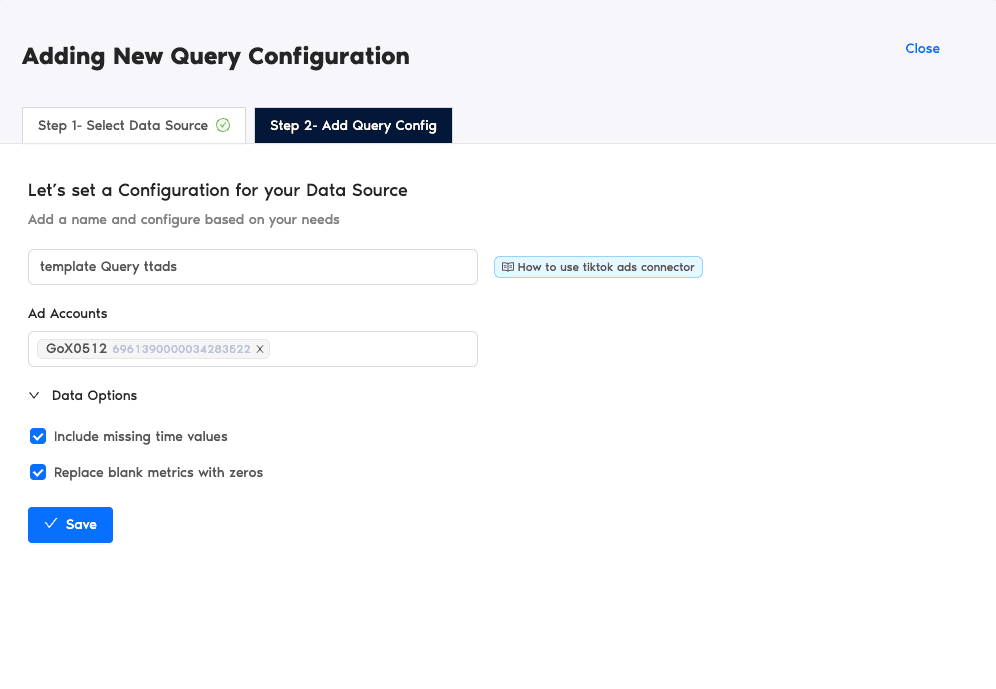
The next following steps is where you configure your TikTok settings to TMR so that you can create reports in Looker Studio. You may configure the following parameters depending on your preference as TMR has imported them.
- Name your query config.
- Select your TikTok Ad account.
- Data Options whether you want to Include missing time values or Replace blank metrics with zeros. This means empty metrics are still being reported as zero values.
- Click Save.
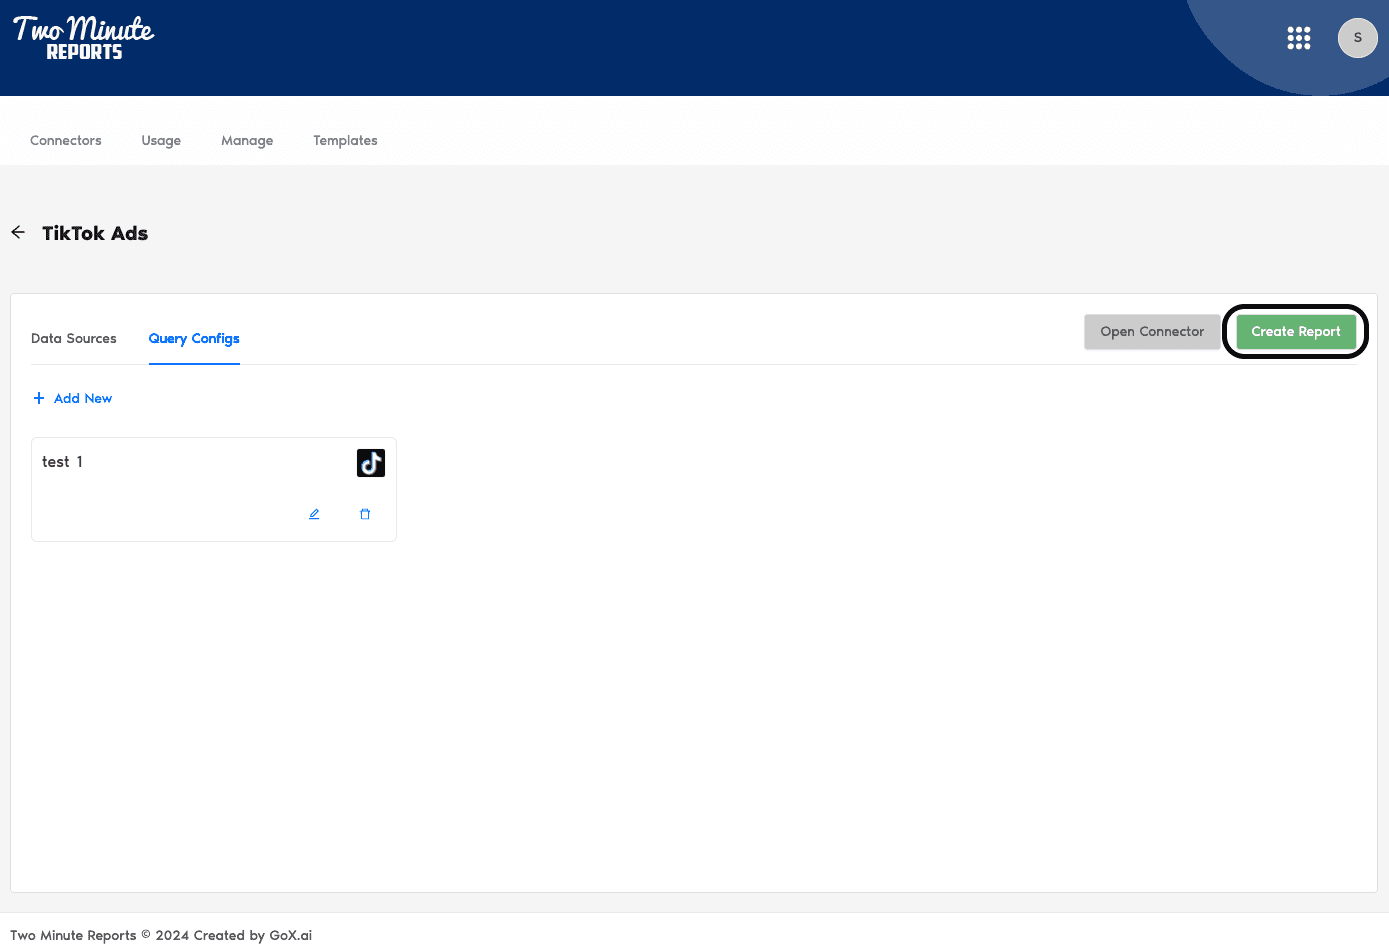
Once everything is finished, click Create Report . The next section is creating reports in Looker Studio.
Create a TikTok Ads Report from scratch or using Template
There are two options to create a TikTok Ads report with TMR in Looker Studio. You can choose to select our templates or create your own custom reports.
Option 1: Use Two Minute Reports Template Option 2: Create Report from Scratch
Option 1: Use Two Minute Reports Template
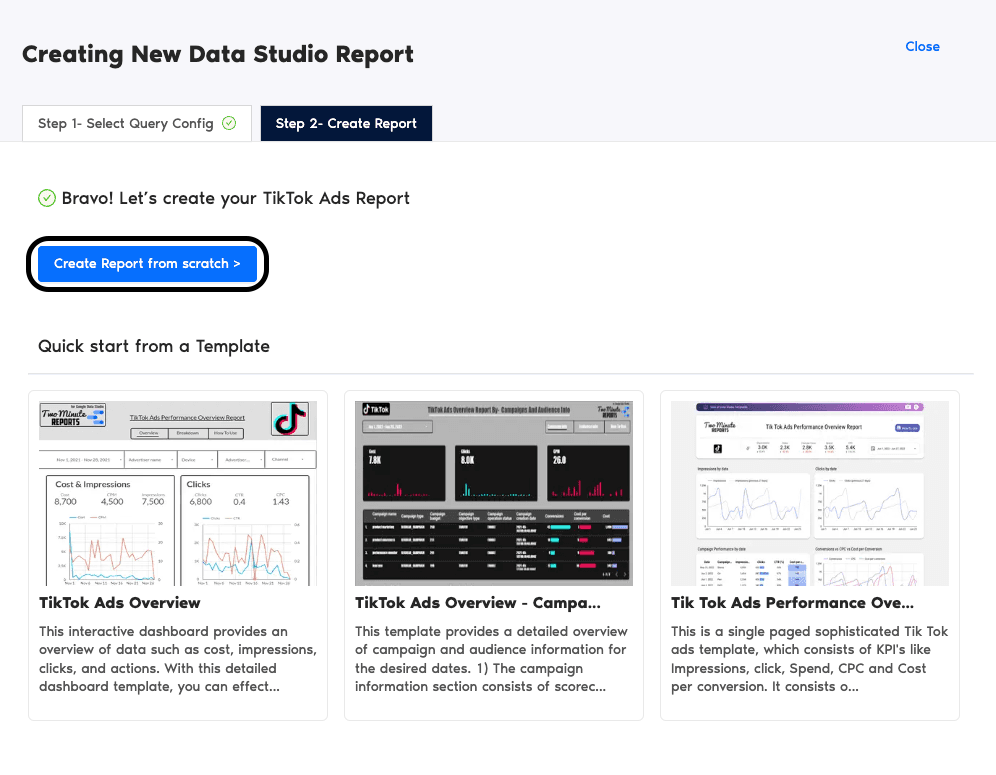
If you prefer to use a template, Two Minute Reports has many template dashboards to choose from.
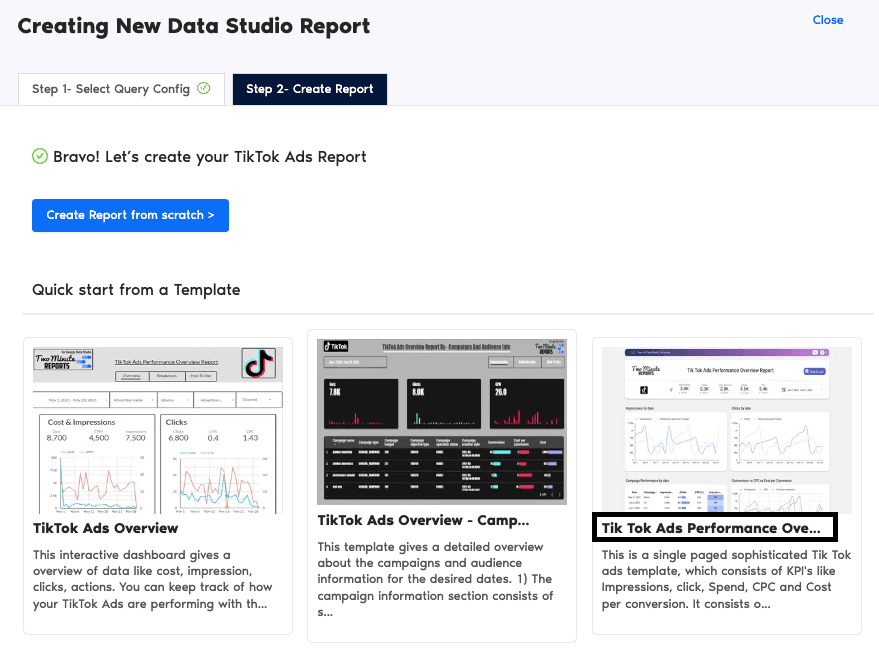
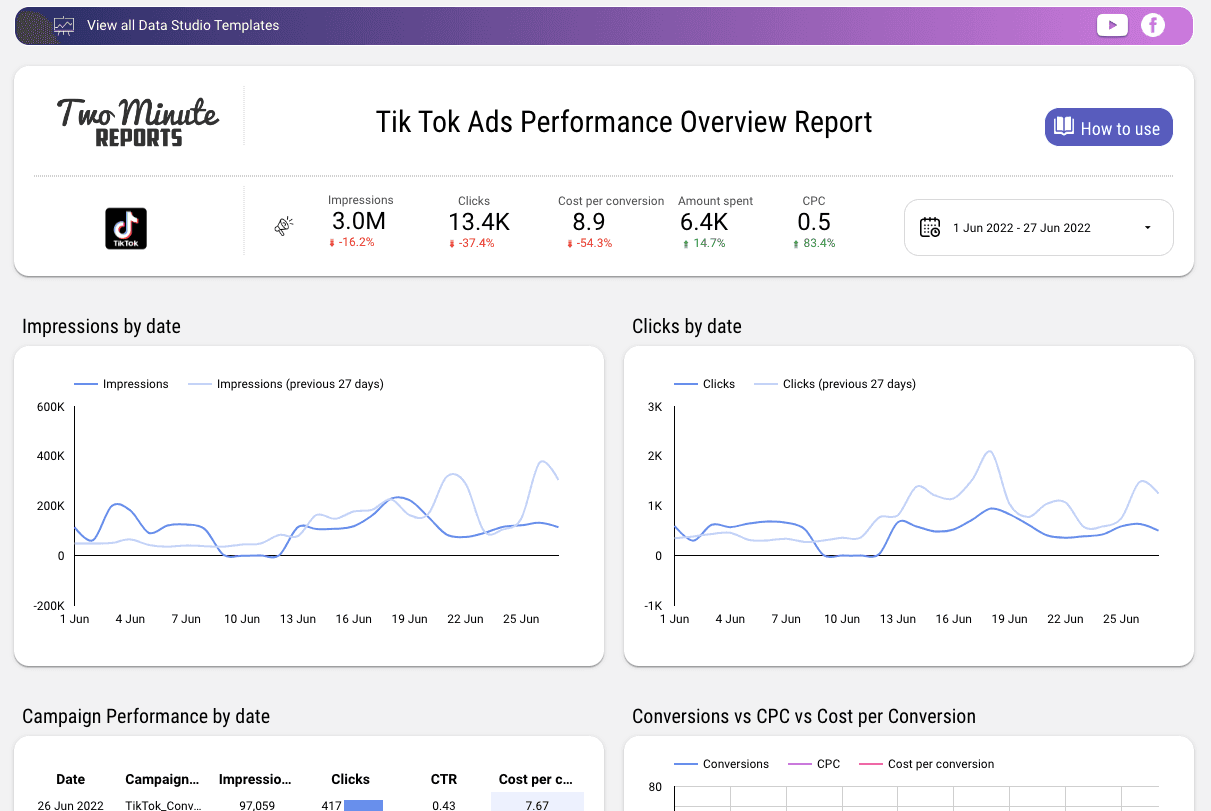
- After clicking Create Report from the previous section, select any of our templates. In this example, click TikTok Ads Performance Overview.
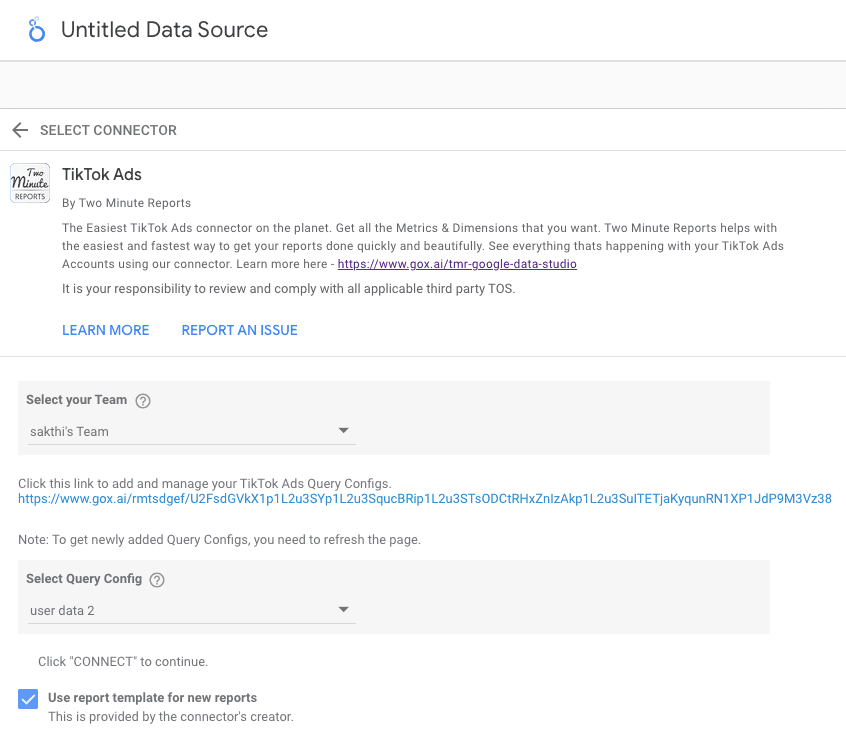
- You are redirected to Looker Studio. In Looker Studio, under Select Query Config, choose the configuration you created earlier (it should be the name you gave it). Under Select your Team, choose the appropriate team as well if the dropdown is shown to you.
- Click the Connect blue button in the upper right side of the page.

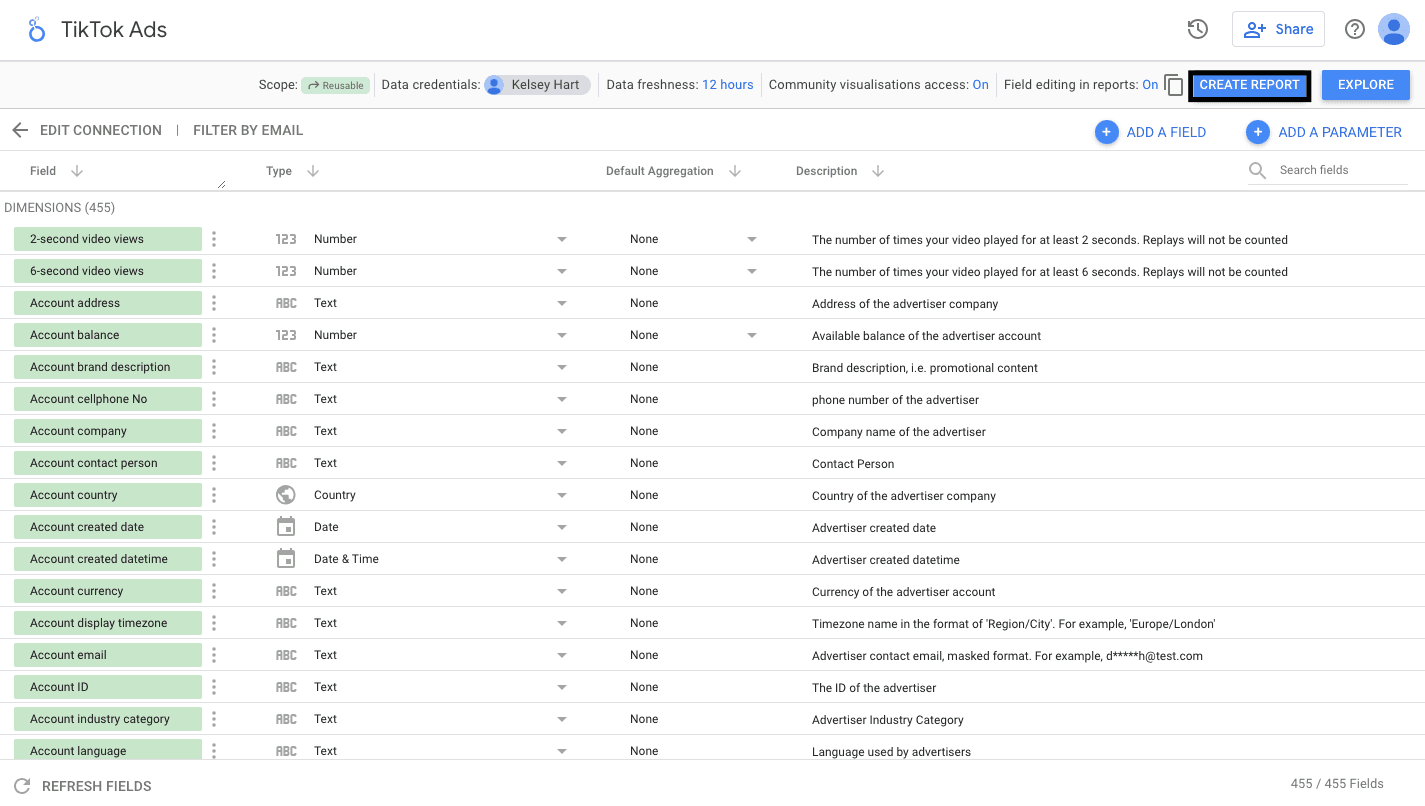
- You can now view the TikTok Ads schema on Looker Studio. Click Create Report in the right side of the page.
Once everything is loaded, you are presented with a custom template report from Two Minute Reports. You can use your TikTok Ads data to this report and edit as you see fit.
If you want to learn on how to use your own data to our templates, read How to use templates for Looker Studio
Option 2: Create a Report from Scratch
You can also create your own custom dashboard in Looker Studio. Looker Studio is a powerful data visualization tool that contains many features to help you reduce time creating reports.
- After clicking Create Report from the previous section, click Create Report from scratch, blue button.
- You are redirected to Looker Studio. In Looker Studio, under Select Query Config, choose the configuration you created earlier (it should be the name you gave it). Under Select your Team, choose the appropriate team as well if the dropdown is shown to you.
- Click the Connect blue button in the upper right side of the page.
- You can now view the TikTok Ads schema on Looker Studio. Click Create Report in the right side of the page.

Once everything is loaded, you are presented with a blank canvas. You can now create custom reports (adding dates and charts) in Looker Studio with your TikTok Ads data.
Start using these quick templates for looker studio now
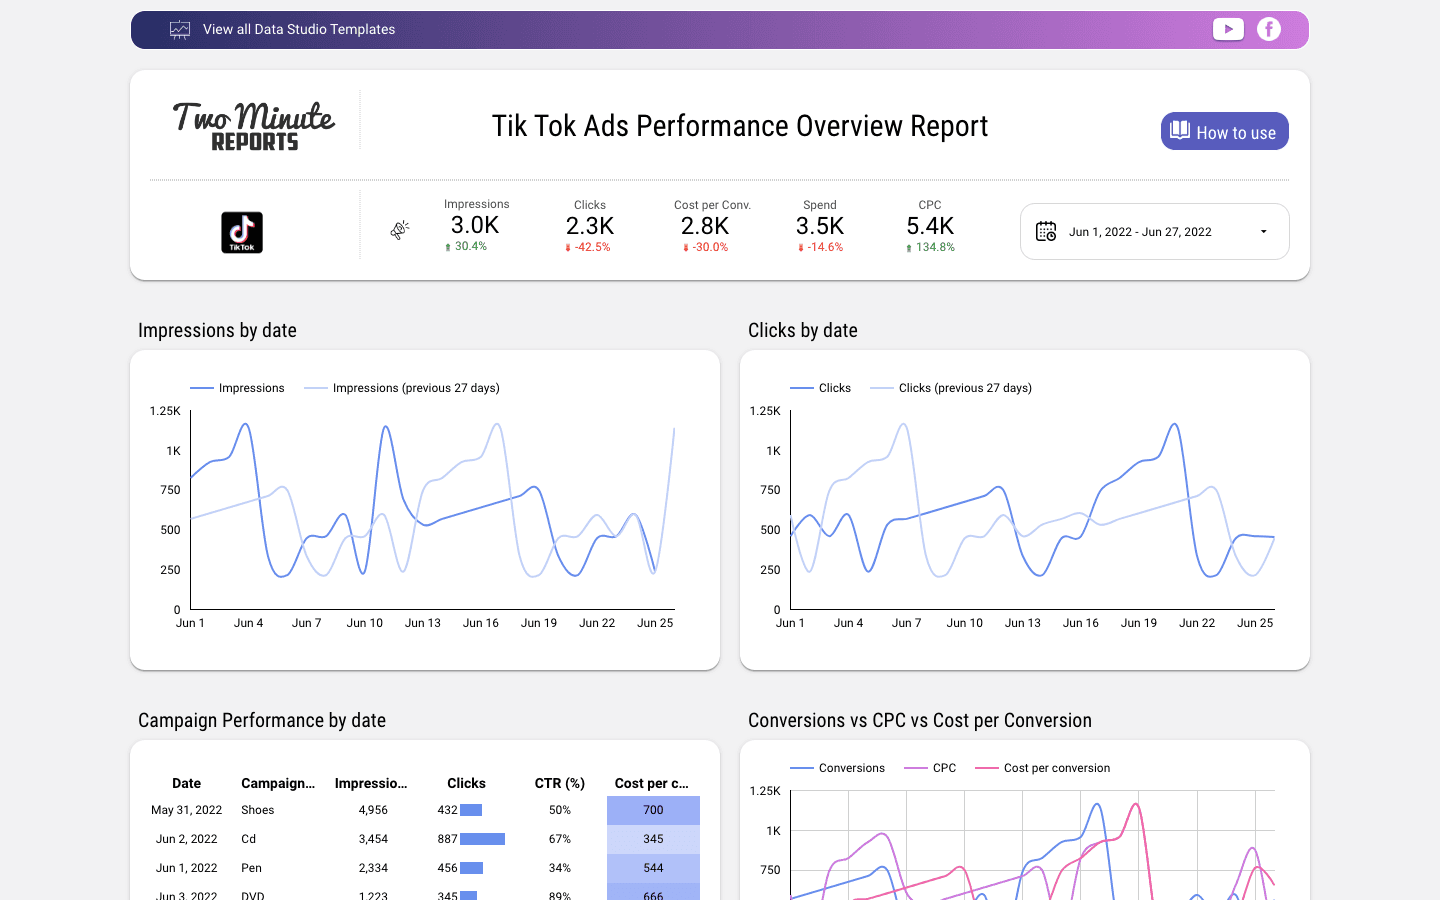
1. Tik Tok Ads Performance Overview Report
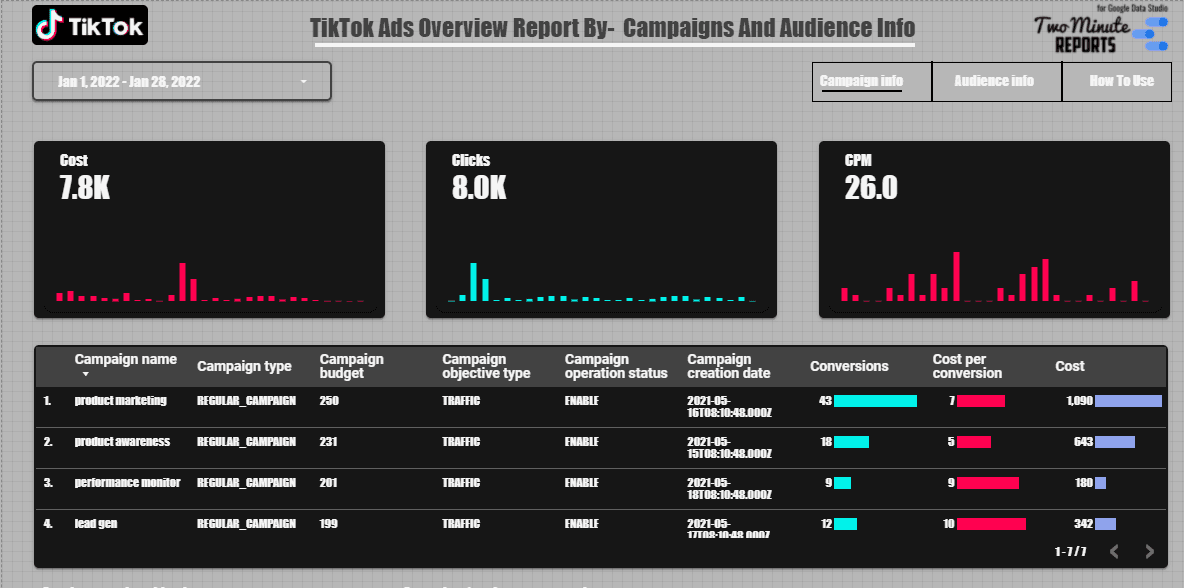
2. TikTok Ads Overview - Campaign and audience info
Why connect TikTok ads with Looker Studio
Managing TikTok ads is a summon task, especially when you manage a number of Ad accounts for TikTok. Let's see, how TMR here helps it out.
Multiple Account usage
You may use multiple Ad accounts for different clients and campaigns, however using TMR Looker Studio for TikTok you can monitor all of these Ads of different Ad accounts under a single Report.
Data Visualization
Using Looker Studio with the help of Two Minute Reports, you can generate visually creative Reports and use all the high level charts available in the Looker Studio platform. It is also possible to add, 3rd party visualization tools.
Pre-defined Templates
Two Minute Reports for Looker Studio offers 75+ pre defined Looker Studio Templates offered for free. These Templates can help you get your TikTok Ads Report under 2 minutes. You have a variety of Reports to infer from, pick any based on your use case and start working with it.
Top used KPIs of TikTok Ads in Looker Studio
Now that you have created your data source and a Report from scratch, it is time to add the data fields needed for you to monitor your Tik Tok Ads in Looker Studio. Below are a list of the most commonly used fields in TikTok ads.
Ad
TikTok Ads provides a variety of fields to monitor, analyse and rectify all of your data Analytics present under TikTok Ads.
| Title | Description |
| Ad text | Text of the ad |
| Ad name | Name of the ad |
| Ad open url | The specific location where you want your audience to go if they have your app installed |
| Ad identity type | Identity type. Enum: CUSTOMIZED_USER, AUTH_CODE, TT_USER |
| Ad display name | The display name of the landing page or pure exposure ad |
Account
Two Minute Reports provides access to multiple Ad accounts and Ad insights at a singe page, so check out the most commonly used Ad related fields for TikTok.
| Title | Description |
| Account address | Address of the advertiser company |
| Account balance | Available balance of the advertiser account |
| Account company | Company name of the advertiser |
| Account status | Status of the advertiser |
| Account role | Role of the advertiser |
Conversion
Conversions are the fields that denote when you gain a lead from a source to your channel. TikTok ads provide numerous fields that can capture these conversions and measure them.
| Title | Description |
| Conversions | The number of times your ad achieved an outcome, based on the secondary goal you selected. One campaign may have a number of different secondary goals. Calculated based on the time each ad impression occurred |
| Cost per conversion | The average amount of money you have spent on a conversion (CPA). Calculated based on the time each ad impression occurred |
| Real time conversions | The number of times your ad achieved an outcome, based on the objective and settings you selected. Count is based on when the conversion actually happened |
| Cost per real time conversion | The average amount of money you have spent on a real-time conversion (Real-time CPA). Calculated based on when the conversion actually happened |
| Conversion Rate | The percentage of results you received out of all the clicks of your ads. Calculated based on the time each ad impression occurred |
Performance
Performance metrics are the vital indicators of how your Ad has been performing, performed and is going to perform. Using these KPIs you can make ROI decisions for better Ad performance.
| Title | Description |
| Amount Spent | The estimated total amount of money you've spent on your campaign, ad group or ad during its schedule |
| Clicks | The number of clicks on your ads |
| CPC | The average amount of money you have spent on a click |
| CPM | The average amount of money you have spent per 1,000 impressions |
| CTR | The percentage of times people saw your ad and performed a click |
Engagement
| Title | Description |
| Anchor clicks | The number of clicks on all anchors. |
| Anchor click rate | The percentage of times viewers performed a click after seeing an anchor |
| Duet clicks | The number of clicks on the "Duet" button. |
| Total engagements | The overall amount of engagement on your ad which includes likes, comments, shares, follows and clicks. Clicks consist of music, hashtags, anchor, and interactive add-on activity clicks. |
| Engagement rate | The engagement rate is the number of engagements that your ad receives divided by the number of times your ad is shown. |
Get TikTok Ads data in Google Sheets too!

Two Minute Reports also provide TikTok Ads data in a more robust platform, which is Google Sheets! Using Google Sheets for TikTok Ads you can use almost all the features applicable in Looker Studio and also work in-depth technically with your data. Google Sheets is ideally suitable for people who work more with numbers than charts. However you also have 50+ pre-defined Templates created by Google Sheets for free.
Connect other Platform Data Sources with Google Sheets
Facebook Ads
Social media ad platform for targeted audience reach.
Google Ads
Advertising platform for displaying ads on Google's search results pages.
Linkedin Ads
Professional social media platform's advertising data source.
Snapchat Ads
Social media advertising platform for Snapchat users.
FAQs
How do I connect TikTok ads to Looker Studio?
You can connect Tiktok ads to Looker Studio by 2 methods:
- Choose -> Create a data source and add TikTok ads for Two Minute Reports, -> authorize with TMR and then start creating your TikTok Ads Report
- Go to Two Minute Reports for Looker Studio -> Choose Templates -> Select a TikTok ads Template -> authorize with TMR and start working on it.
How to track TikTok ads?
You can track TikTok ads by
- Native TikTok ads dashboard to check all your Analytics
- Looker Studio for TikTok ads provided by Two Minute Reports can get your insights in the form of charts and pre-defined Templates.
Commonly used TikTok ads fields/metrics
The most Commonly used fields/metrics are Amount Spent, Clicks, CPM, CTR, Conversions, Cost per Conversion, Account status, and much more…