How to import data from Google Analytics 4 to Google Sheets (2024)

- How to get your Google Analytics 4 data to your Google Sheets
- Start using these quick templates for google sheets Now
- Why import Google Analytics 4 Data in Google Sheets?
- Top KPIs to export in GA4 Google Sheets Reports
- Get Google Analytics data in Looker Studio
- Connect other Platform Data Sources with Google Sheets
How to get your Google Analytics 4 data to your Google Sheets
With Two Minute Reports, a Google Sheets add on, you can create comprehensive Google Analytics Reports. Here is a step-by-step guide to getting Google Analytics 4 Data to your Google Sheets.
To be able to export data on to your google spreadsheet, you need to install Two Minute Reports add on.
Once installed, you can use this Google Analytics add on to create your Google Analytics 4 report in two methods:
Method 1: Connect Google Analytics 4 to Google Sheets using Sidebar.
Method 2: Connect Google Analytics 4 to Google Sheets using in-built Templates of Two Minute Reports.
Method 1: Connect Google Analytics 4 to Google Sheets using Sidebar.
Step 1: Adding the Data Source
 Find Two Minute Reports from the extensions menu to open the Two Minute Reports sidebar. The sidebar starts at the Data Queries section by default.
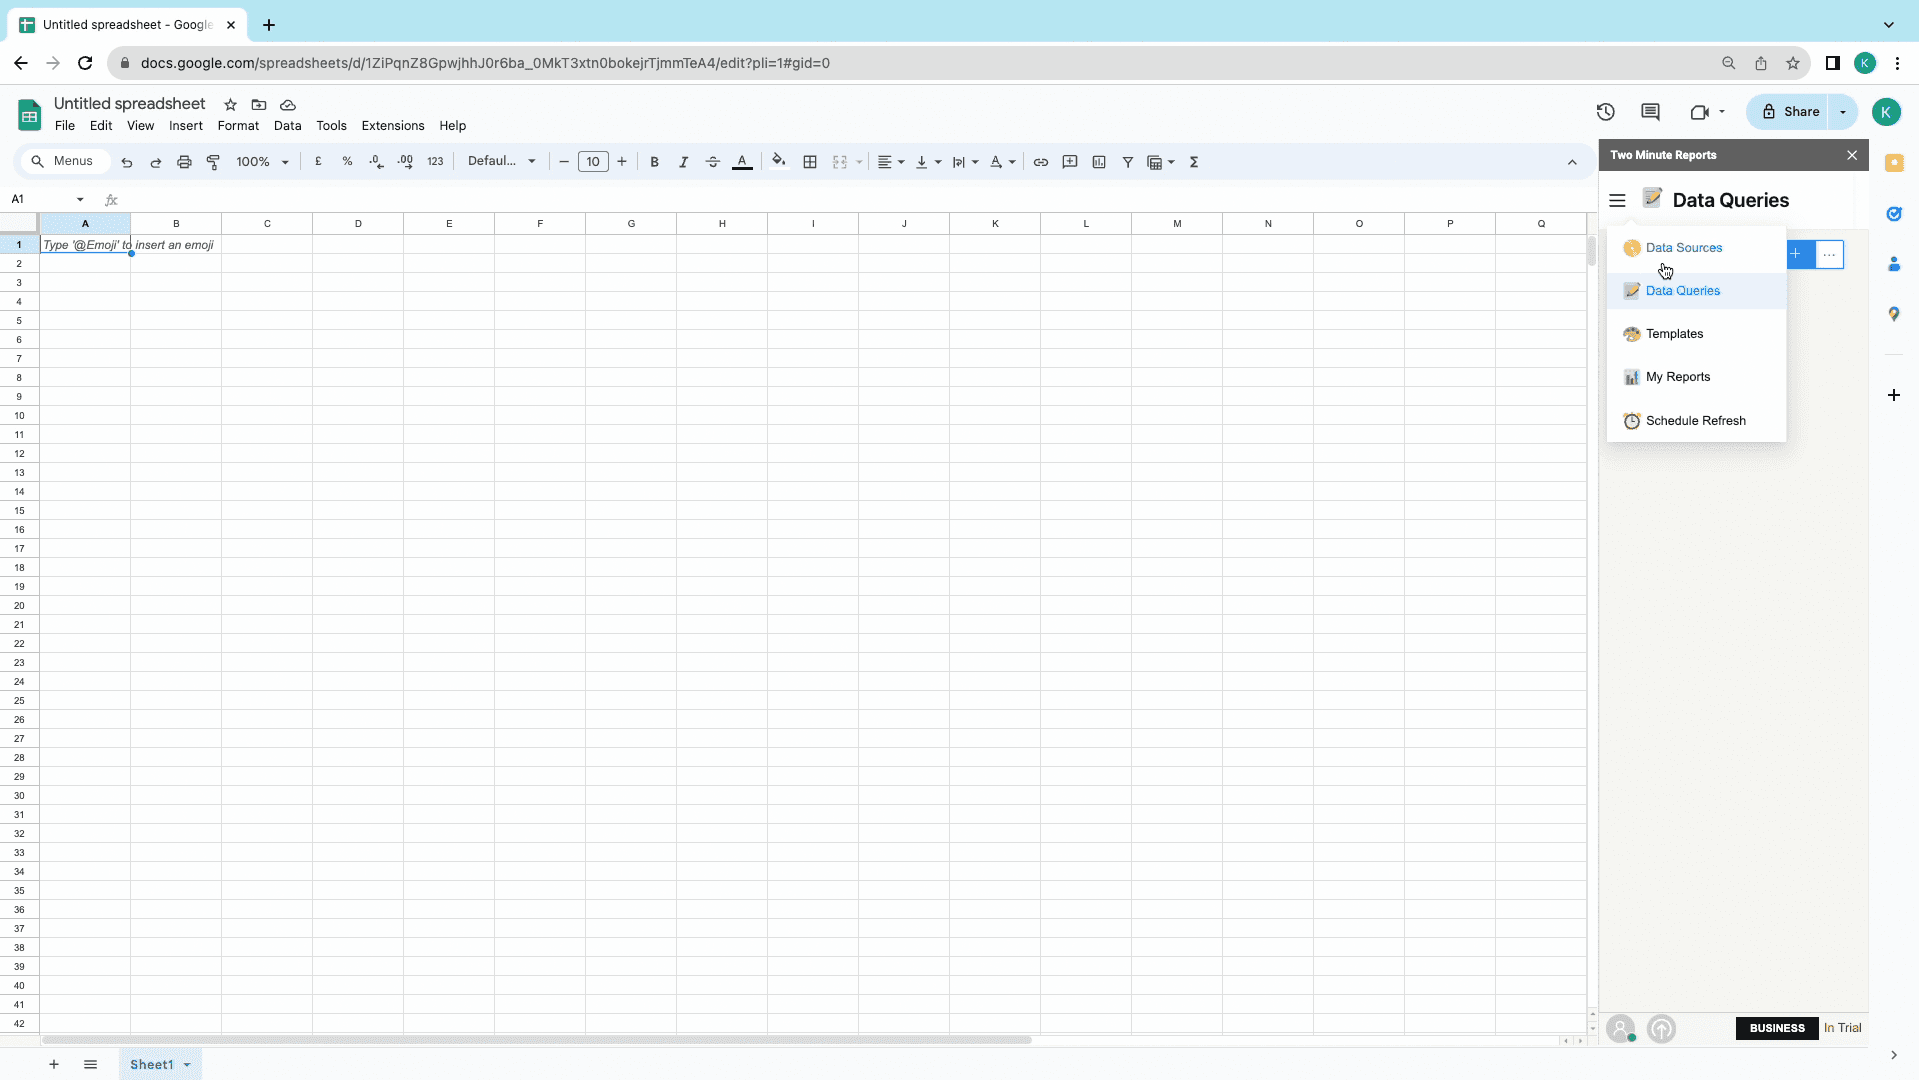
- Start by setting up the Data Source: Click on the Menu near the Data Queries section and choose Data Sources.
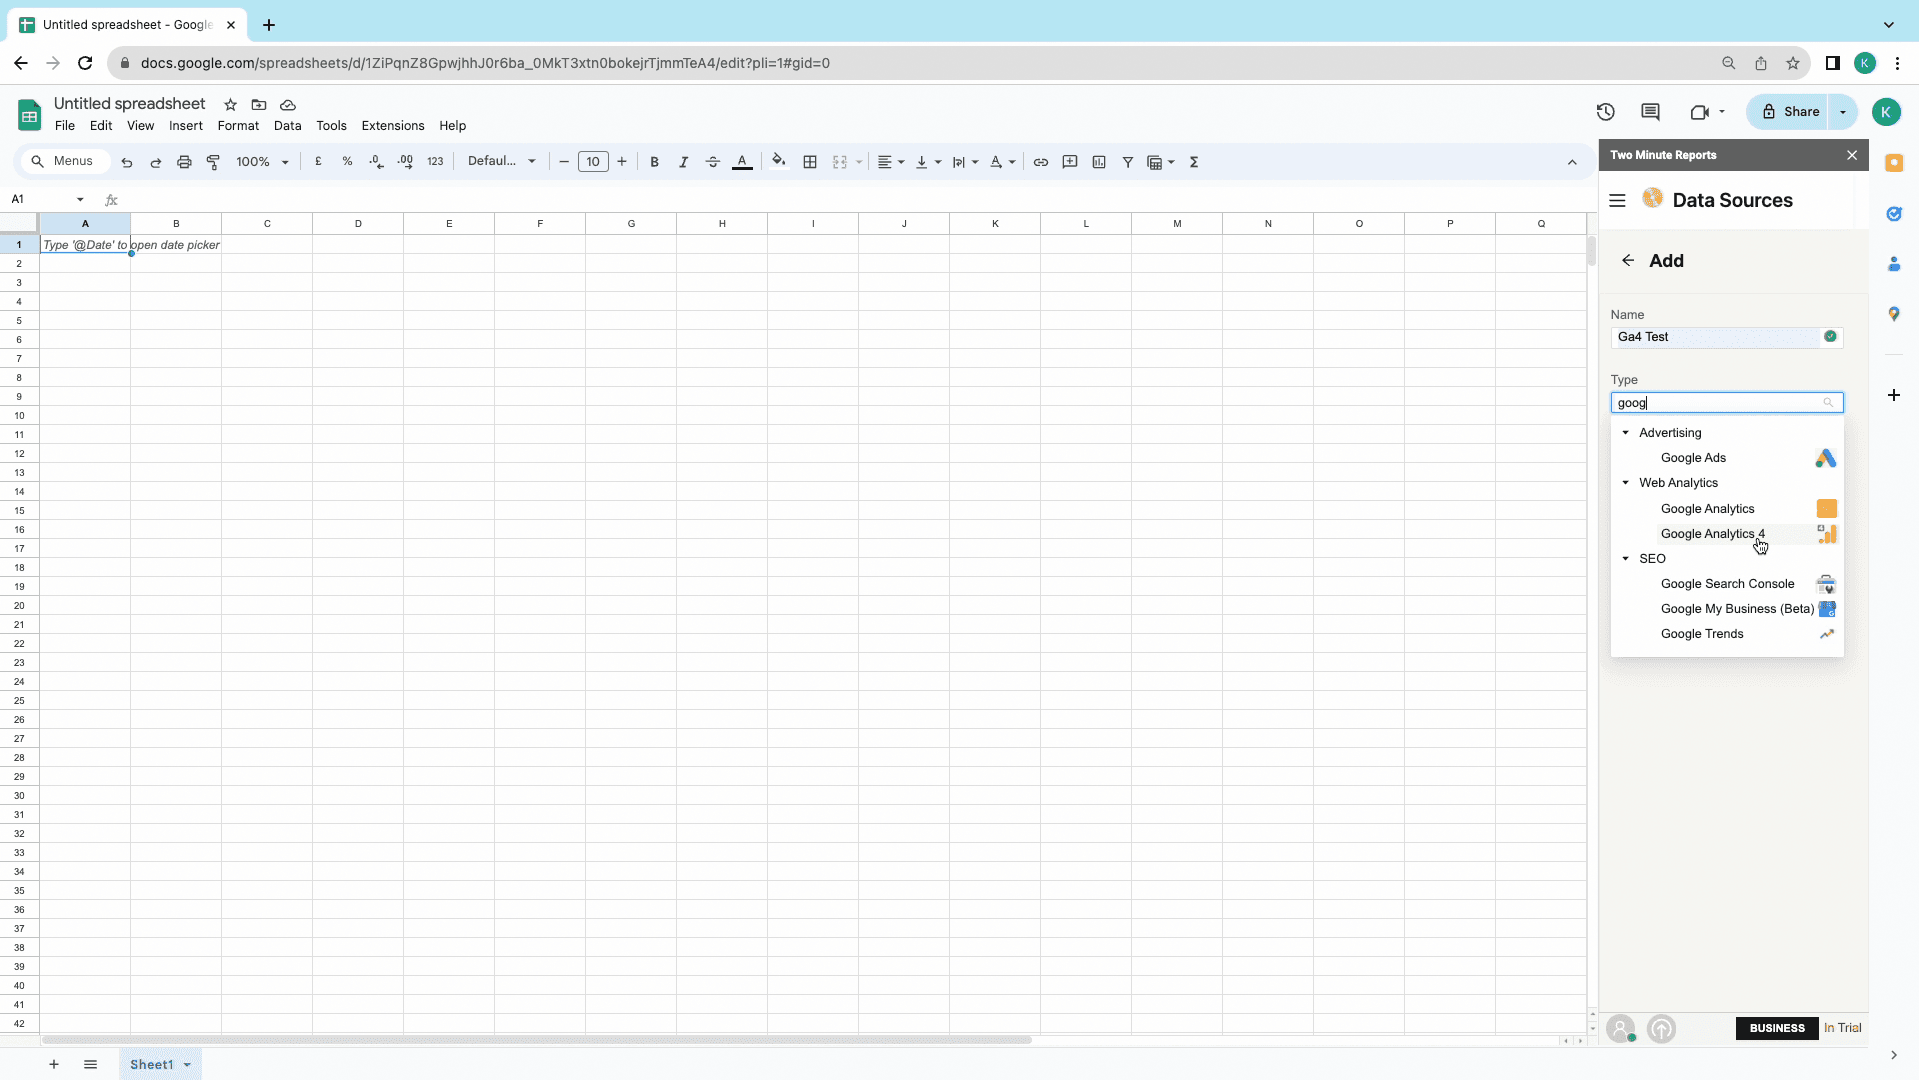
- Select Google Analytics 4 from the Web Analytics section in the drop-down menu.
- Log in to your Google Analytics account and authorise Two Minute Reports to draw data from it.
- Once authorised, click on “Save” from the pop-up window to save your new data source. TMR is now ready to export data from Google Analytics 4.
Step 2: Creating a Query and Report Configuration
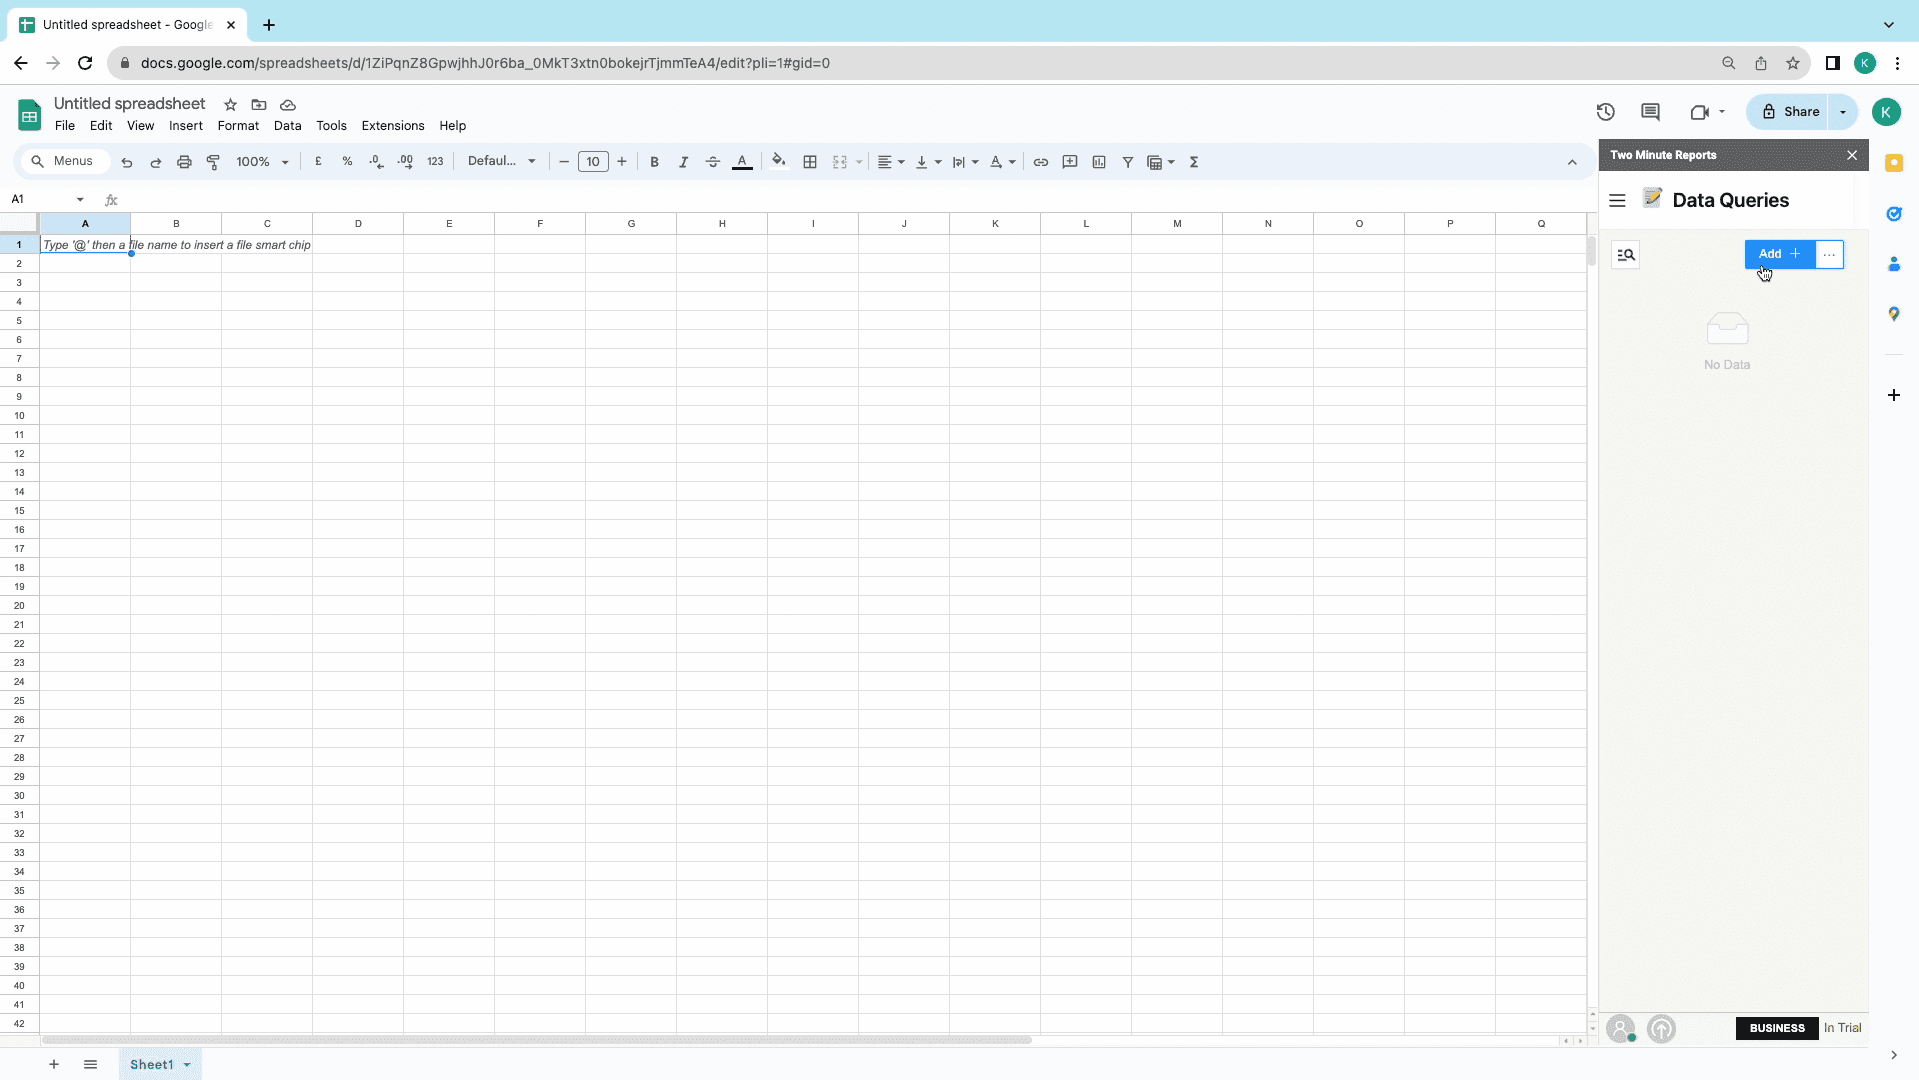
- To create a new report, Choose New Query from the Data Queries section.
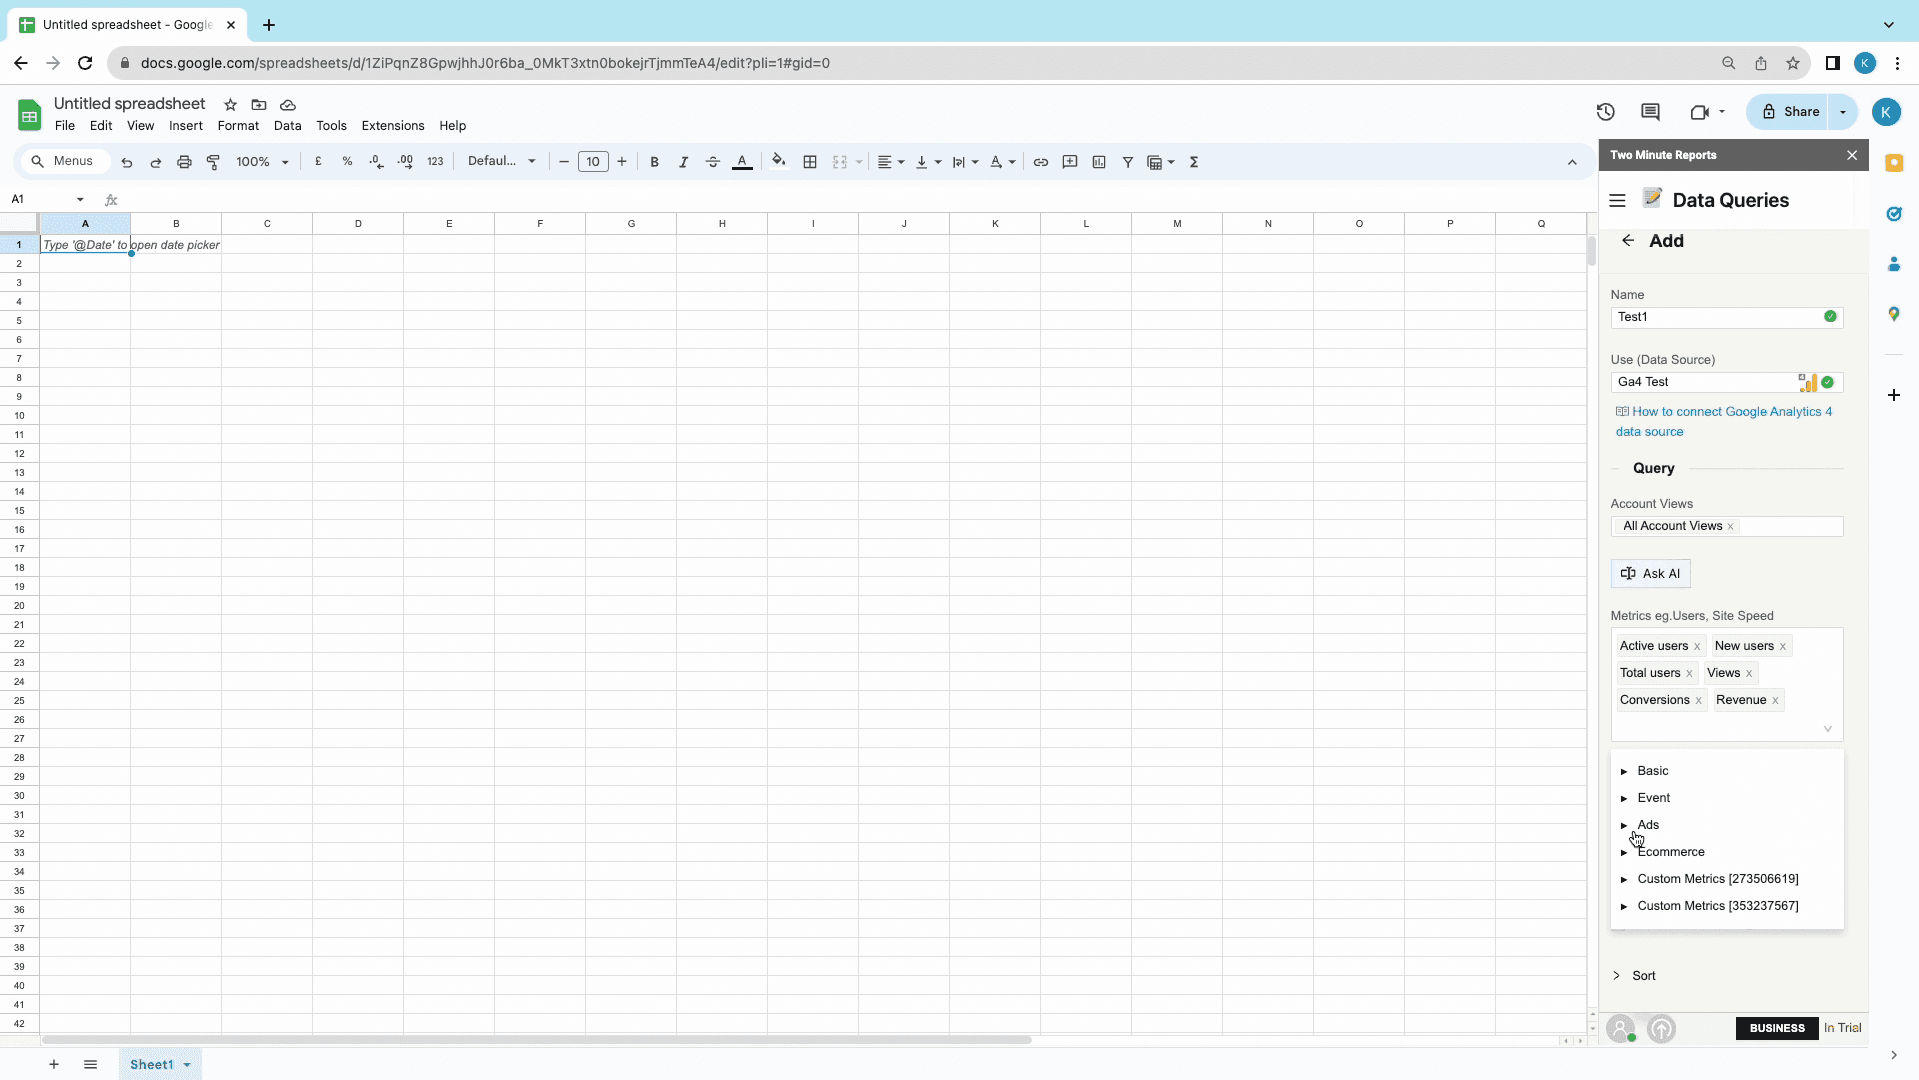
- Click on the “Add” button to the right, name your query, and choose the relevant data source: in this case, the newly created data source from the previous steps.
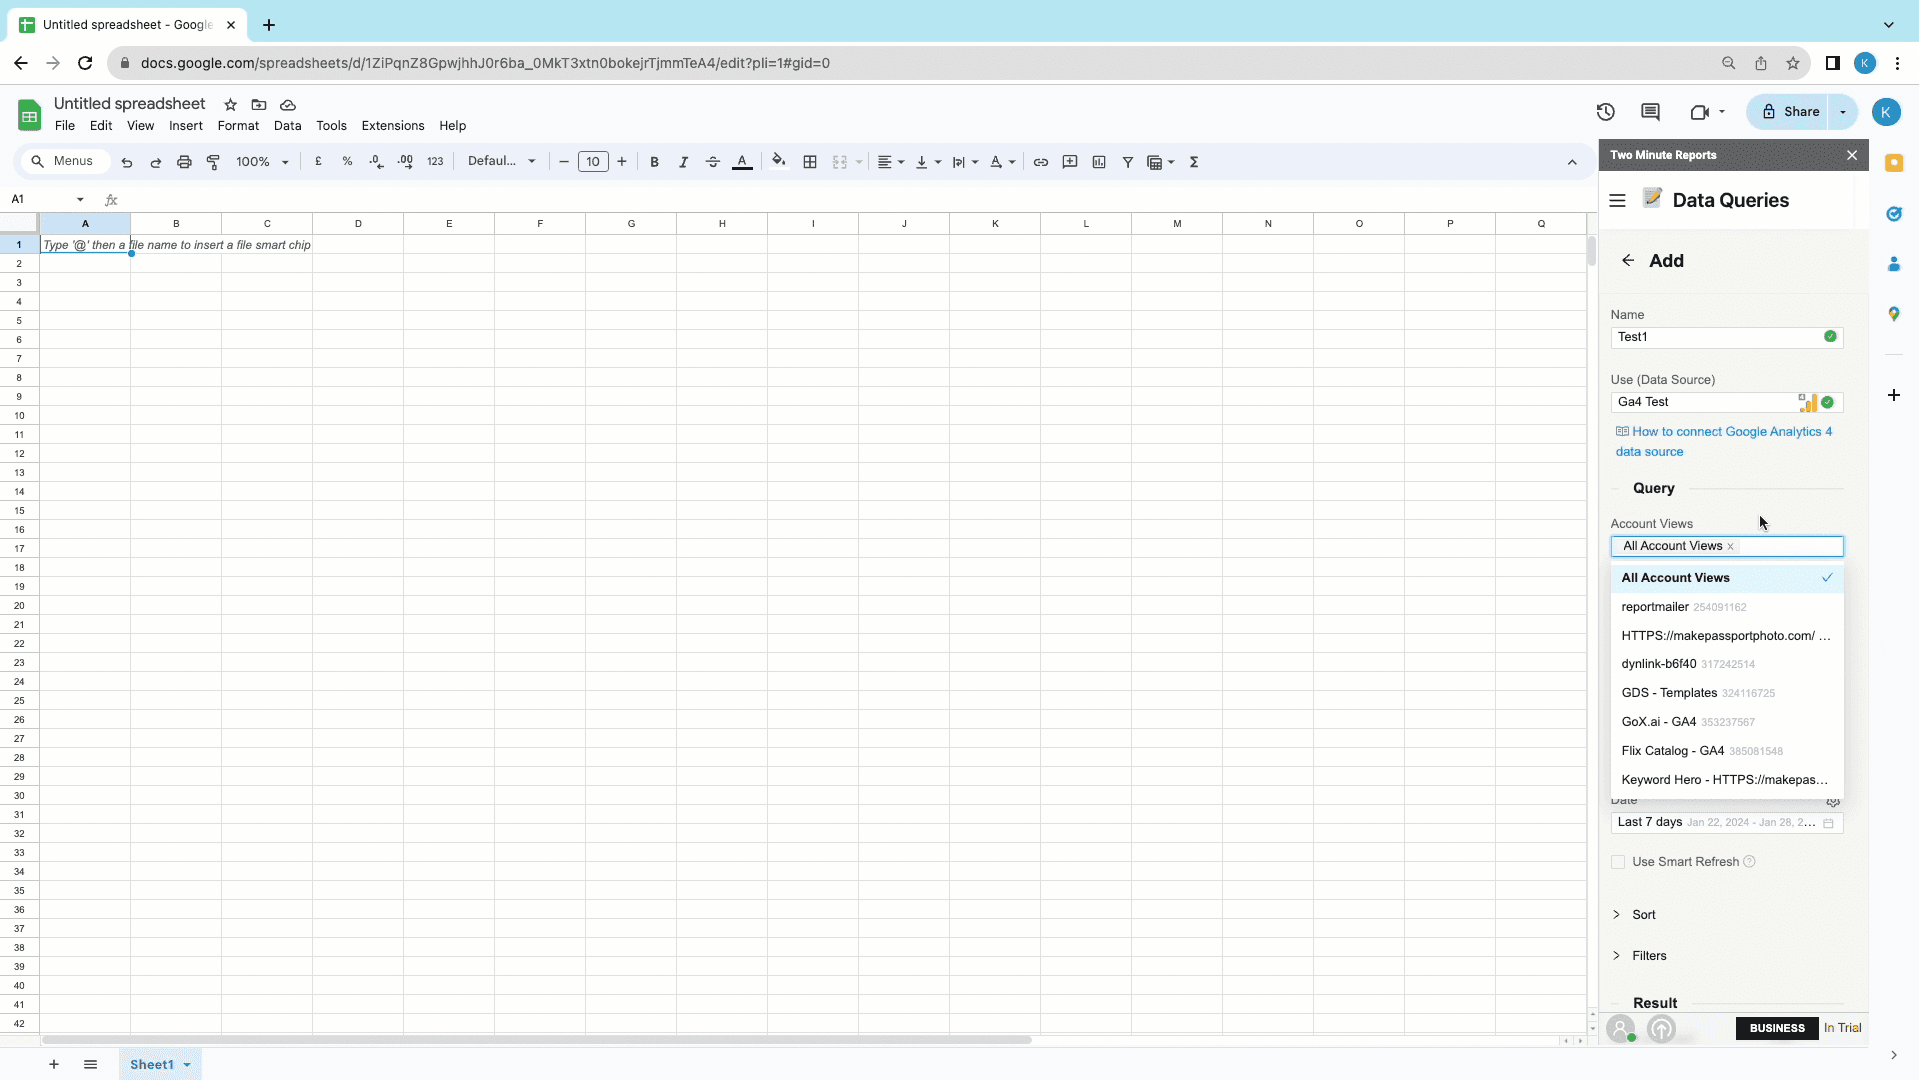
- Once the Data source is selected, you can choose the relevant Google Analytics view, from the “Account Views” dropdown menu. [NOTE: You can choose single, multiple, or all the accounts from the Google Analytics 4 account]
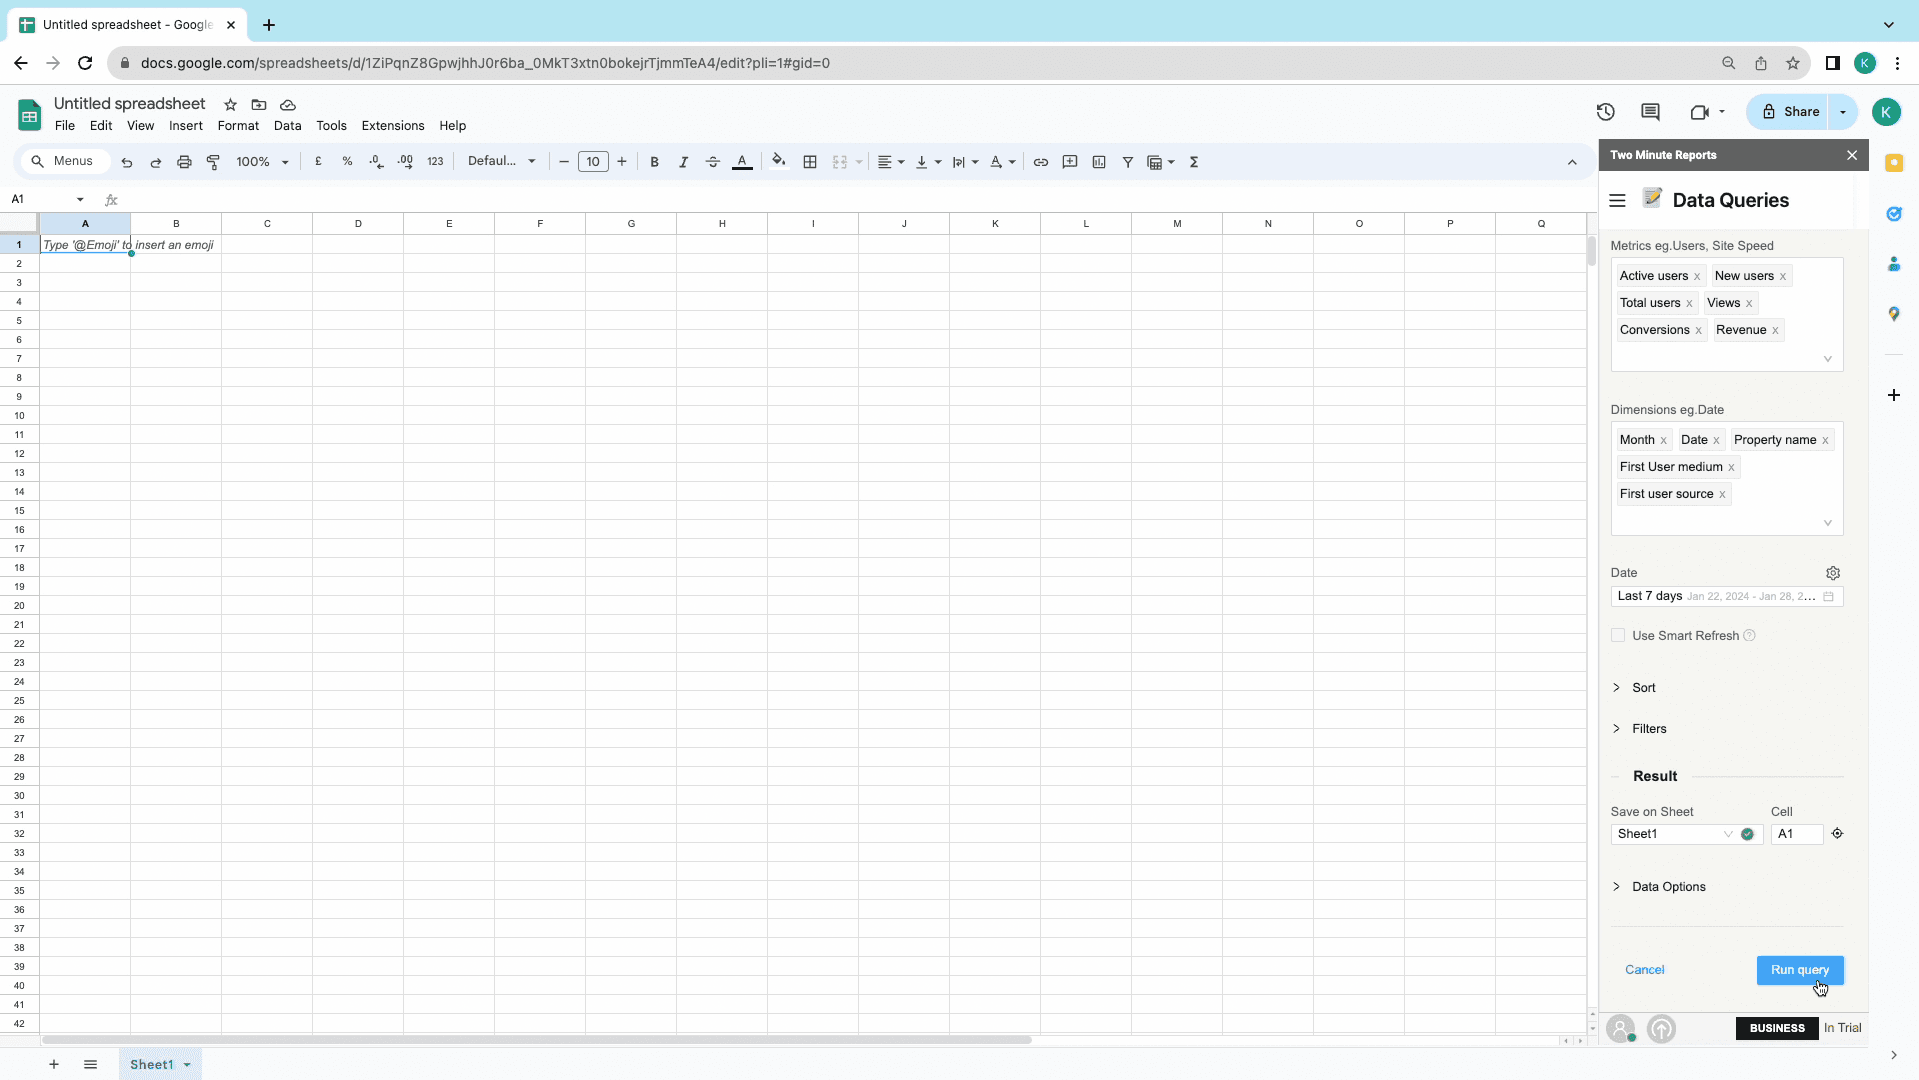
Now we get to report configuration: setting the dimensions and metrics for your report.
- Next, you choose the metrics that you need in your report. Make sure to explore the various categories in the “Metrics” dropdown menu to explore all the metrics available for your report.
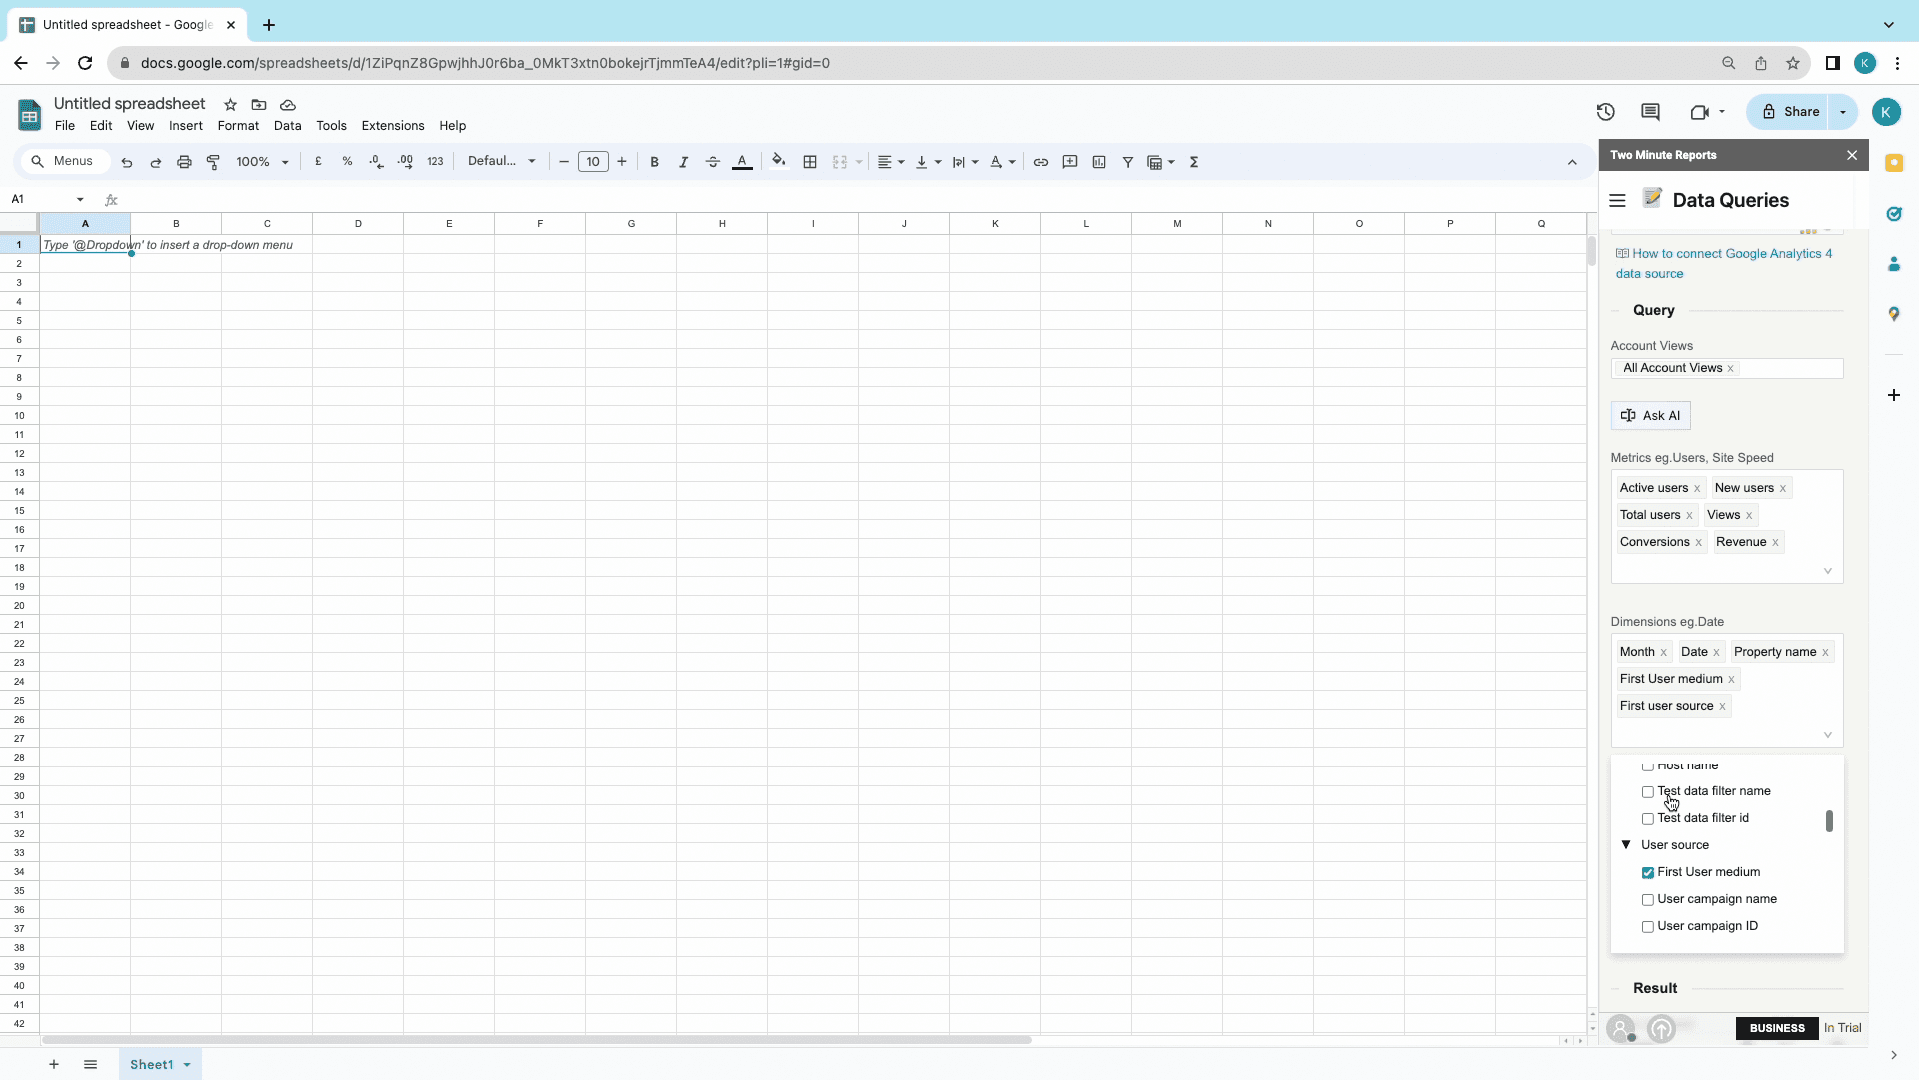
- Next, we set the dimensions of the report. Choose the right dimensions to add to your report, under the categories in the “Dimensions” dropdown menu.
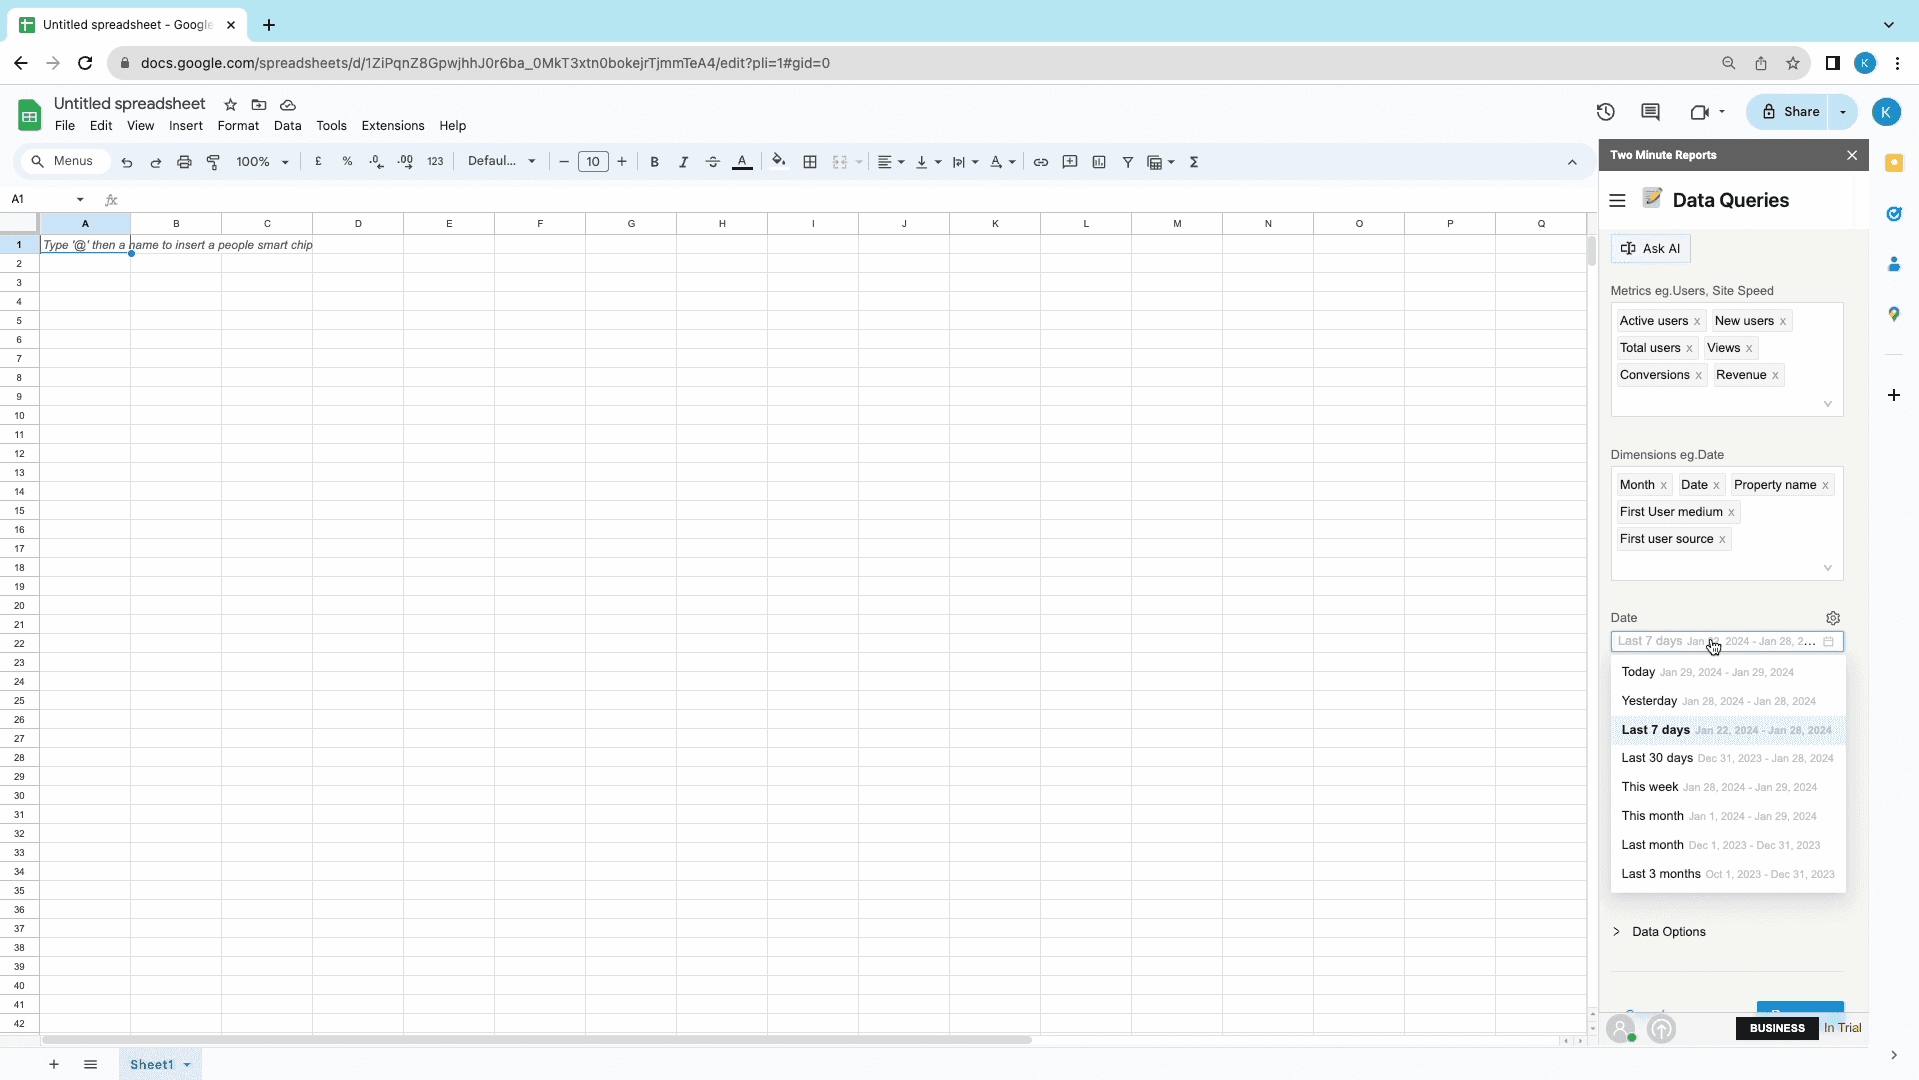
- After selecting your combination of metrics and dimensions, you can set the date range for the report. Choose from one of the predefined date ranges available from the dropdown menu, or create a custom date range as you require.
Once report configuration is done, select a cell from the current worksheet to start your report. You can choose it by:
- Clicking on the relevant cell
- Typing in the Cell’s number on the sidebar
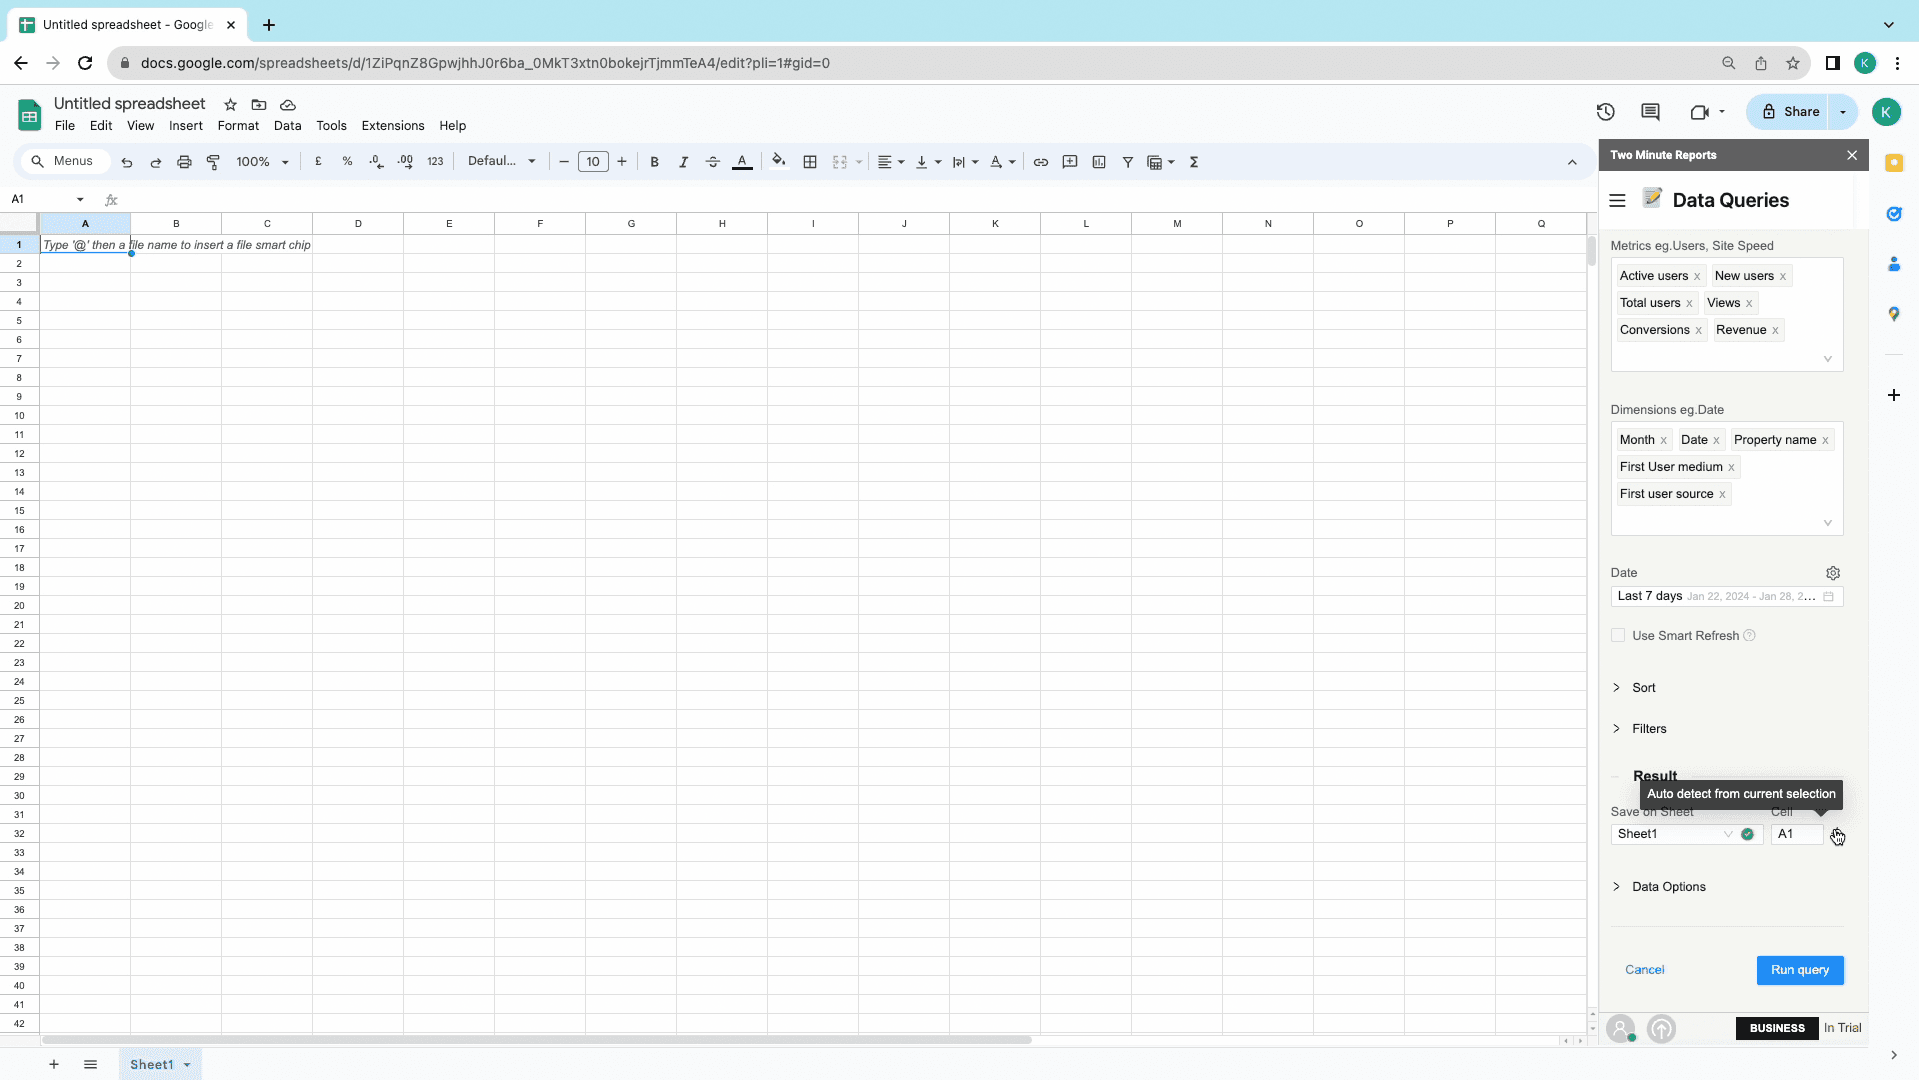
- Click on “Run Query” for Two Minute Reports to create a report.
- Once the data is fetched, click “Save” to save the query and create a report.
You can repeat the same query with this Google Analytics add on. Click on the “Play” icon to run the query again, the “Pencil” icon to edit the query, and the “Bin” icon to delete the query.
Method 2:Two Minute Reports Templates for your Google Analytics Spreadsheet
Want to spice up your data report with some effective data visualization? This Google Analytics Spreadsheet add on has everything you need!
What do templates do?
TMR’s templates enable reports to combine the right metrics and dimensions and present it visually within minutes.
Here’s how you can use our templates for your Google Analytics spreadsheet!
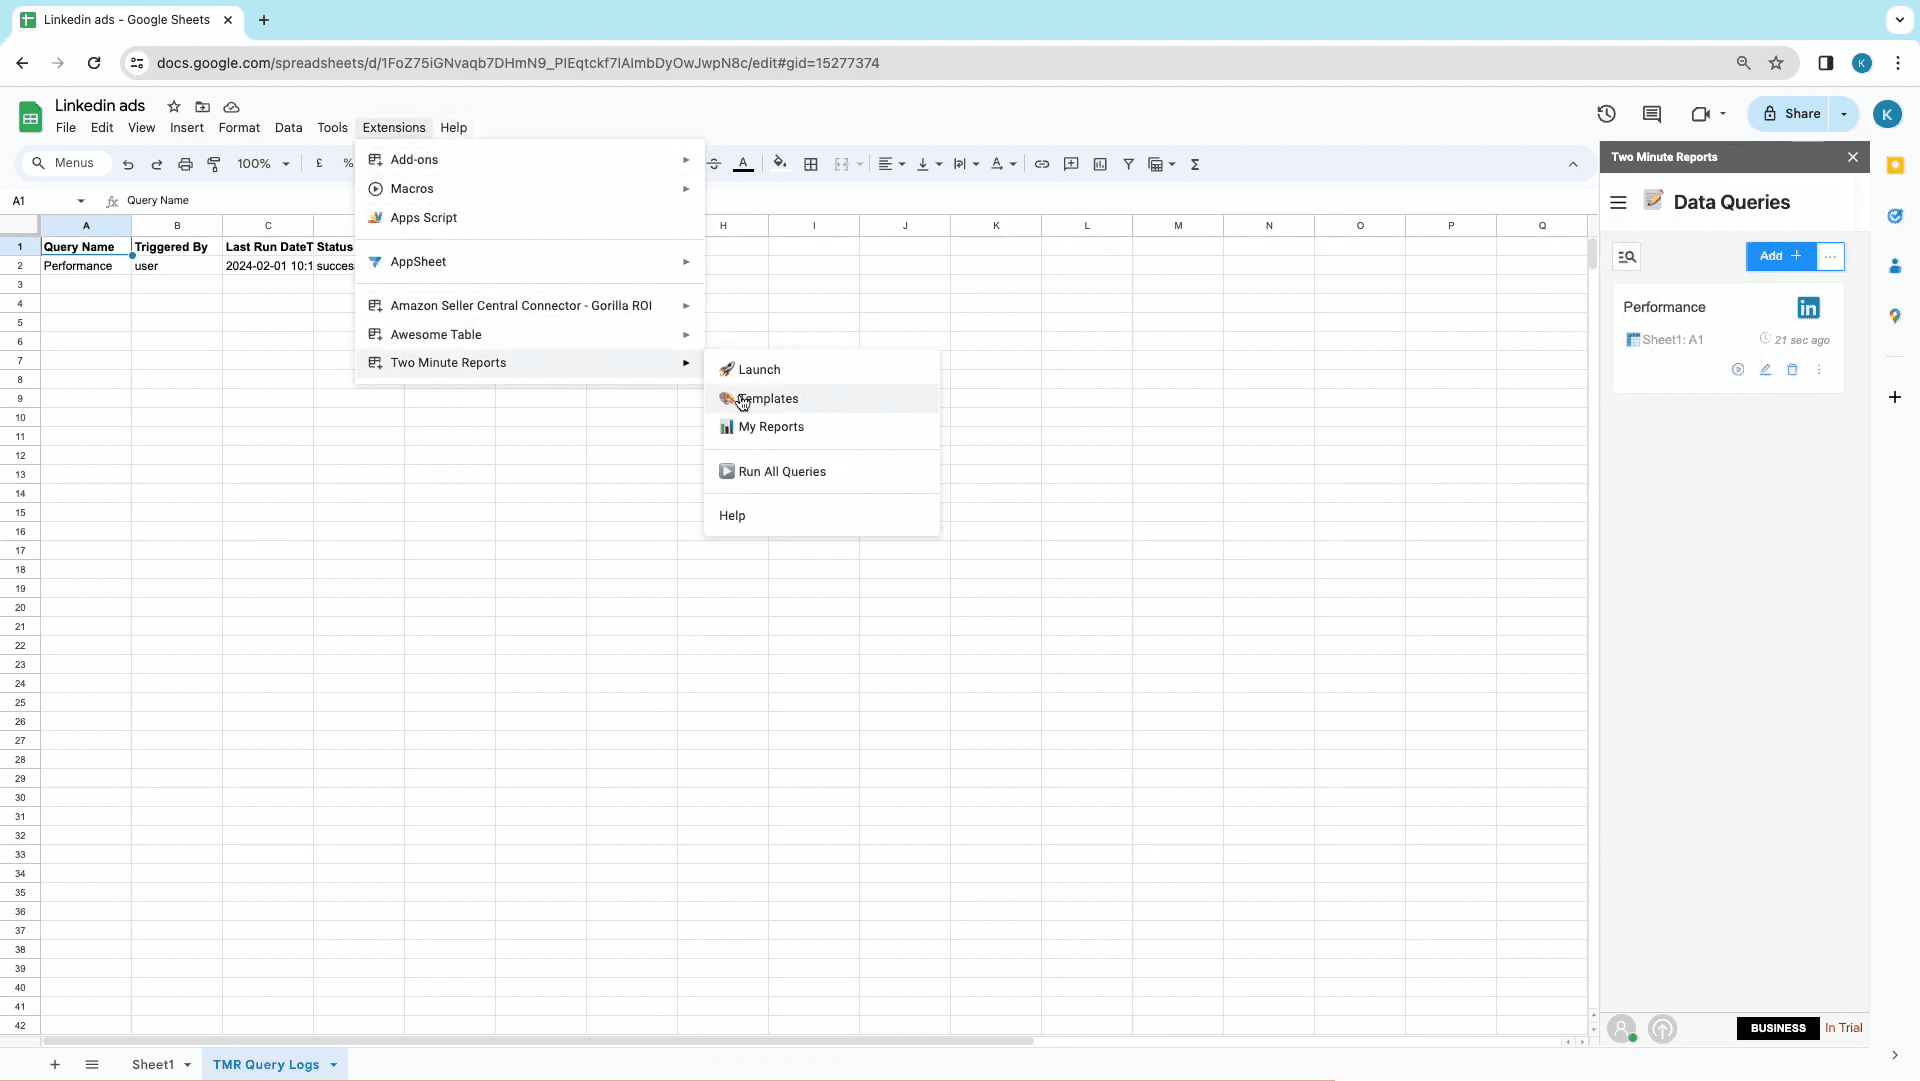
Click on Extensions -> Two Minute Reports ->Templates,or from the menu in the sidebar.
- Once the Template Gallery opens, you can filter by Category, Data Source, or even search for specific templates.
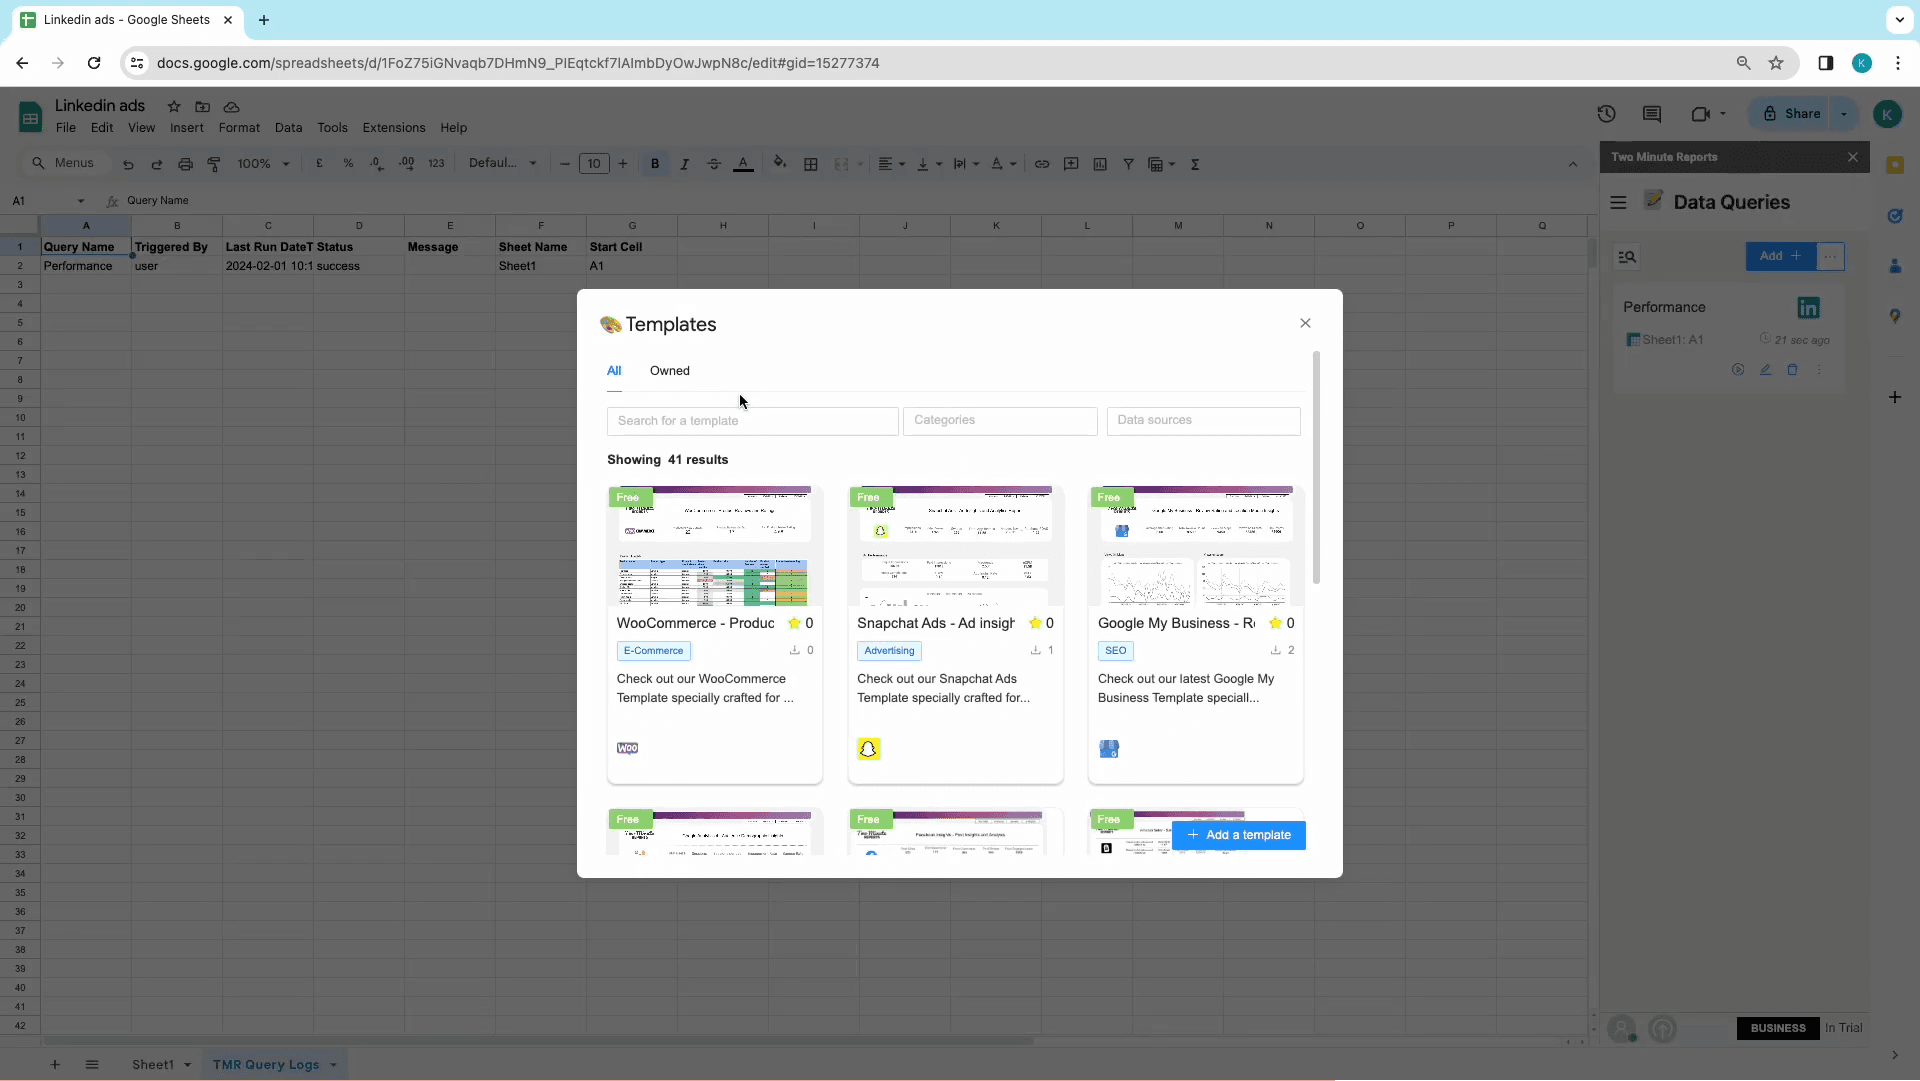
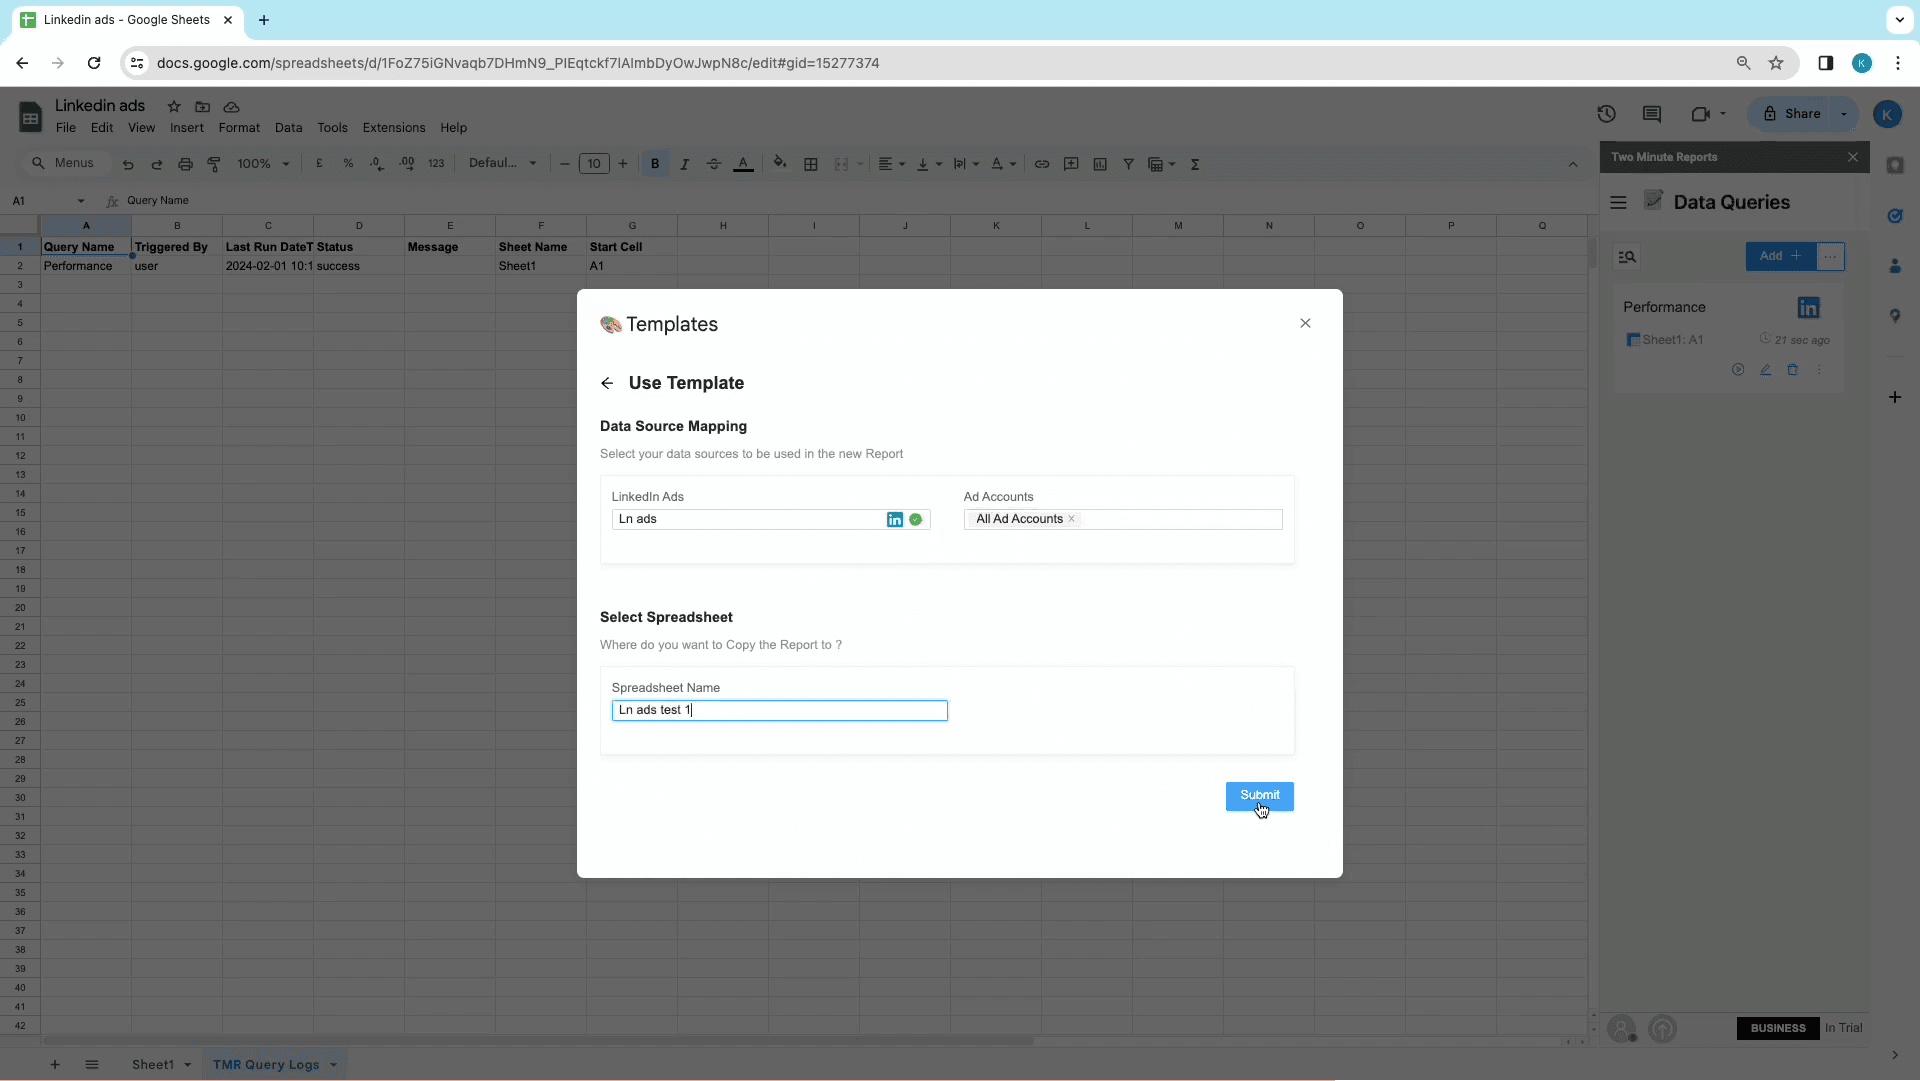
- Once you find the right template, click on “Use”
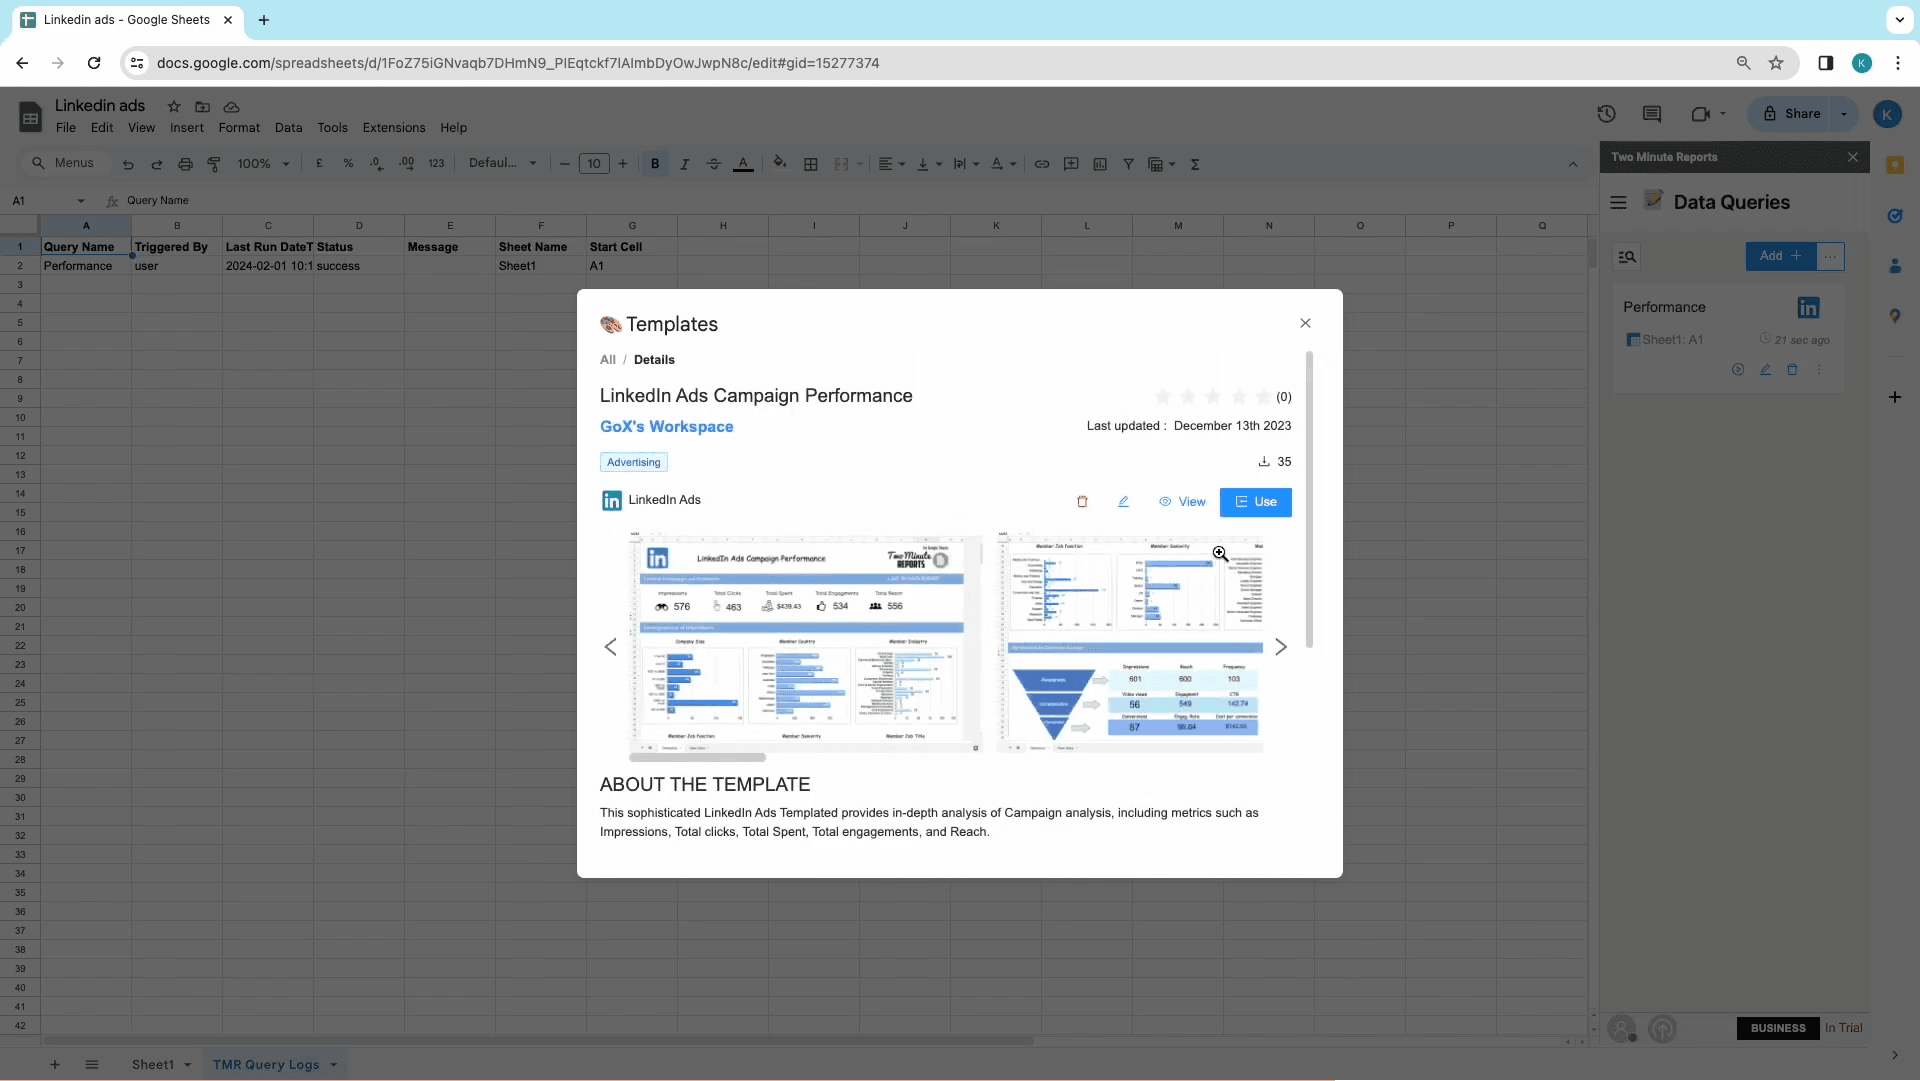
- To start mapping the data source, and the Account Views to the template.
- Give your spreadsheet a name, and click on “Submit” to create the report. Your report will be created in a new Google Spreadsheet.
- Click on go to spreadsheet to access the new report. Once the new report opens up, launch the “Two Minute Reports” sidebar
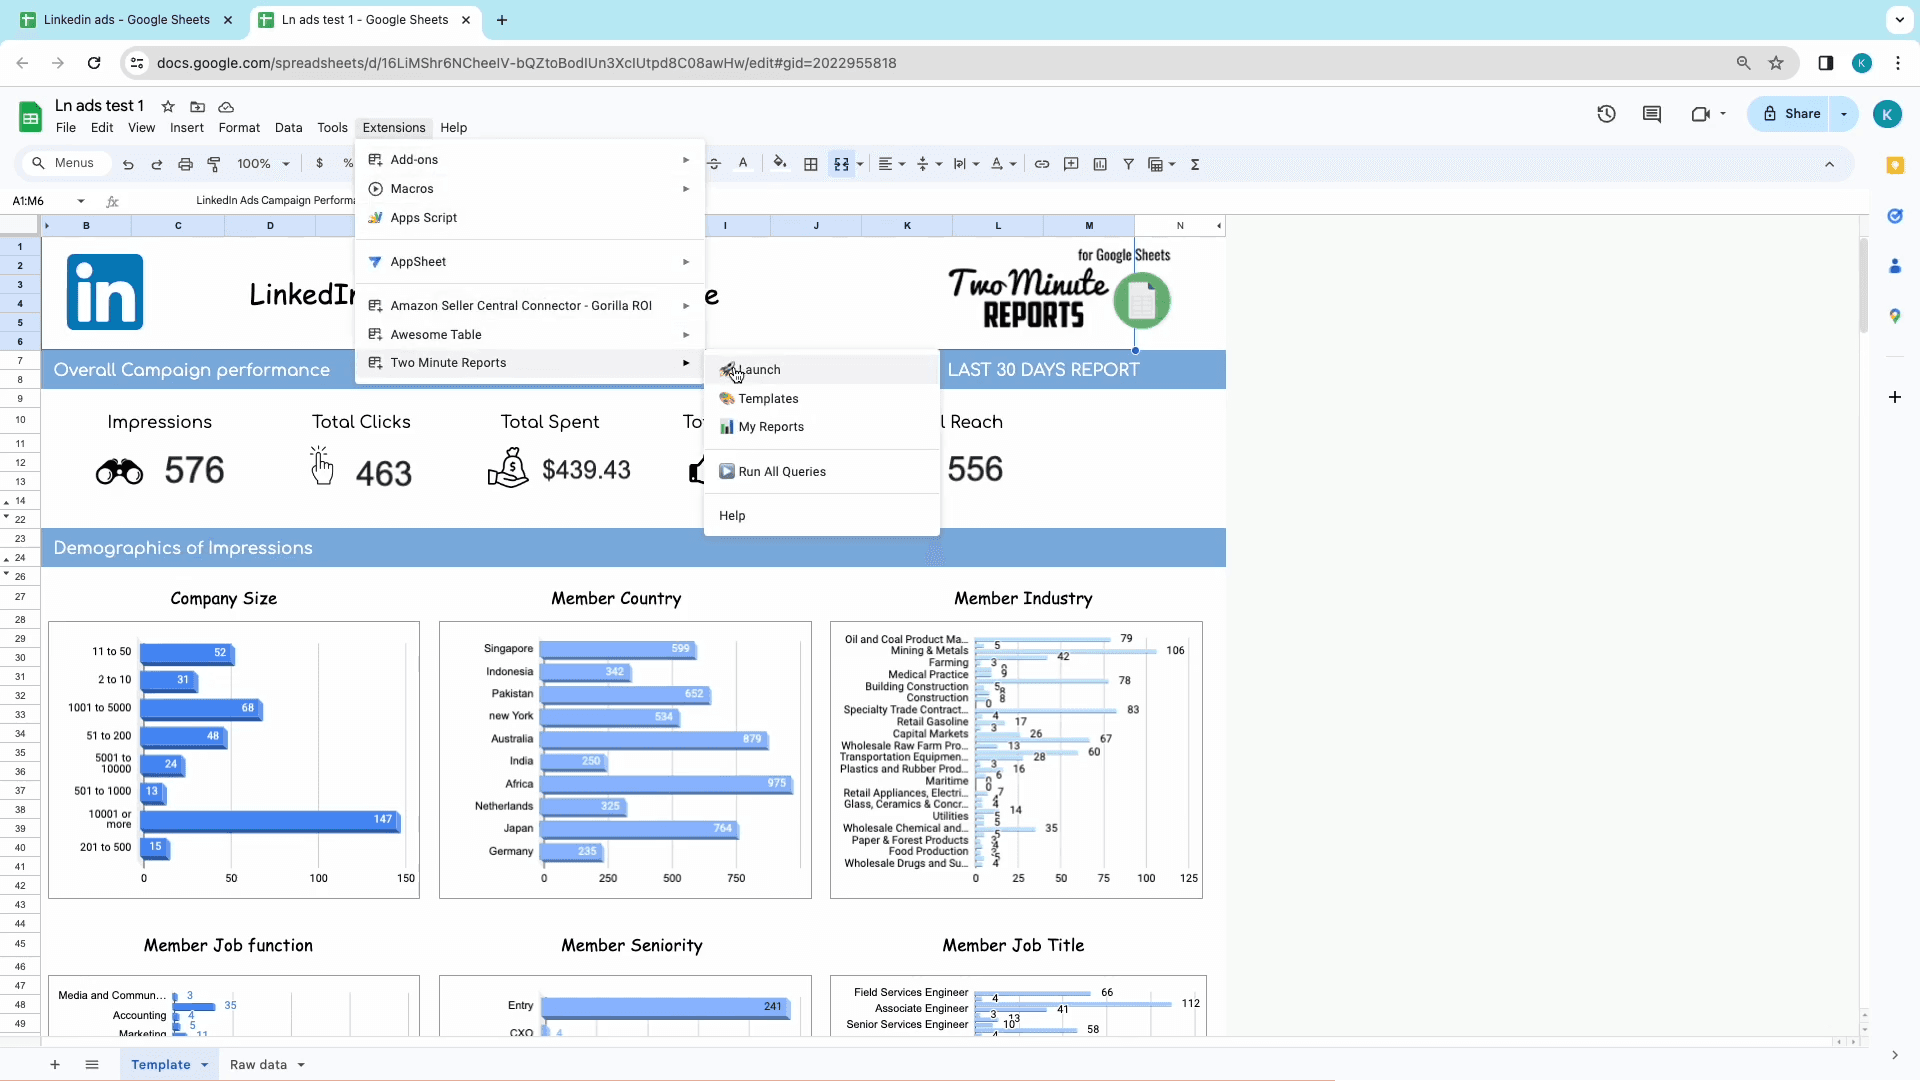
- Open the menu next to the “Add”button and click on “Run All Queries” to update the template with your data within the date range.
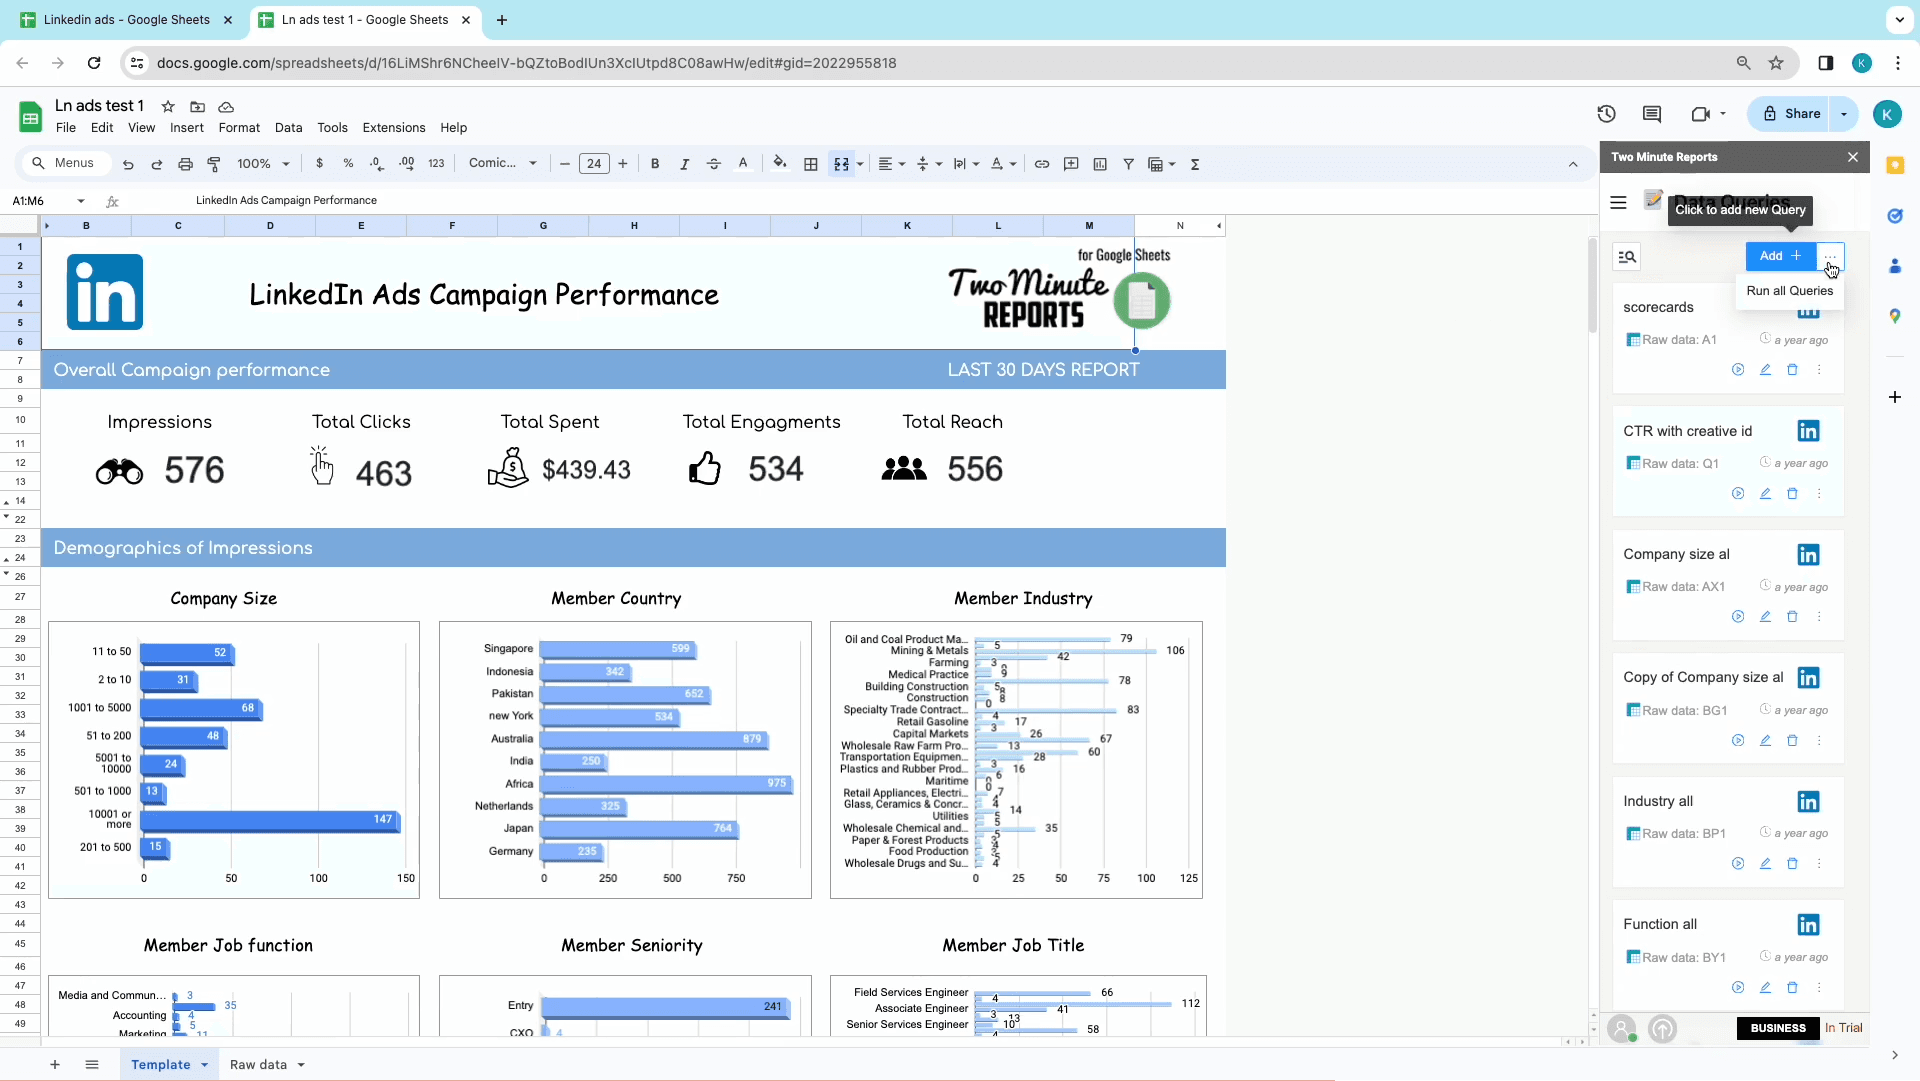
- Once the queries are complete, the template will be updated with your data!
Here! Have a Bonus….. Automate your Reports and Templates
Try out our exciting and unique feature, Schedule Refresh which automates your Reports and Templates to refresh automatically at your desired date, time and duration with a copy sent to your mail. Click here to learn more about Schedule Refresh.
Start using these quick templates for google sheets now
1. Google Analytics 4 - Audience Demographic Insights
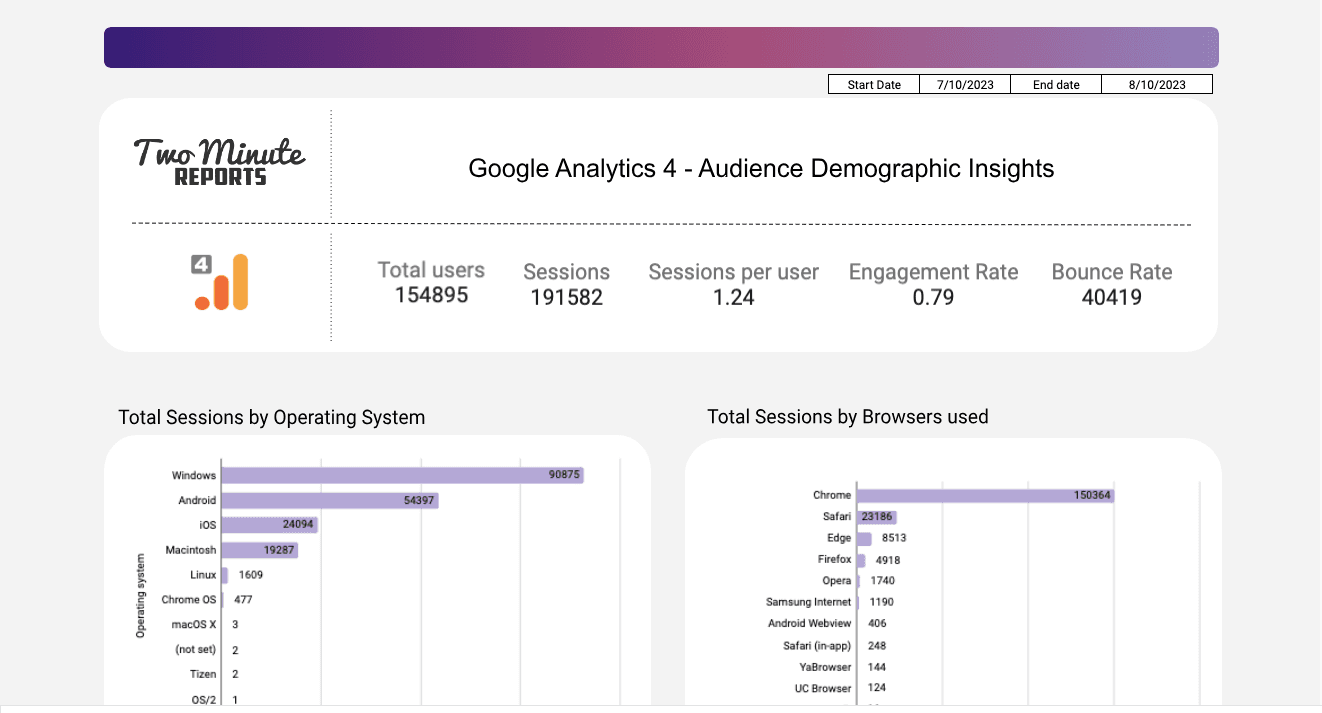
Check out our Google Analytics 4 Template specially created for Audience Demographic Insights. In this Template you first get the performance scorecards like Total users, Sessions, Engagement rate etc.. Next, you get all types of demographic insights like different Operating System, Browser used, Age Brackets, Device Platform, Device model, Gender and Language. Also, you get insights of Total users from different Countries and different Regions. Click on preview Template to get a better perspective of it.
2. GA4 - Acquisition Overview Report
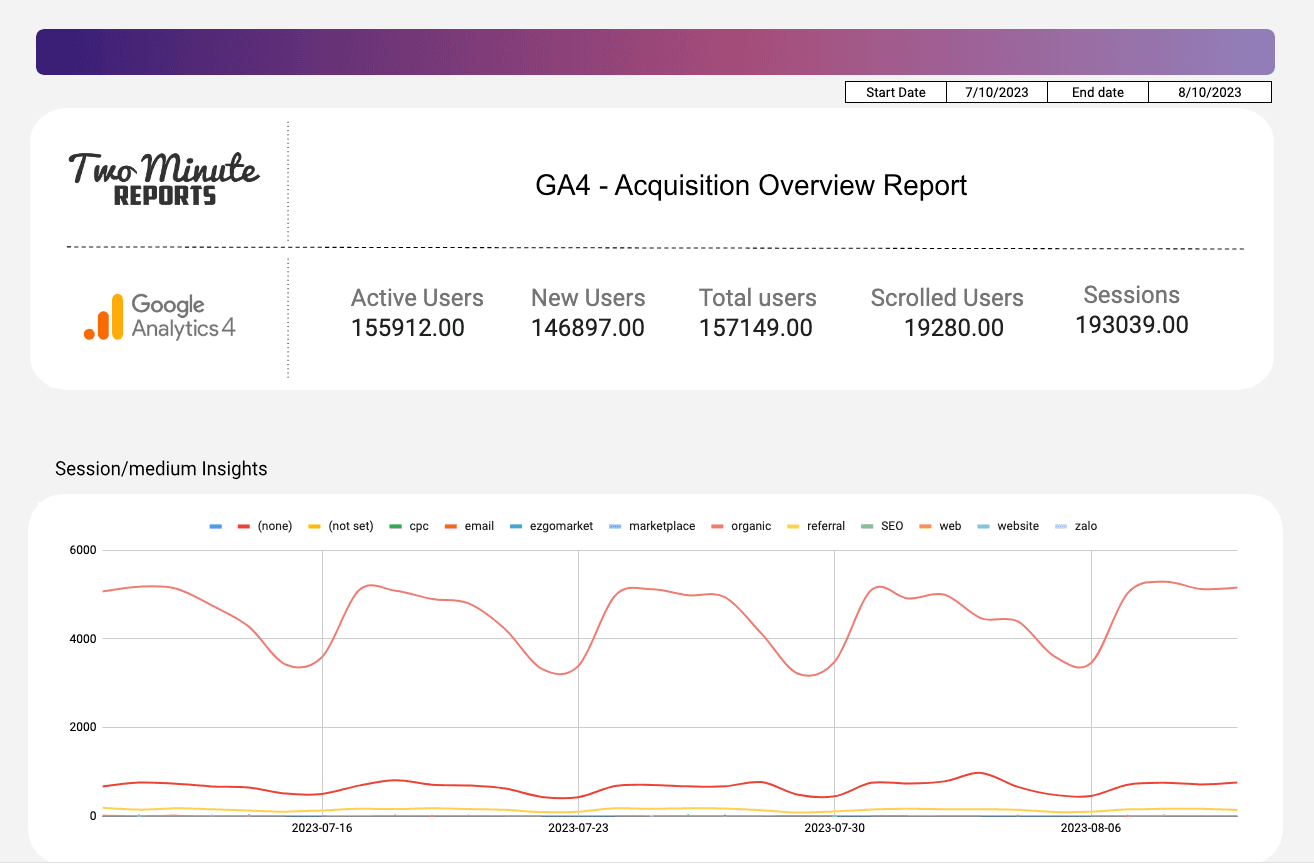
Check out our GA4 template specially created for Acquisition Overview. In this Report you first get the Session/medium insights in a timeline chart and in a tabular format. Up next, you get insights on the type of users like, Total, new and active users, followed on by 1d, 7d and 28d active users. Finally, you get a table to summaries the report which consists of source, session, medium and total number of users. Click on use template to get a better perspective of it.
Why import Google Analytics 4 Data in Google Sheets?
Google Sheets has been a popular option for all report creation, including Google Analytics 4, Google Ads, and Facebook (Meta) Ads: all for the best reasons.
Add-ons and Extensions
Google Sheets have the ability to integrate several key functions through add ons. For example, with an add on like Two Minute Reports, you can extract data, manage data, create reports, and even schedule reports.
Optimized Data Management
By constantly integrating your Google Analytics data to Google Sheets, you can get rid of downloading CSV files, analysing, and creating reports manually. Real-time data is fresh, and actionable, and ensures that you’re always working with the most current information.
Comprehensive Data Analysis
Insightful Metrics and Collaborative Accessibility are key benefits when using Google Sheets to manage your website/app’s performance. With a Google Analytics add on, you can dissect and analyze data, compare them, and create custom metrics that align with your business goals.
Collaborative Access
Building a Google Analytics spreadsheet also allows for seamless collaboration between functions in your organisation. The ease of data accessibility allows teams to work together with real-time data, fostering a highly collaborative environment.
Customization and Flexibility:
Importing Google Analytics 4 data into Google Sheets allows you to customize your reports according to your specific needs. Google Sheets allows proper arrangement of the metrics and dimensions that are most relevant to your business goal for effective analysis.
Workflow Efficiency
Setting up automated workflows to channel data from Google Analytics 4 to Google Sheets, effectively streamlines the data journey from source to analysis. This process ensures seamless synchronization when you connect Google Analytics to Google Sheets, enabling consistent workflow management by keeping your datasets always synchronized.
Marketing Strategy Enhancement
When you export Google Analytics 4 data into Google Sheets, you can conduct multi-channel analyses to simultaneously evaluate performance across multiple channels. This approach enables you to make data-driven decisions that enhance the effectiveness of your marketing strategy.
Top KPIs to export in GA4 Google Sheets Reports
Basic
Google Analytics data can provide basic information about your application or website which helps you understand the users from your website. Add these information to your data report to optimize your website/app’s operations, improve engagement, and experience.
TMR’s add on can fetch several important metrics like:
- Number of Sessions
- Total Users
- Views
- New Users
- Engaged Sessions
- Engagement Rate
- Active Users
- Total User Engagement Duration
- Average Session Duration
- 7-day active users
Performance
Google Analytics data under this category can help you determine the performance to increase engagement and optimize your website/app:
Some important metrics in our add on include:
- Popular Pages/Screens
- First-Time Visitors
- Engaged Sessions and Users
- Engagement Rate
- Active Users
- User Engagement Duration
Event
The Google Analytics data under this category helps you analyze the most popular events on your website/app, and their frequency. These insights can help improve events and improve revenue with increased ARPU(Average revenue per user).
- Conversion rates
- Event Counts
- Revenue
- Transactions
This category also helps you learn about your users’ behavior with metrics such as:
- Events per Session
- Events Count per User
Time
Analyzing the date of the event with Google Analytics 4 helps you identify patterns in user behavior, compare data points across months, and identify trends to optimize operational strategy.
Some metrics that are covered in our add on include the Month, Year, or even the Week number of the Event, in both Saturday-to-Monday or Monday-to-Sunday formats. TMR also allows you to use the Year-Month format to create concise and reader-friendly reports.
Session Source
Identify where your site visitors originate from the Session Source metrics to optimize your marketing campaigns, analyze user behavior, and track your site’s growth.
Some important metrics from our add on include:
- Source
- Medium
- Channel Grouping
- Campaign Name
- Keyword(s)
- Group Name
Content
This Google Analytics data can be prominent indicators of your website/app’s performance. Optimizing content can help improve content operations, and make data-driven decisions.
Some actionable metrics in our add on include:
- Page Path, Title, and Location from Frequent User Visits
- Landing page from Frequent User Visits
- Page Path, Query String, and Screen Class to understand User Interaction
Geo
Discover where your audience is from with Google Analytics 4’s Geo Metrics. This information can help target marketing efforts and improve User Experience for the corresponding locations. This data can also help you identify potential regions to target first.
Some popular metrics in our add on include:
- Country
- City
- Region
Property
These specific data are focussed on user behavior across different platforms. These insights will help you improve User Experience, and monitor which versions of your website/app perform the best.
Some important metrics include:
- Source of Traffic
- Host Name
- Stream Name
- Stream ID
Device
These Google Analytics data can help you track the devices your users use to visit your website/app. Use these insights to improve design, optimize User Experience, and optimize language code for content targeting. Some effective metrics include:
- Type of Device
- Operating System
- Language Setting
- Screen Resolution
- Browser
- Device Model and Manufacturer
E-commerce Metrics
The Website/App is the largest asset in the e-commerce biz. Identifying the top-selling products, the effectiveness of functions, product categories, and the checkout process are crucial to improving experience and increasing conversions. If you’re in the e-commerce biz, add these Google Analytics data to your data report.
- Purchases
- Item Revenue
- Item Name
- Item Brand
- Item Category 3
- Add to carts
Get Google Analytics data in Looker Studio

Two Minute Reports can be installed as an add on to integrate Google Analytics 4 data with Looker Studio (formerly Google Data Studio) as well, enabling advanced data analysis and visualization.
This Google analytics add on allows the creation of detailed reports and dashboards using insights from Google Analytics 4 insights without the complexity of manual data entry. Looker Studio’s customisation capabilities also lets users craft custom formulae in a user-friendly interface.
With seamless integration, comprehensive analytical capabilities, and automated workflows, strategic business intelligence from Google Analytics 4 has just become quicker and accessible.
Connect other Platform Data Sources with Google Sheets
Google Analytics
Website analytics platform from Google for data-driven insights.
FAQs
How do I get Google Analytics data into Google Sheets?
You can use our Google Sheets add on Two Minute Reports to get google analytics data in google sheets. Please go through the method 1 and method 2 mentioned in this article.
How do I automatically update Google Sheets from Google Analytics?
You can use our feature Schedule Reports to schedule the queries automatically at your preferred time to automate the whole process without manual intervention.
How is Google sheet useful in data analytics?
Google Sheets, paired with Two Minute Reports, streamlines data analytics by importing LinkedIn ads data directly into the sheets