Connect Linkedin Ads to Google Sheets: Tutorial & Templates (2024)
How to connect LinkedIn to Google Sheets and automate it
We will discuss a step-by-step guide to exporting LinkedIn ads to your Google Sheets and how to arrange it in great detail. Our state-of-the-art tool not only helps you automate and extract LinkedIn data and add it to Google Sheets, but also simplifies processing, lets you collaborate with the team, integrates resources, and much more.
Our holistic LinkedIn Ad Reports will analyze the current and previous Linked Campaign Manager data in detail, which you can extract and add to your Google Sheets without writing any code. Here’s how our Google Sheets integration works.
Method 1: Connect LinkedIn Ads to Google Sheets using Two Minute Reports Sidebar.
Method 2: Connect LinkedIn Ads to Google Sheets through our thoughtfully designed in-built Templates of Two Minute Reports.
Method 1: Connecting LinkedIn Ads data to Google Sheets using Two Minutes Report Sidebar
You can Check out the process to install, Two Minute Reports google sheets add on. After installing, follow the steps below.
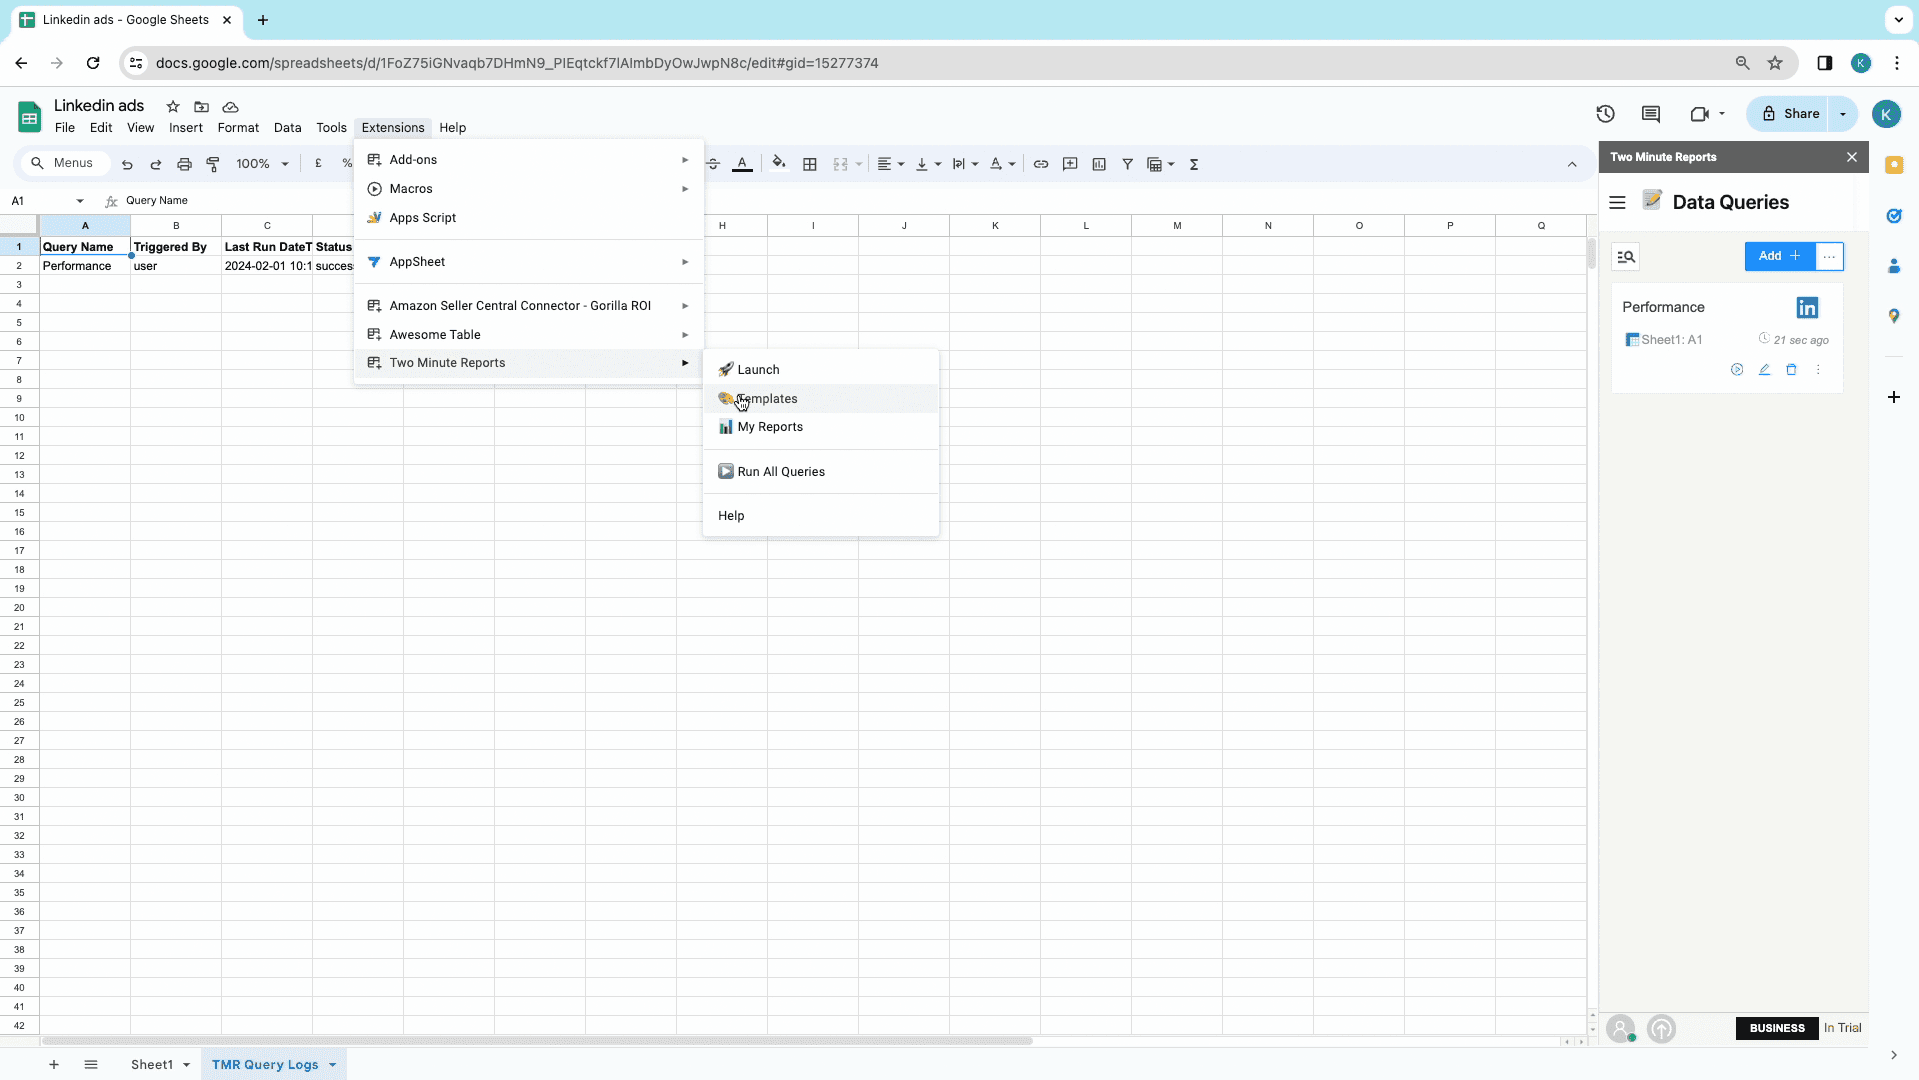
 Click on Extensions -> Two Minute Reports -> Launch
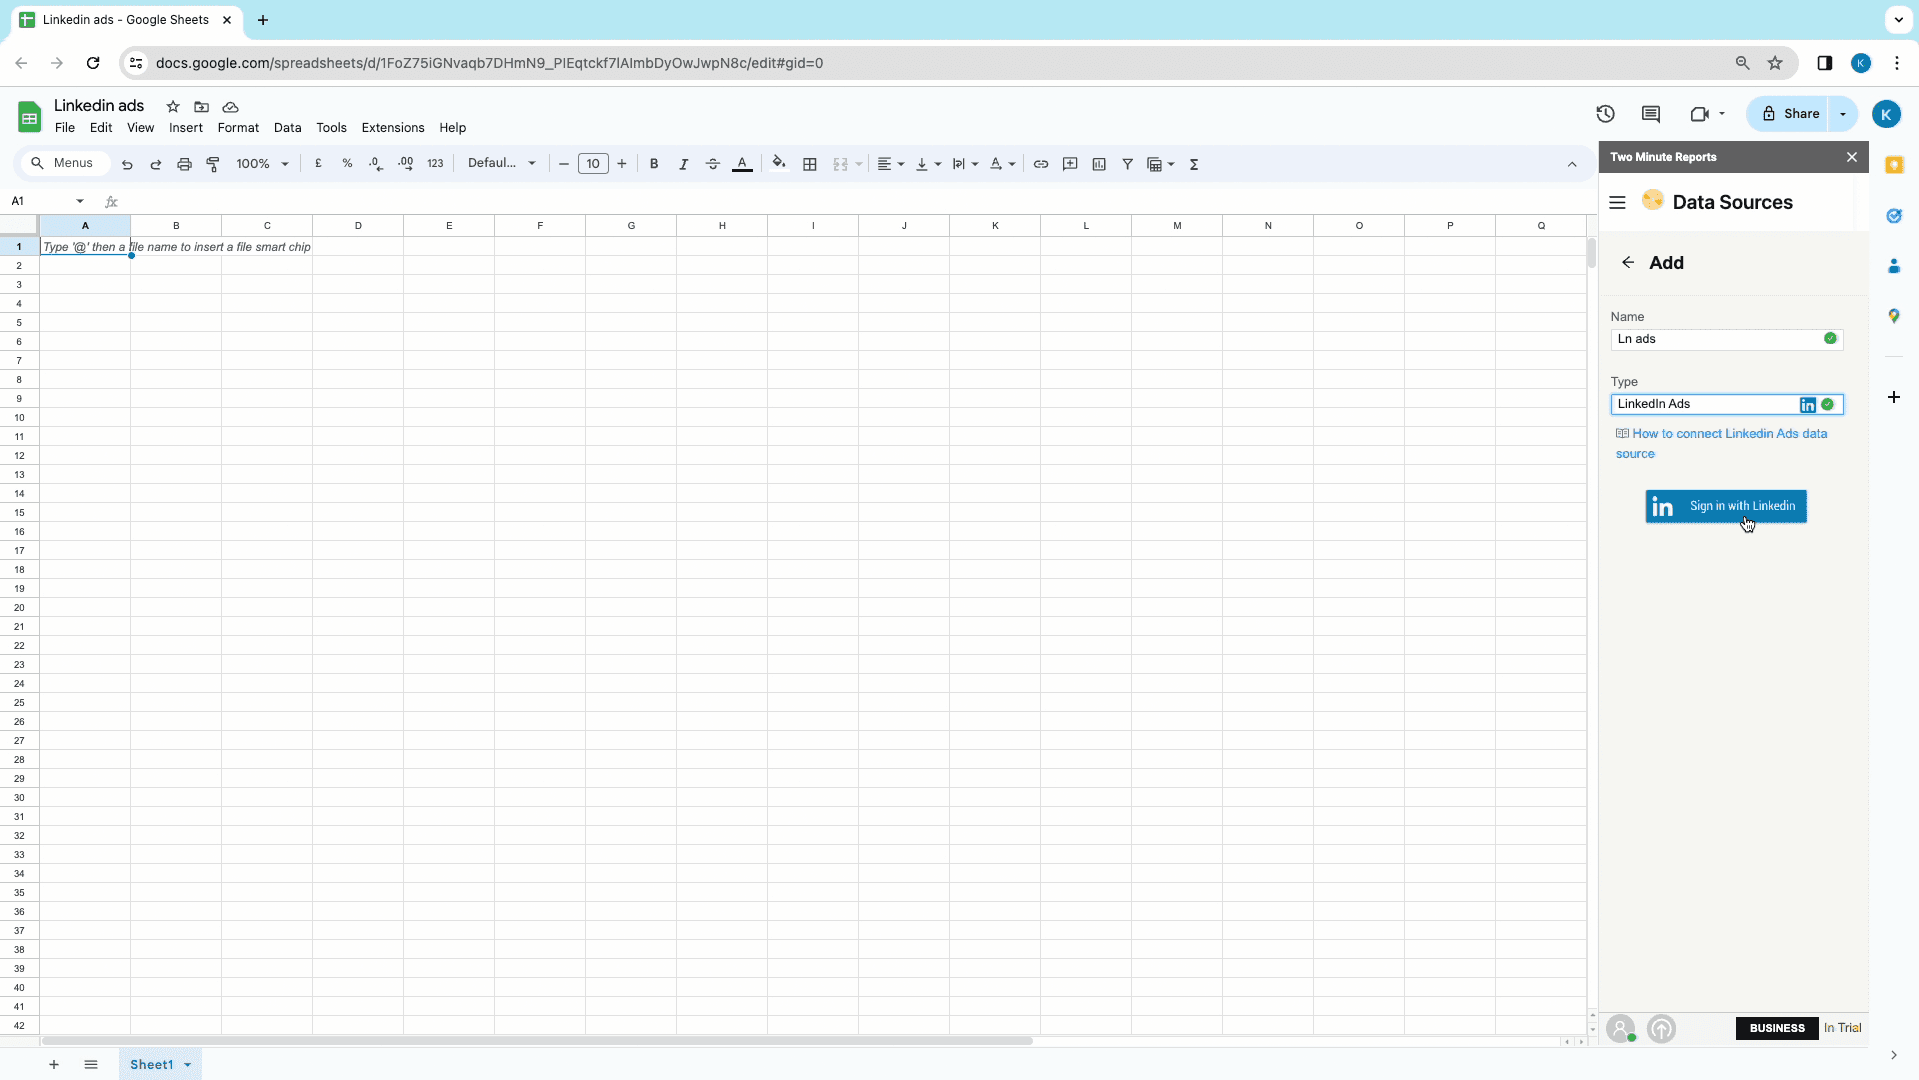
- Once the sidebar is open, choose Data sources. Start naming your Data source and choose LinkedIn Ads. In the Type section, click on the drop down and choose LinkedIn Ads. Then sign in with your LinkedIn Ads account and complete the authorization.
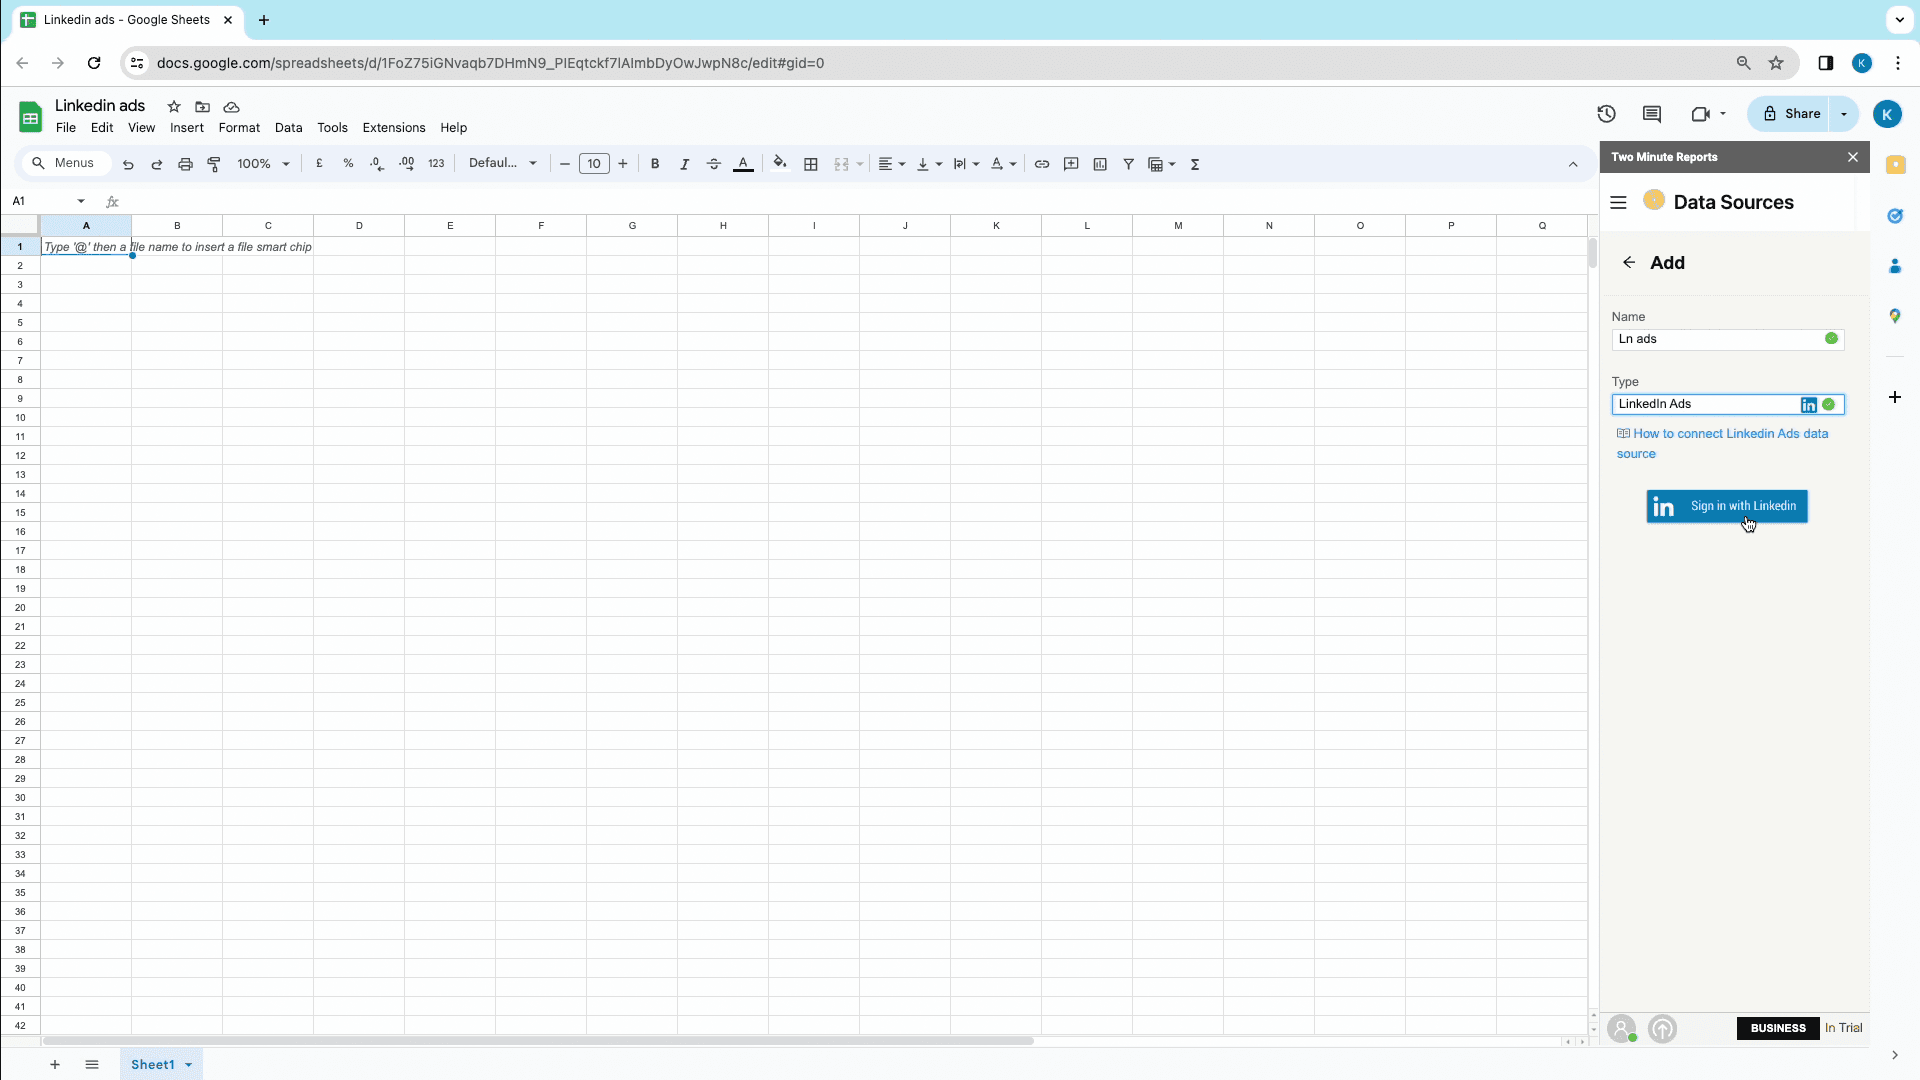
- Click on Yes to save your newly created Data Source.
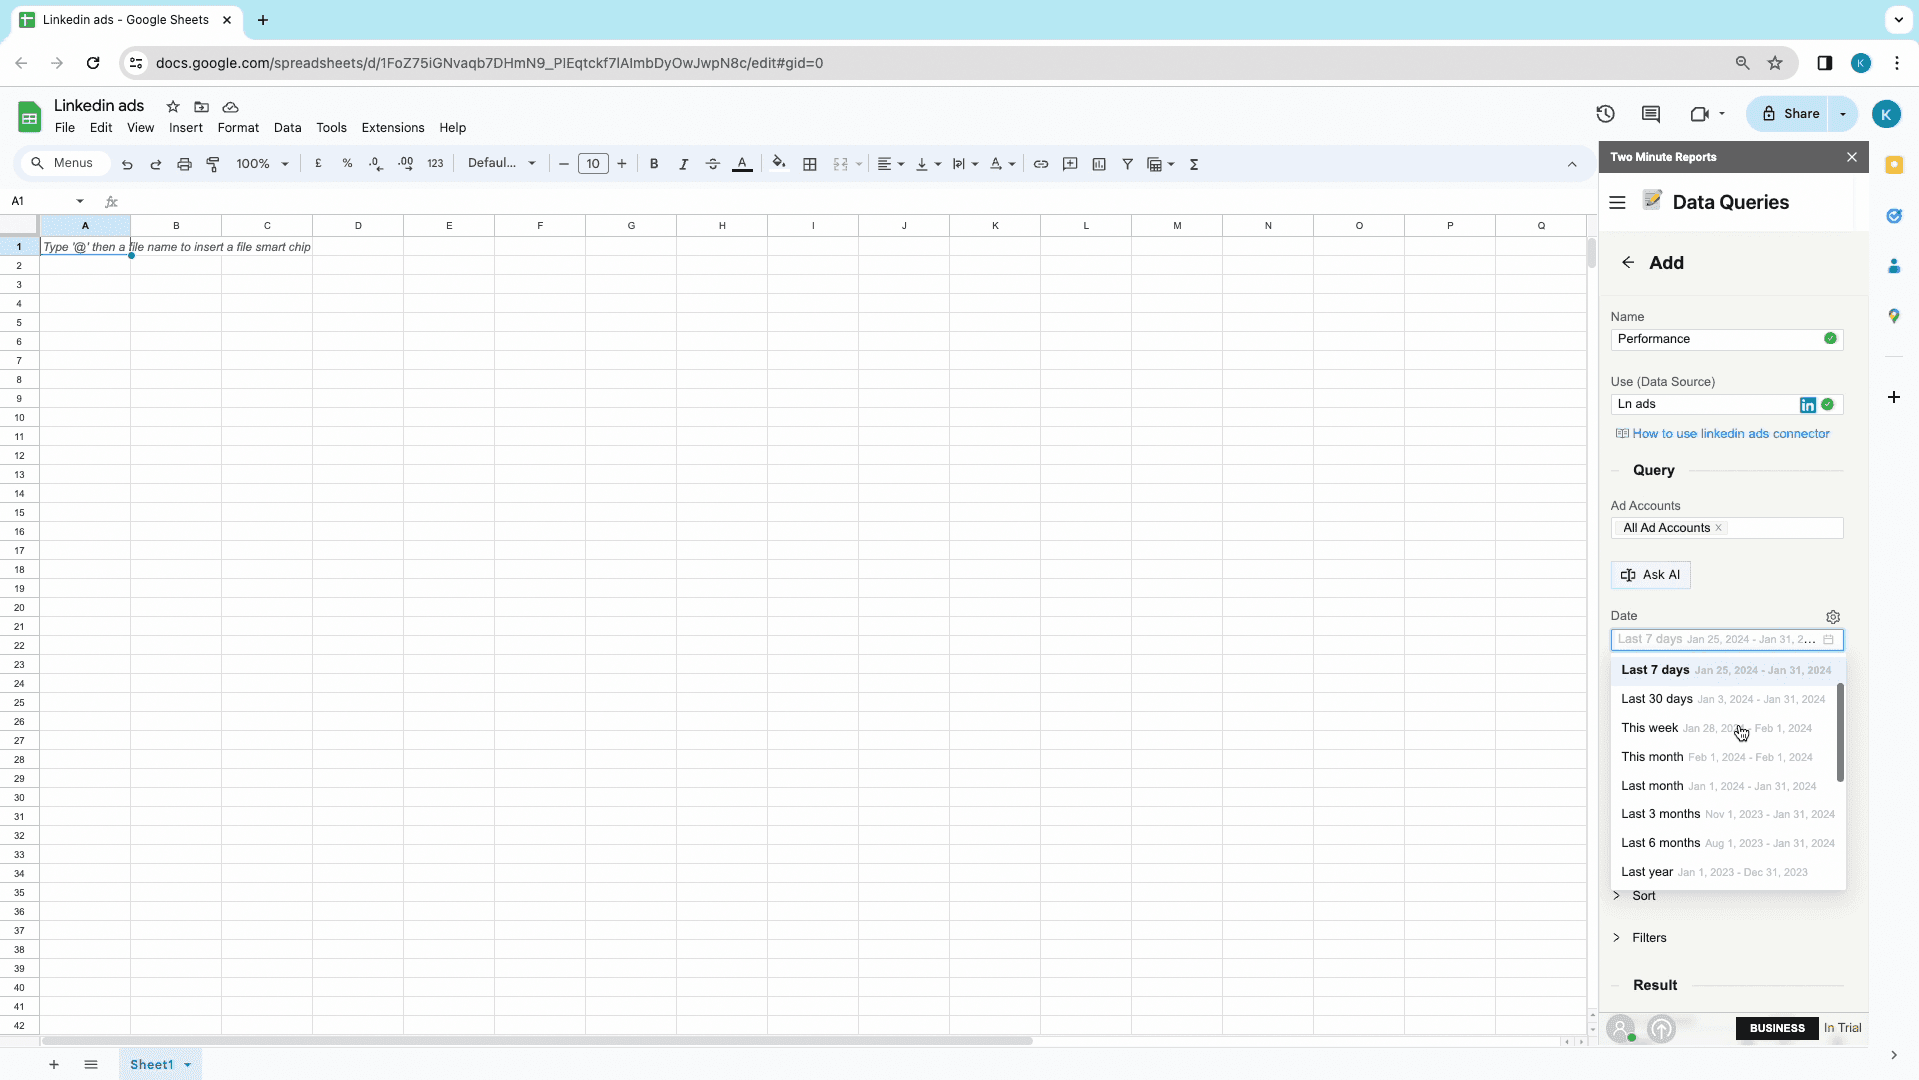
- Move on to the Data Query section and start naming your Query. Choose your newly created Data Source from the drop-down below. And while doing that, you can choose either single or multiple Ad accounts.
- You can start selecting your Date range. You will find a variety of date ranges available along with custom date ranges for you to choose from.
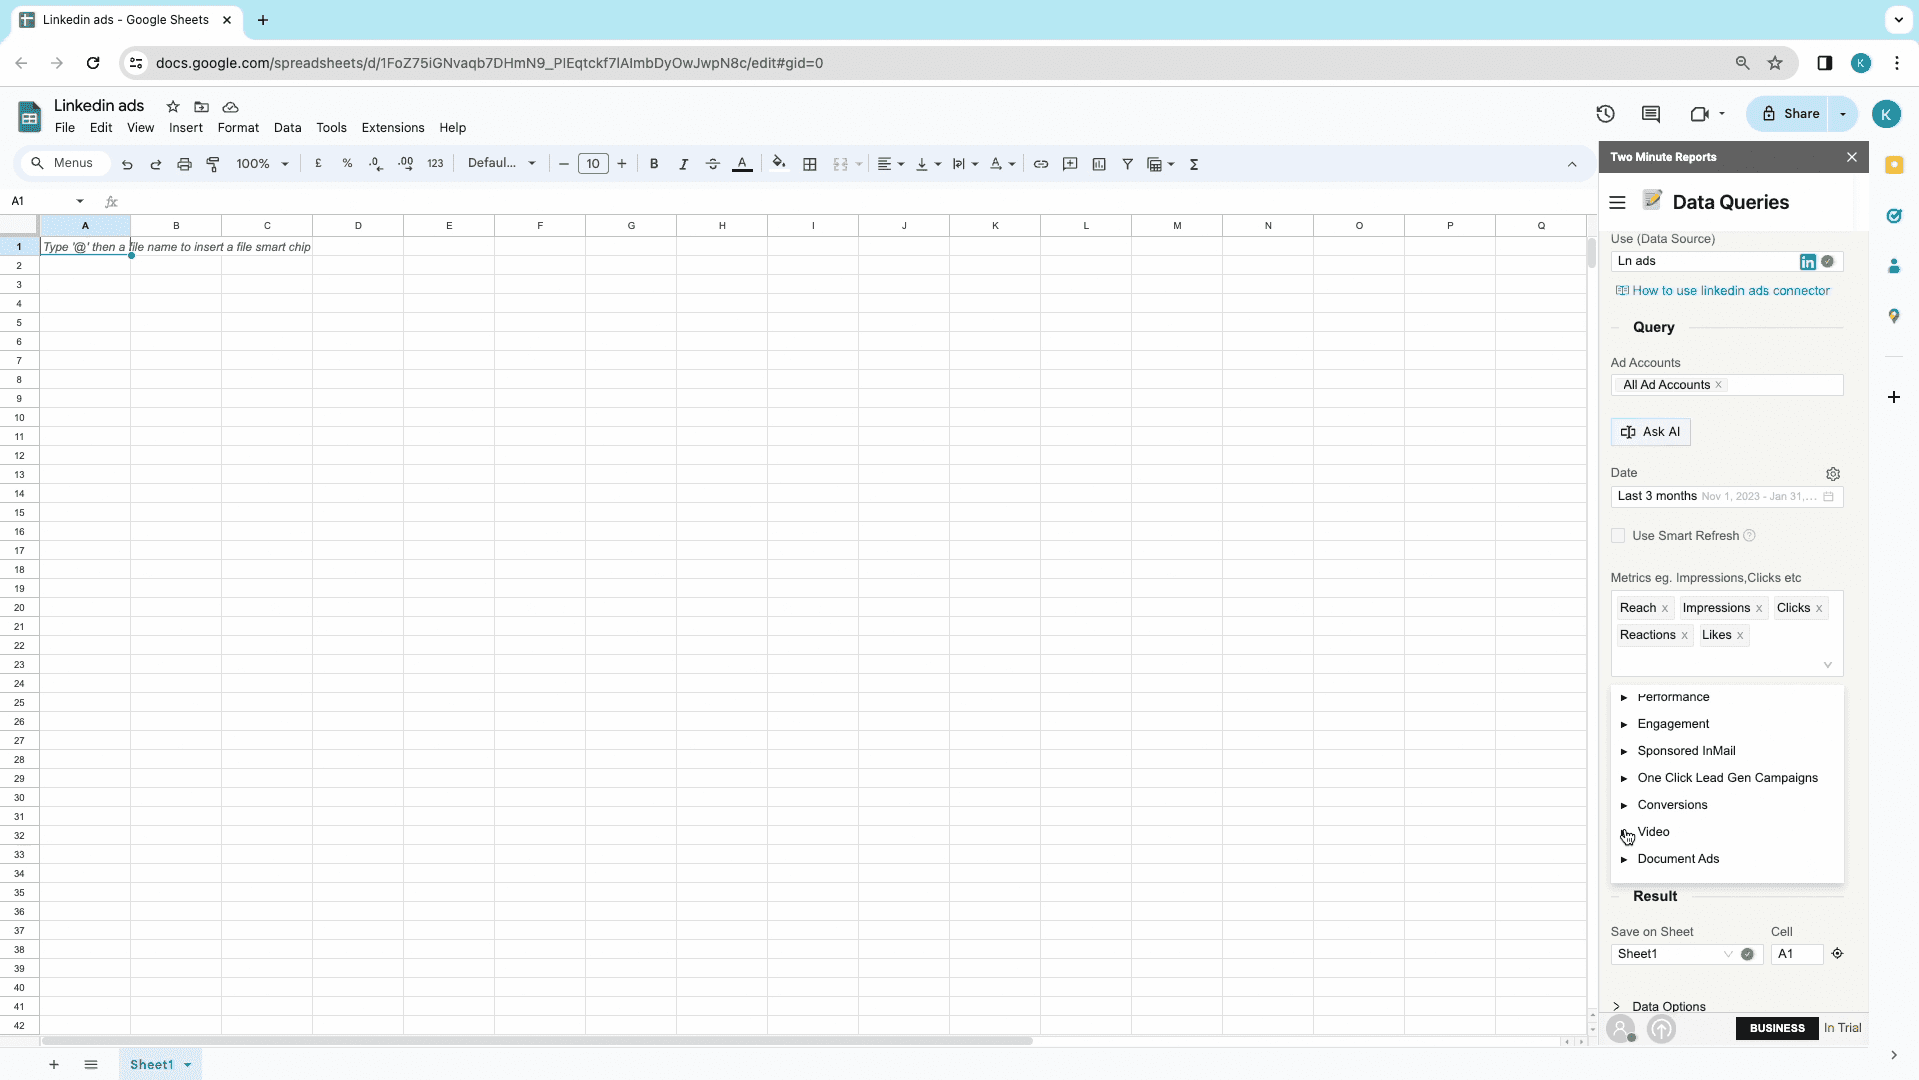
- Next choose metrics to get quantitative data like users, impressions, engagement, etc. These metrics further have various categories like performance, reach, clicks, frequency, and so on. Then you have engagement for which you will have reactions, likes, comments, shares, etc.
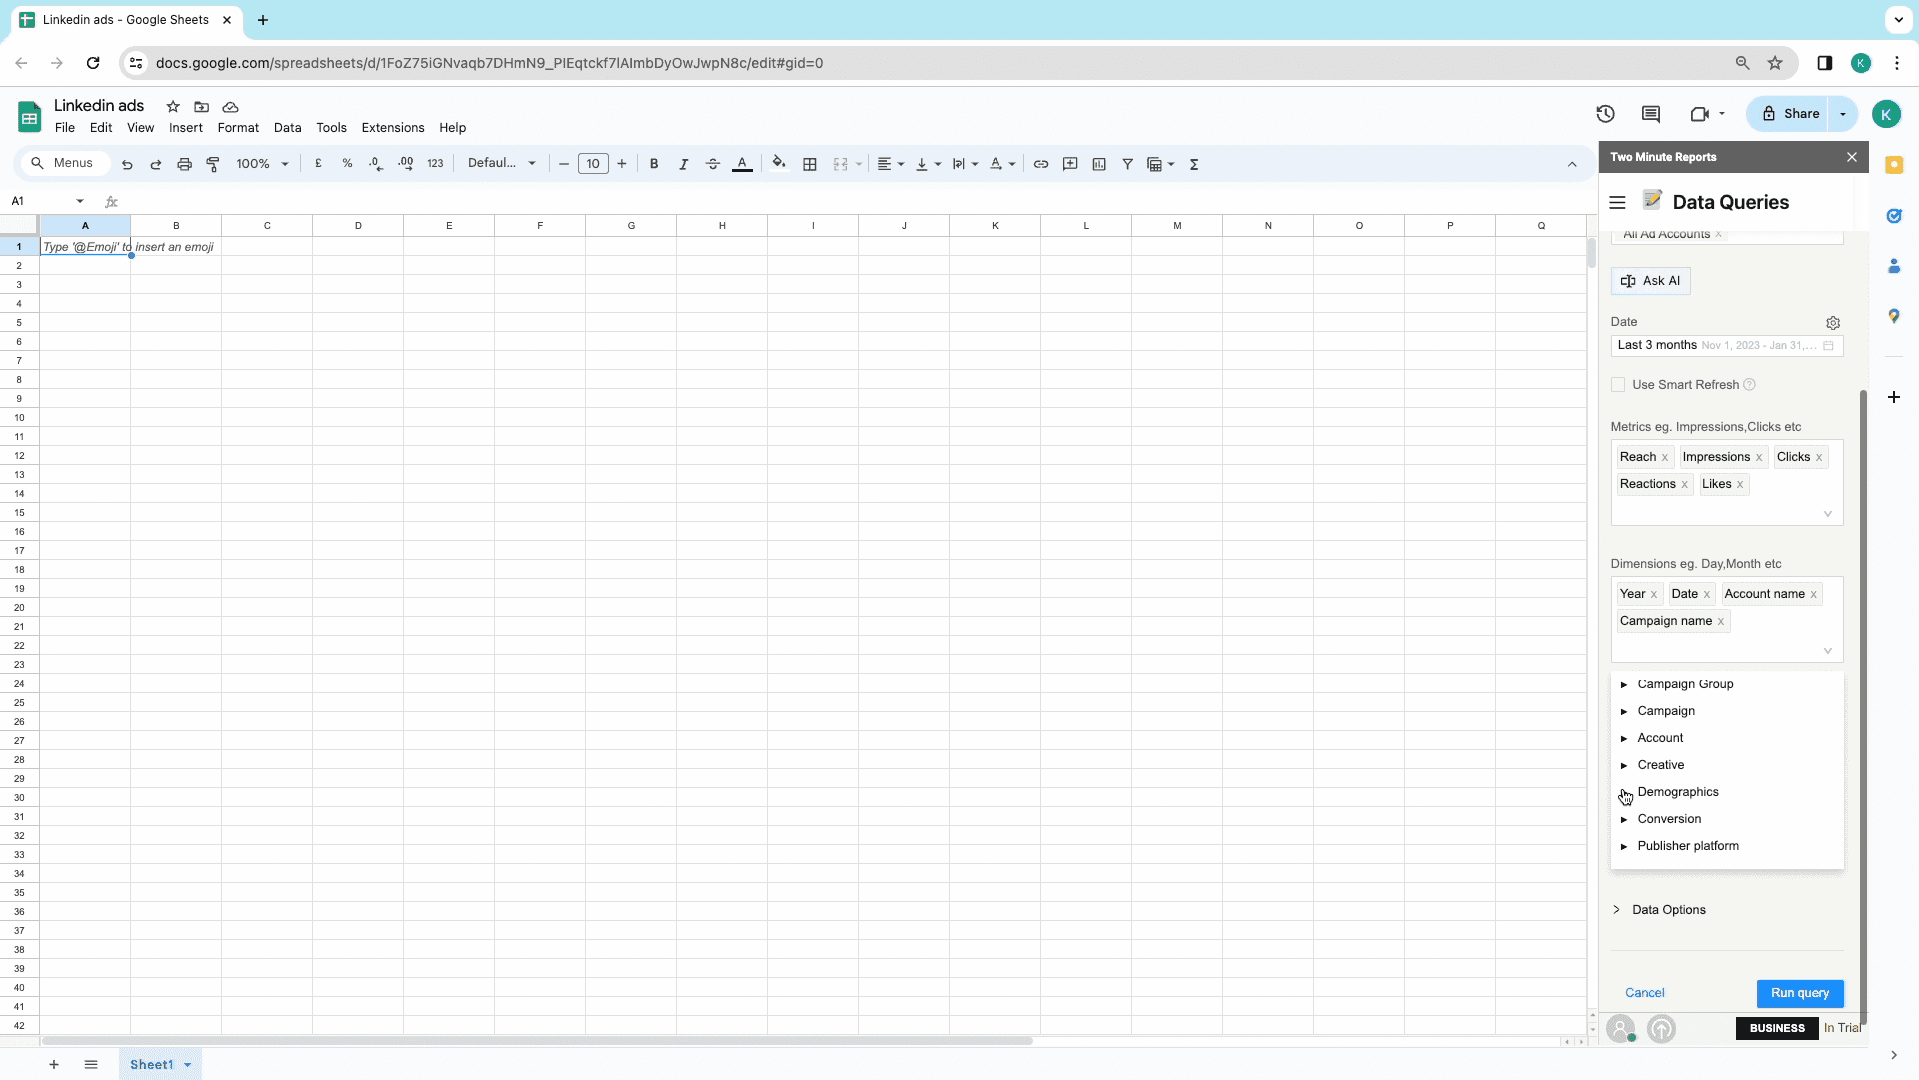
- Moving to the dimensions part, these are fields that help you aggregate your selected metrics, like time, which has year, months, days, etc. Further categories include campaigns, accounts, conversions, and more.
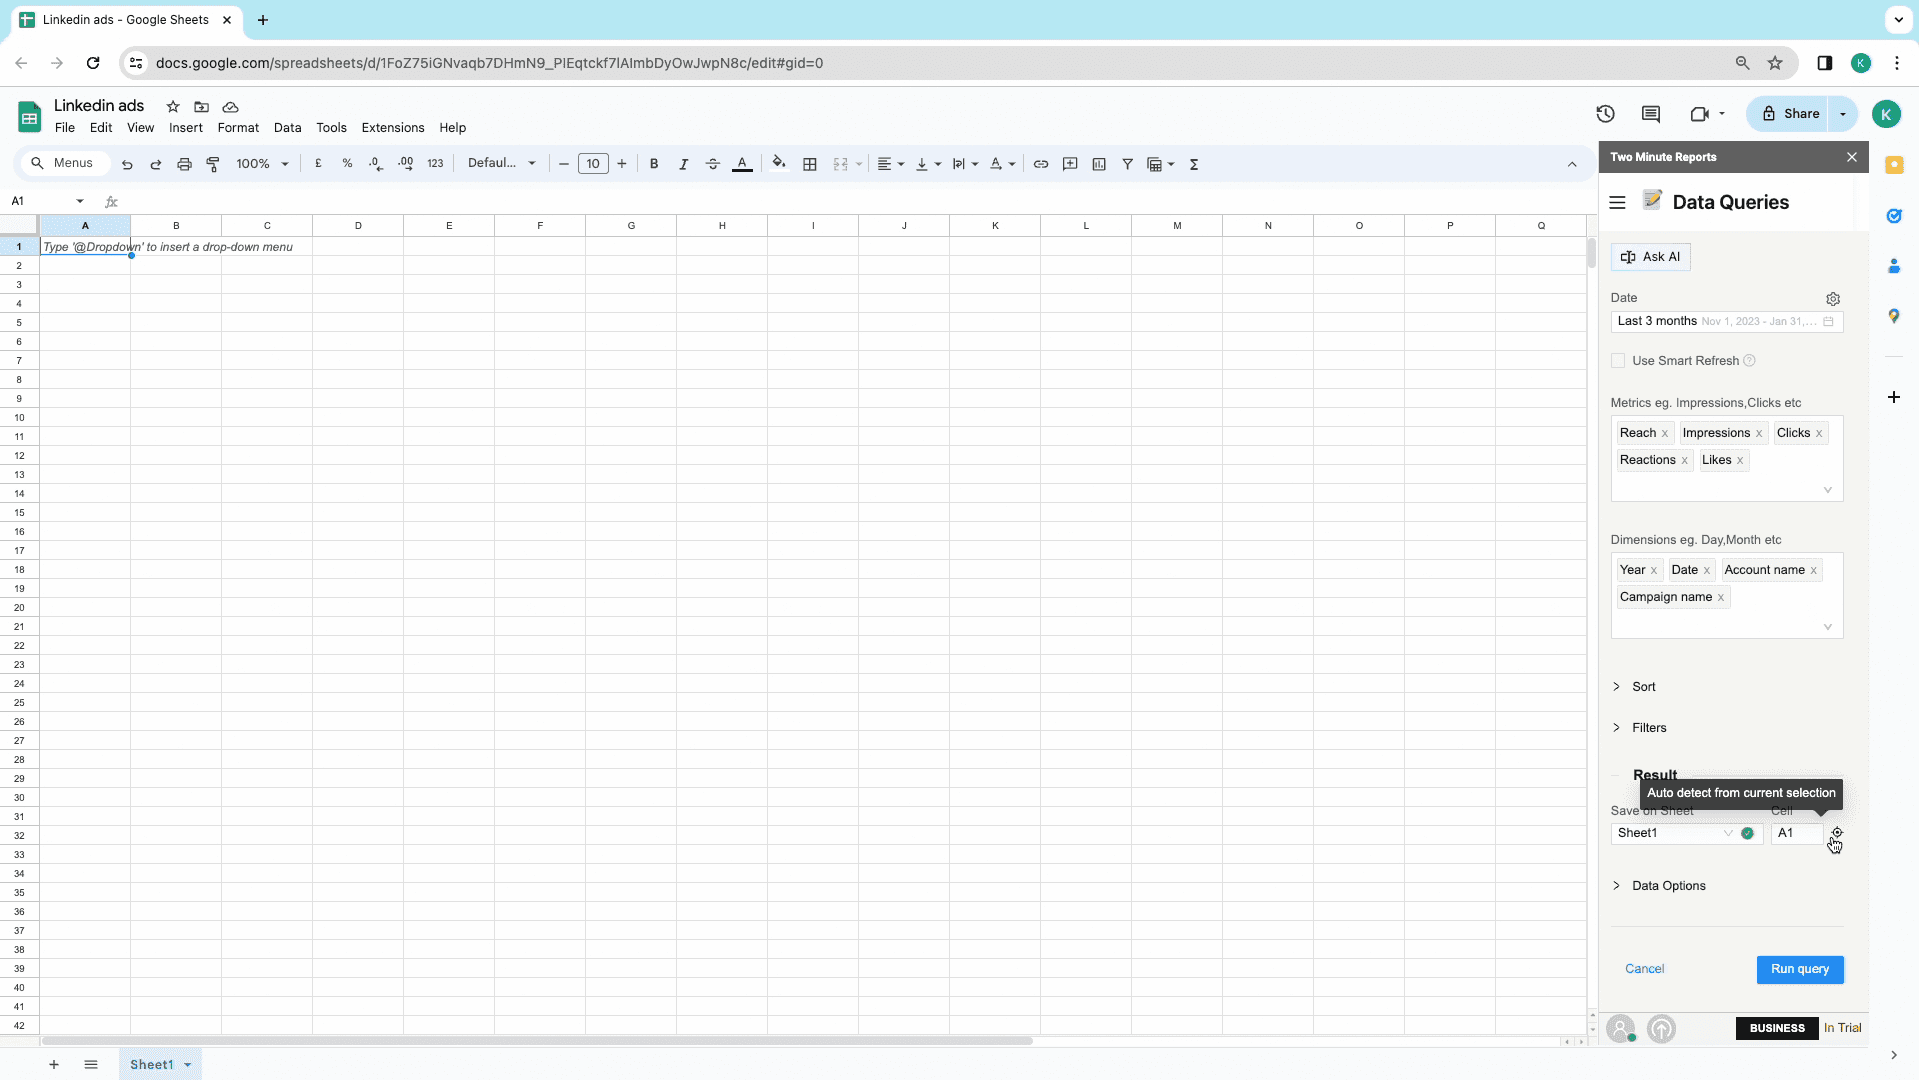
- Finally, you can select the exact cell location where your data must be written. Click on the pointer icon to mark the existing cell location.
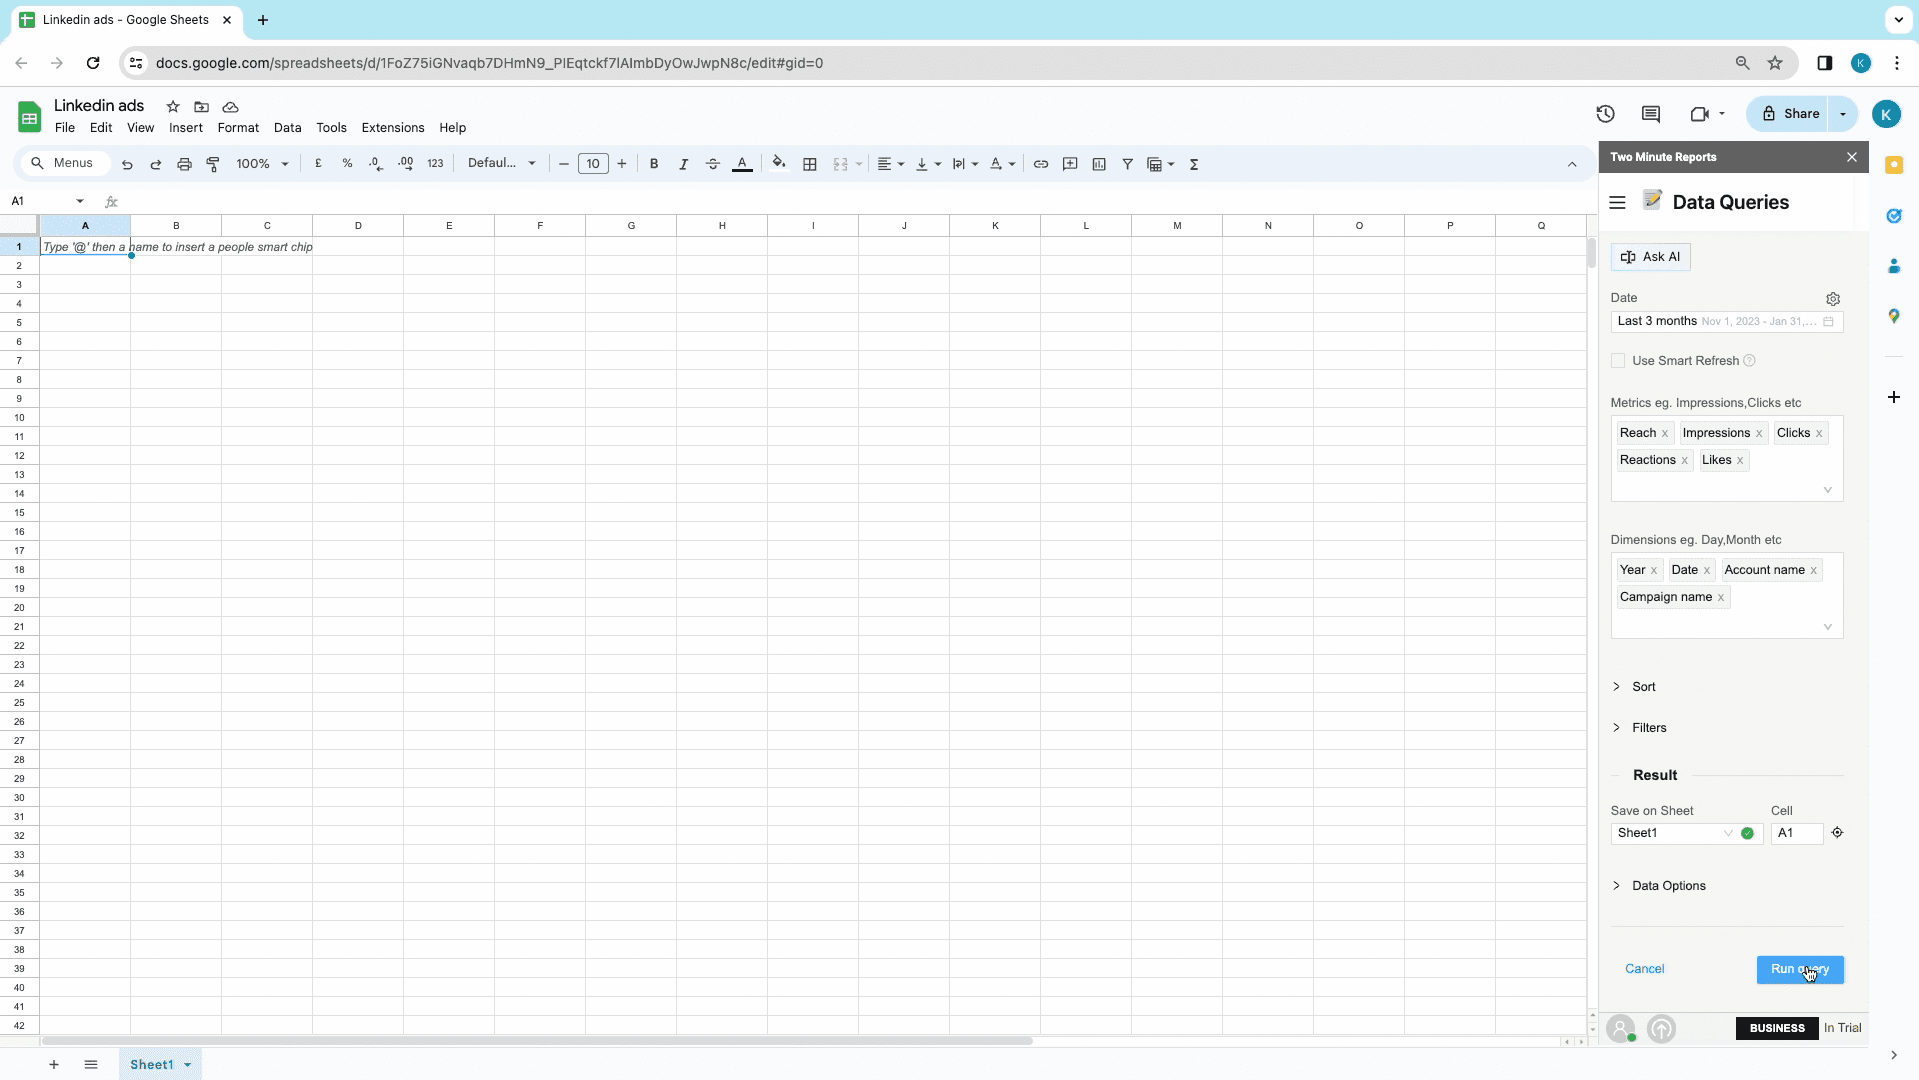
- Next, click on Run Query and have all your data written on sheets. Then click on Yes to save the query.
- To run the query again, choose the Play icon on the sidebar. Similarly for editing, click on Edit icon and bin icon to delete the query.
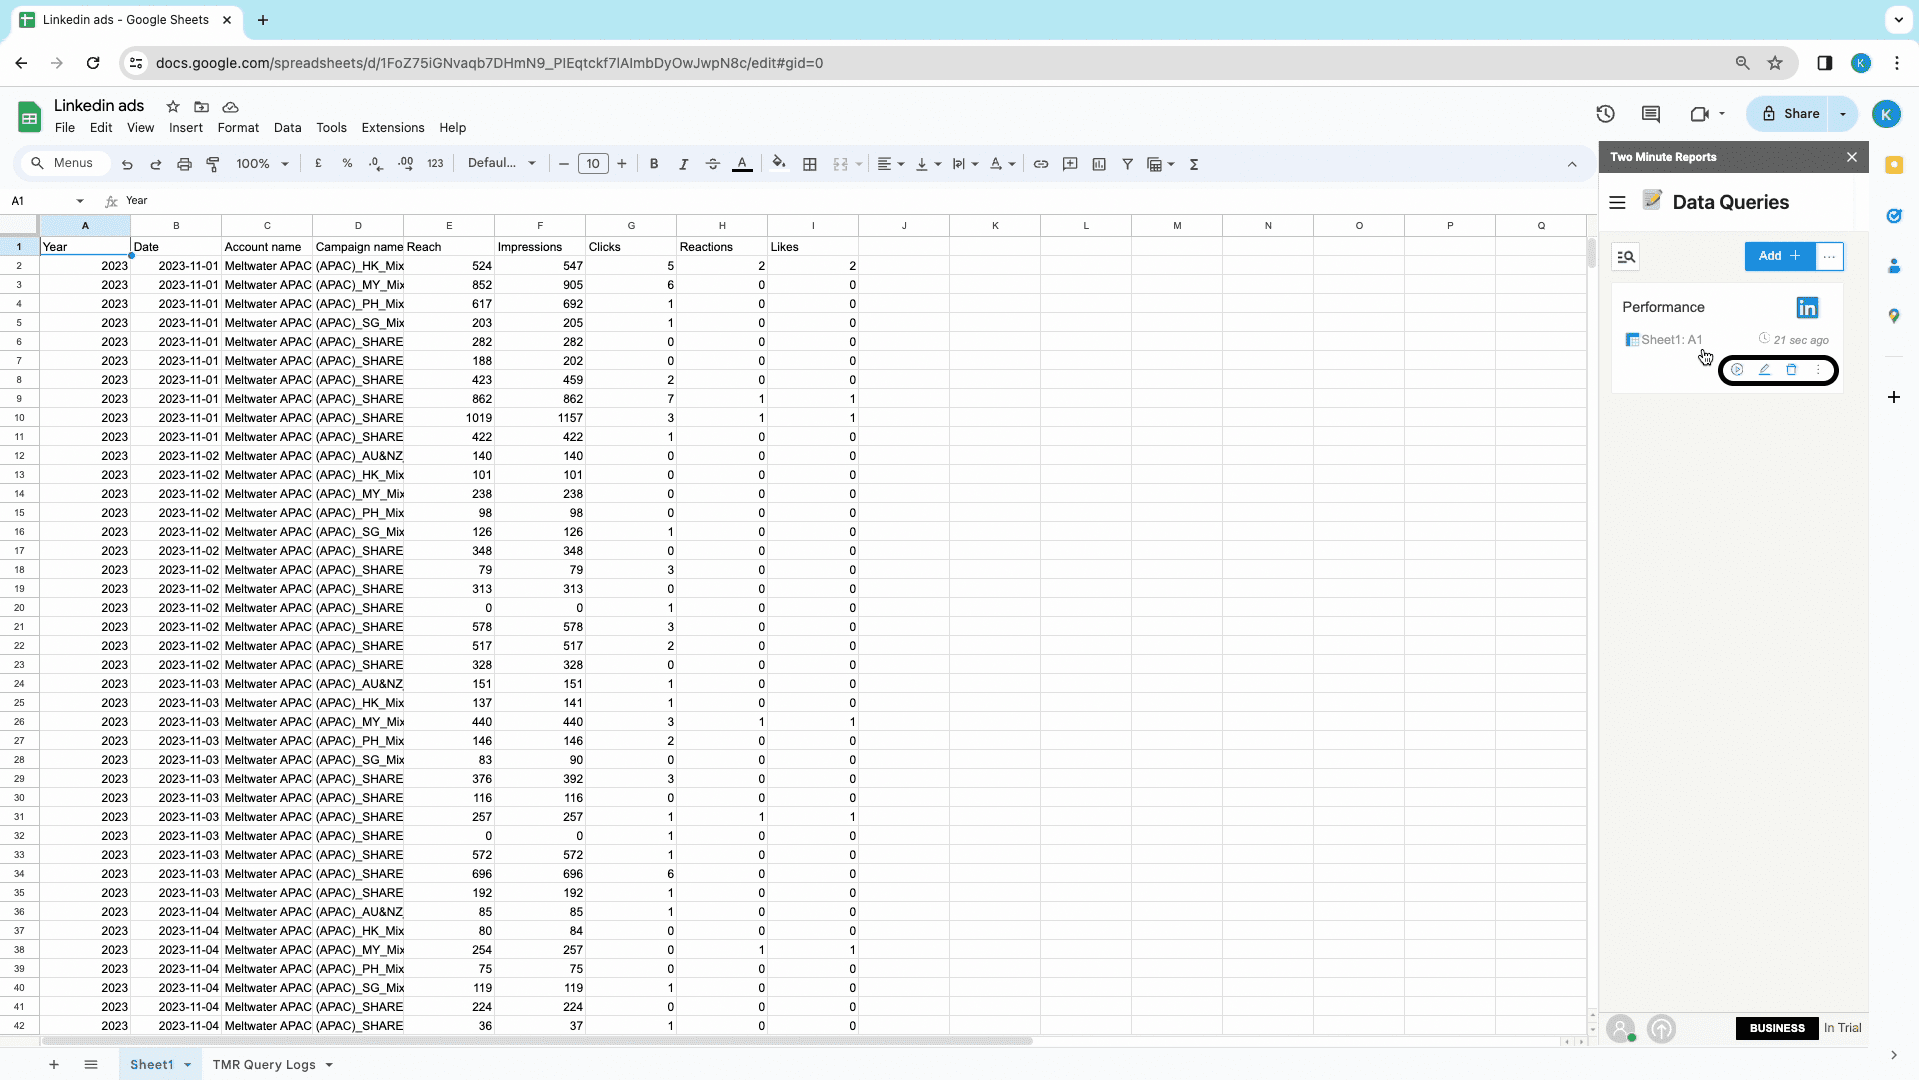
You will now see all your Queries saved in the Sidebar and desired data in the new Google sheet. And you are all ready to leverage data from your LinkedIn ads account from Google sheets.
Method 2: Get LinkedIn Ads to Google Sheets using Templates
- After installing the Two Minutes Reports add-on for Google Sheets, go to Templates on the Sidebar or select the same from the extensions.
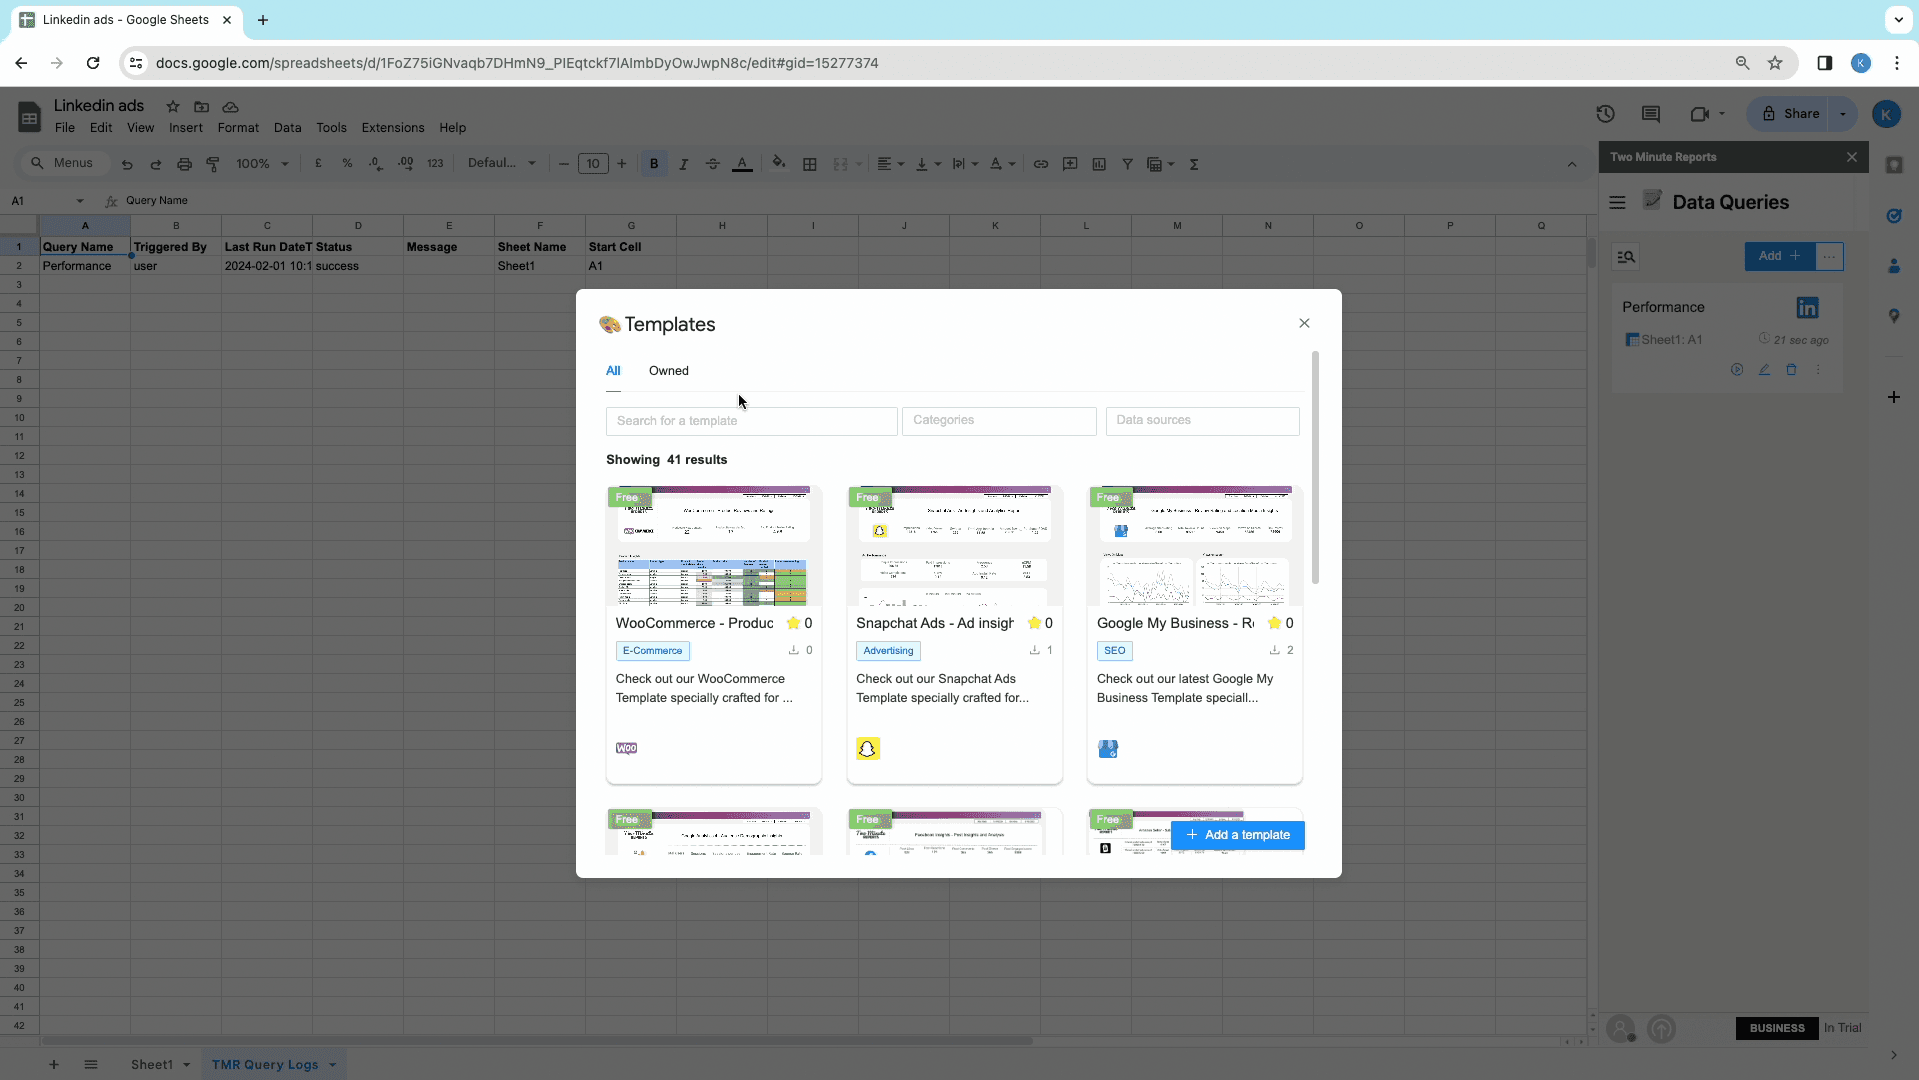
- Once the Template gallery is open, you can filter data source, categories and also search for templates.
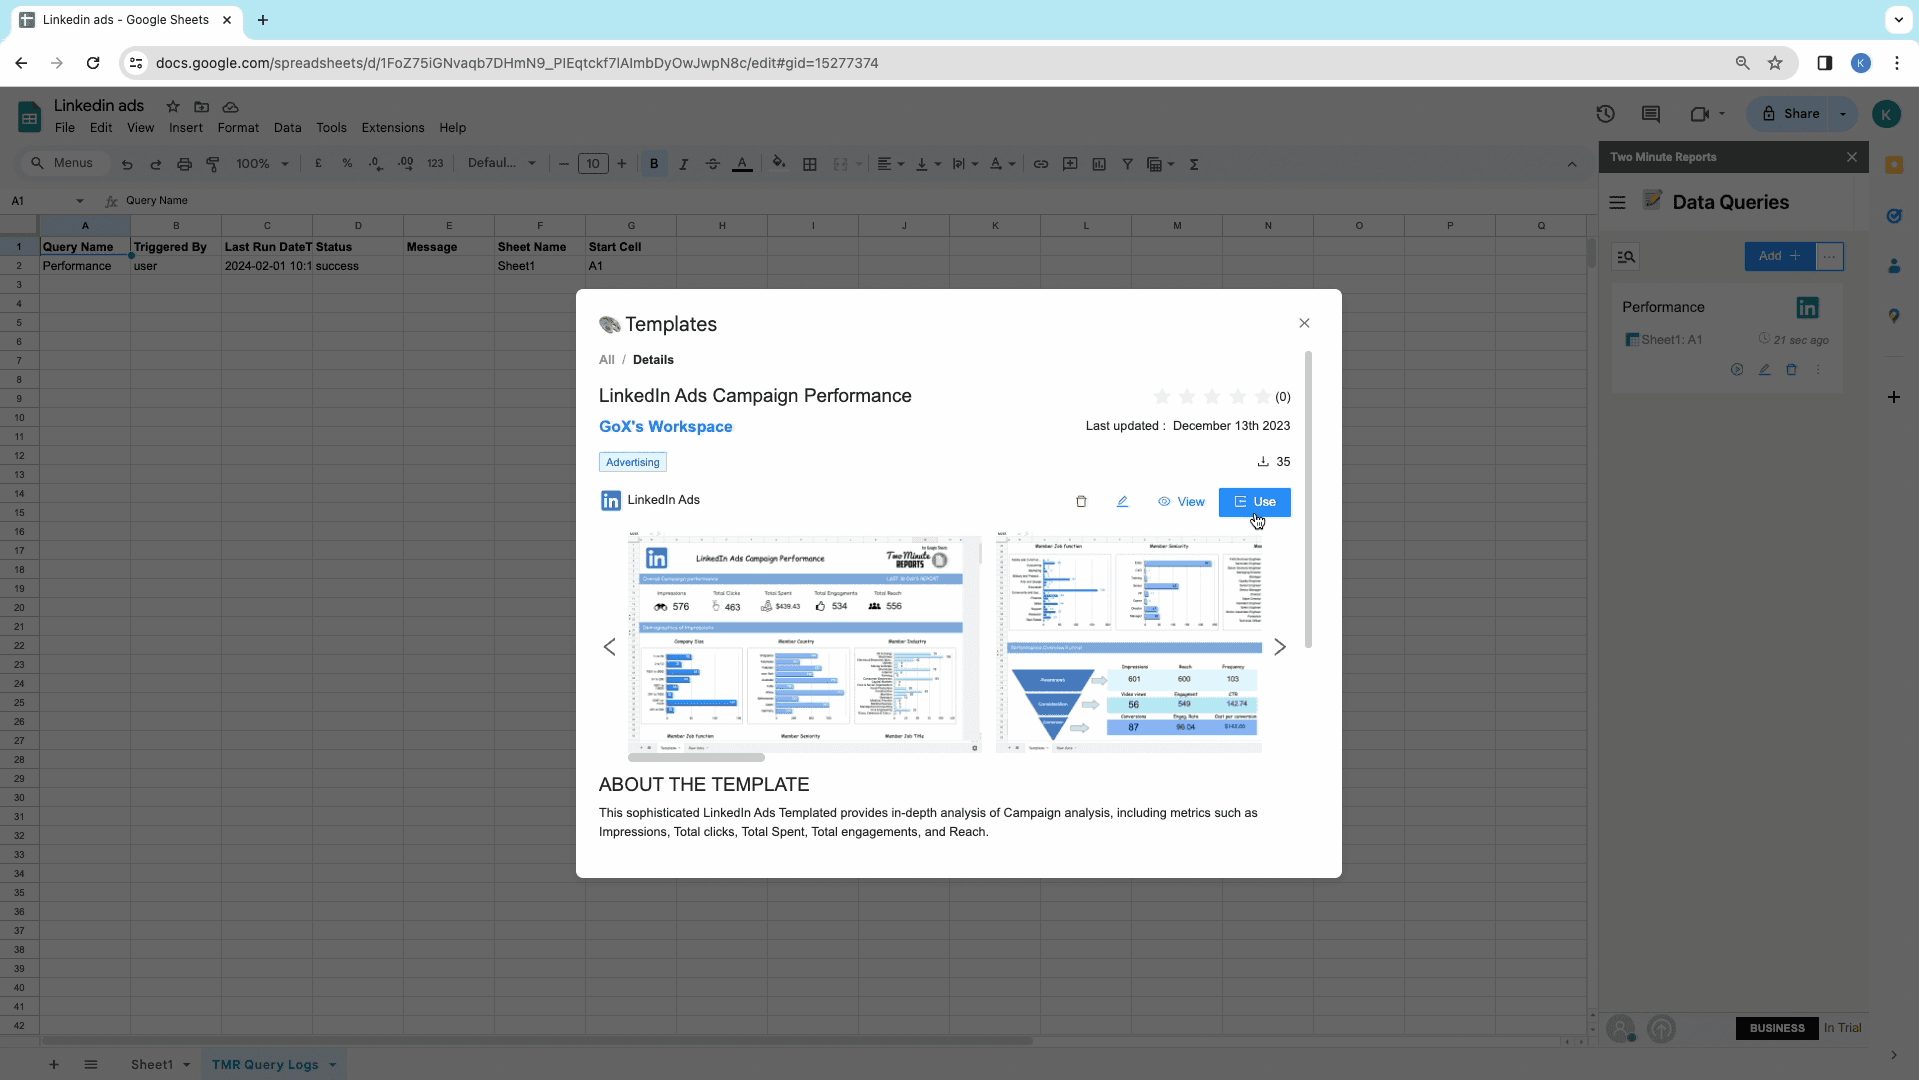
- Choose your desired Template and click on Use.
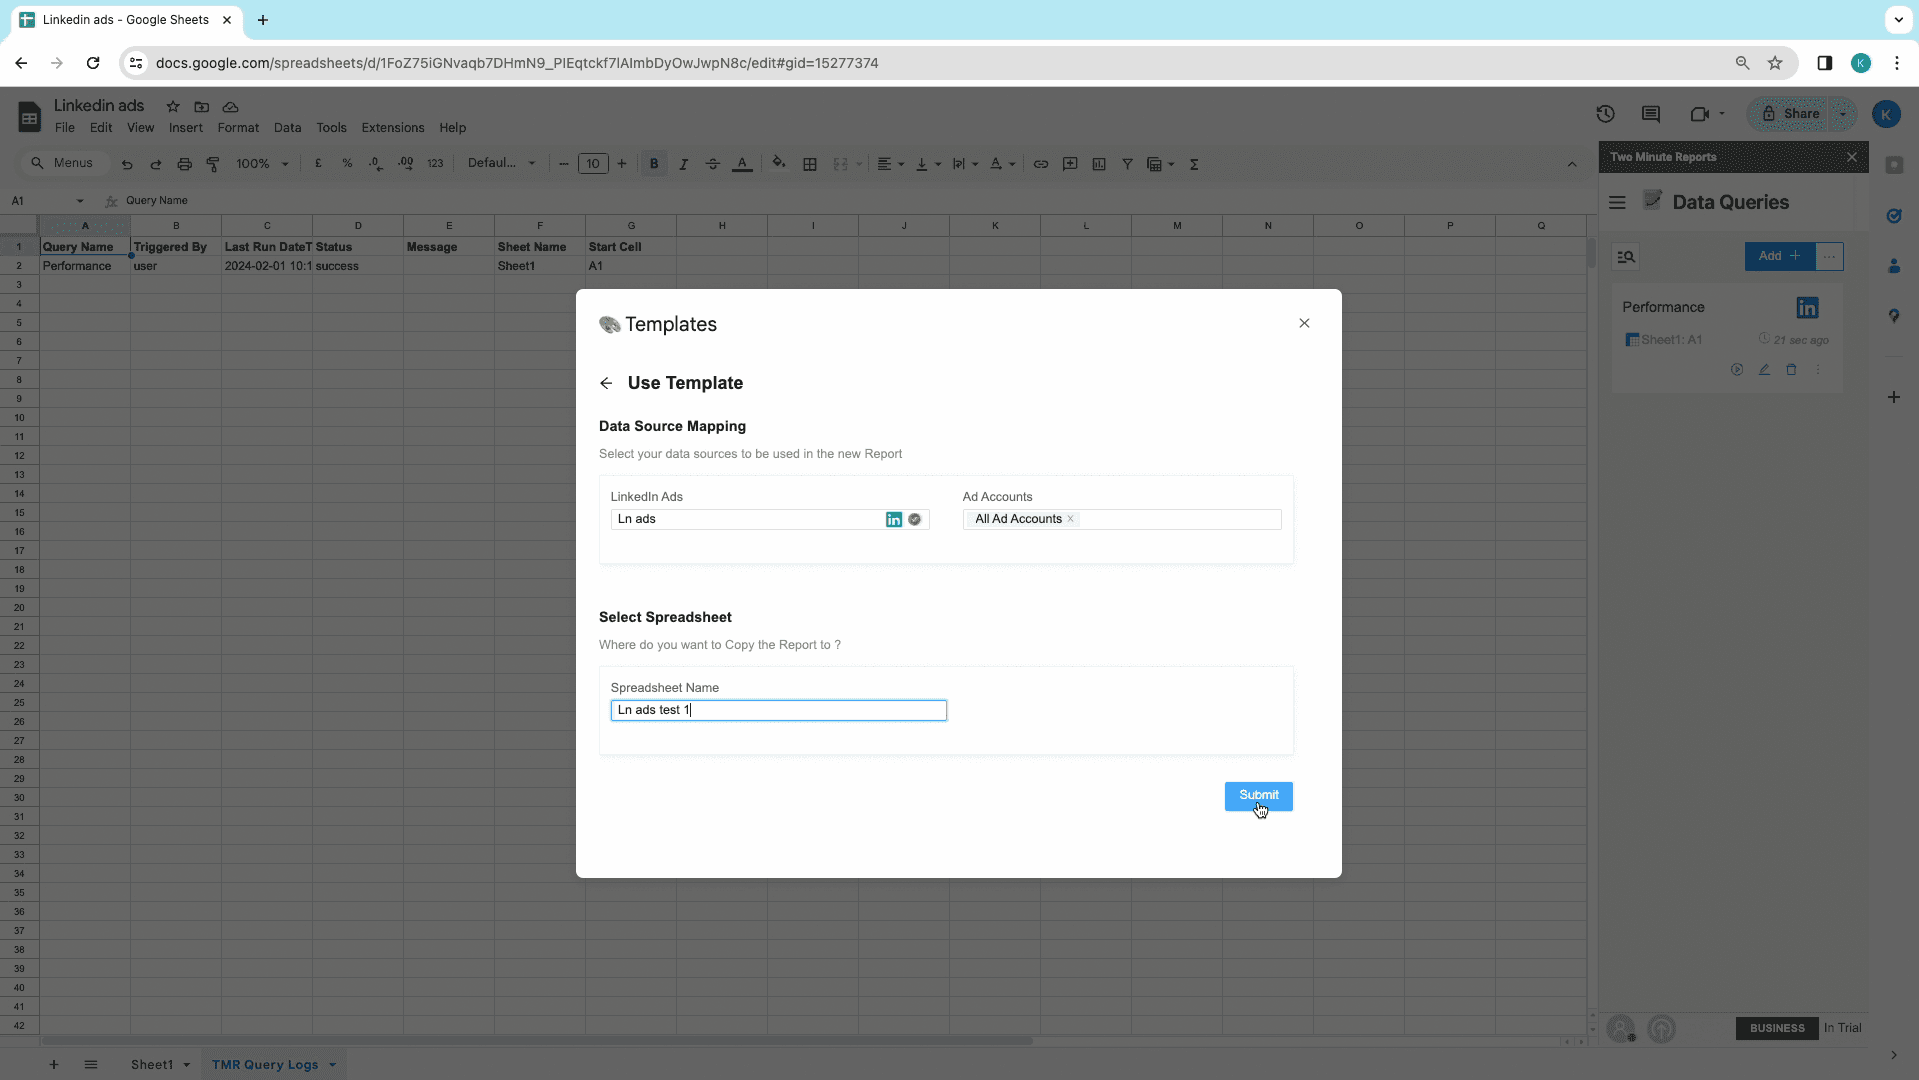
- Start mapping your data source by selecting the added data source or by creating a new one. Now select the ‘Add Account,’ which can be single or multiple, and name the spreadsheet to get the template copy and click on Submit.
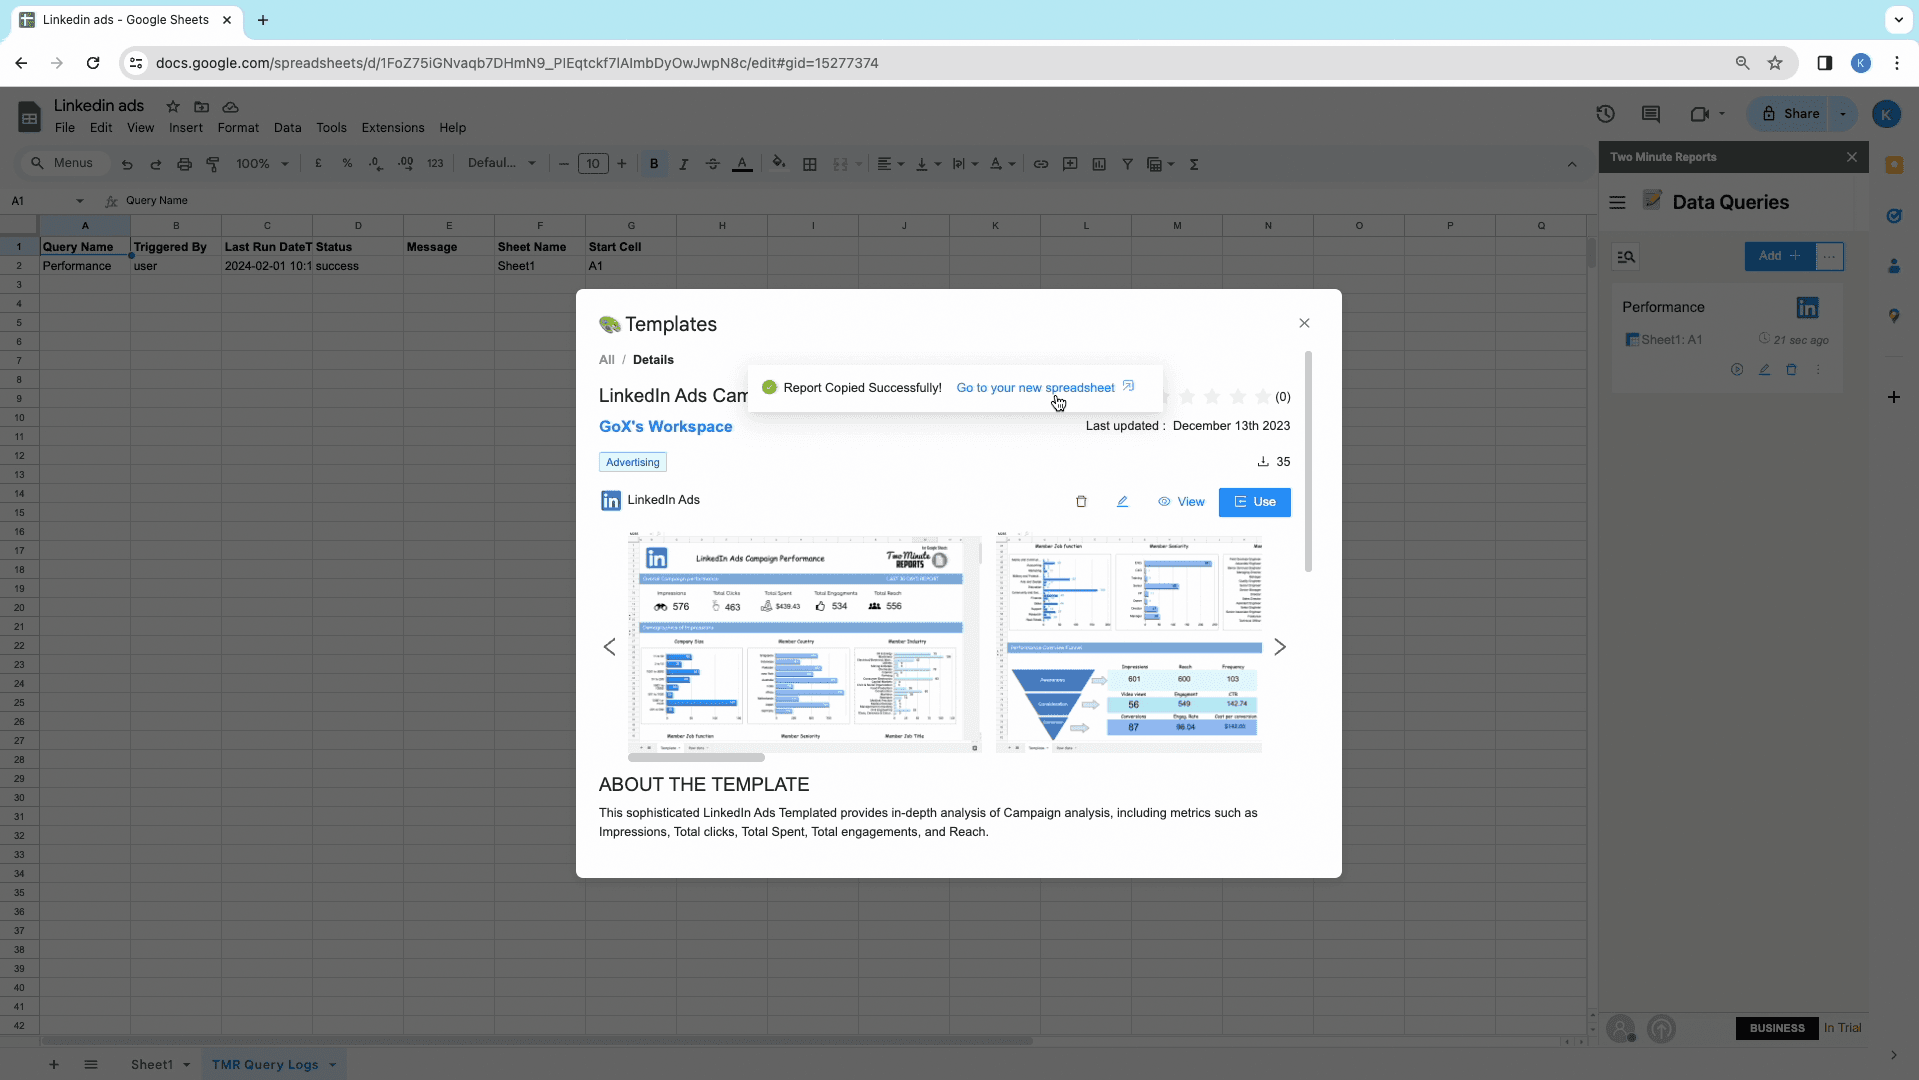
- Now, click on ‘Go to your spreadsheet,’ and watch the Template sheet open.
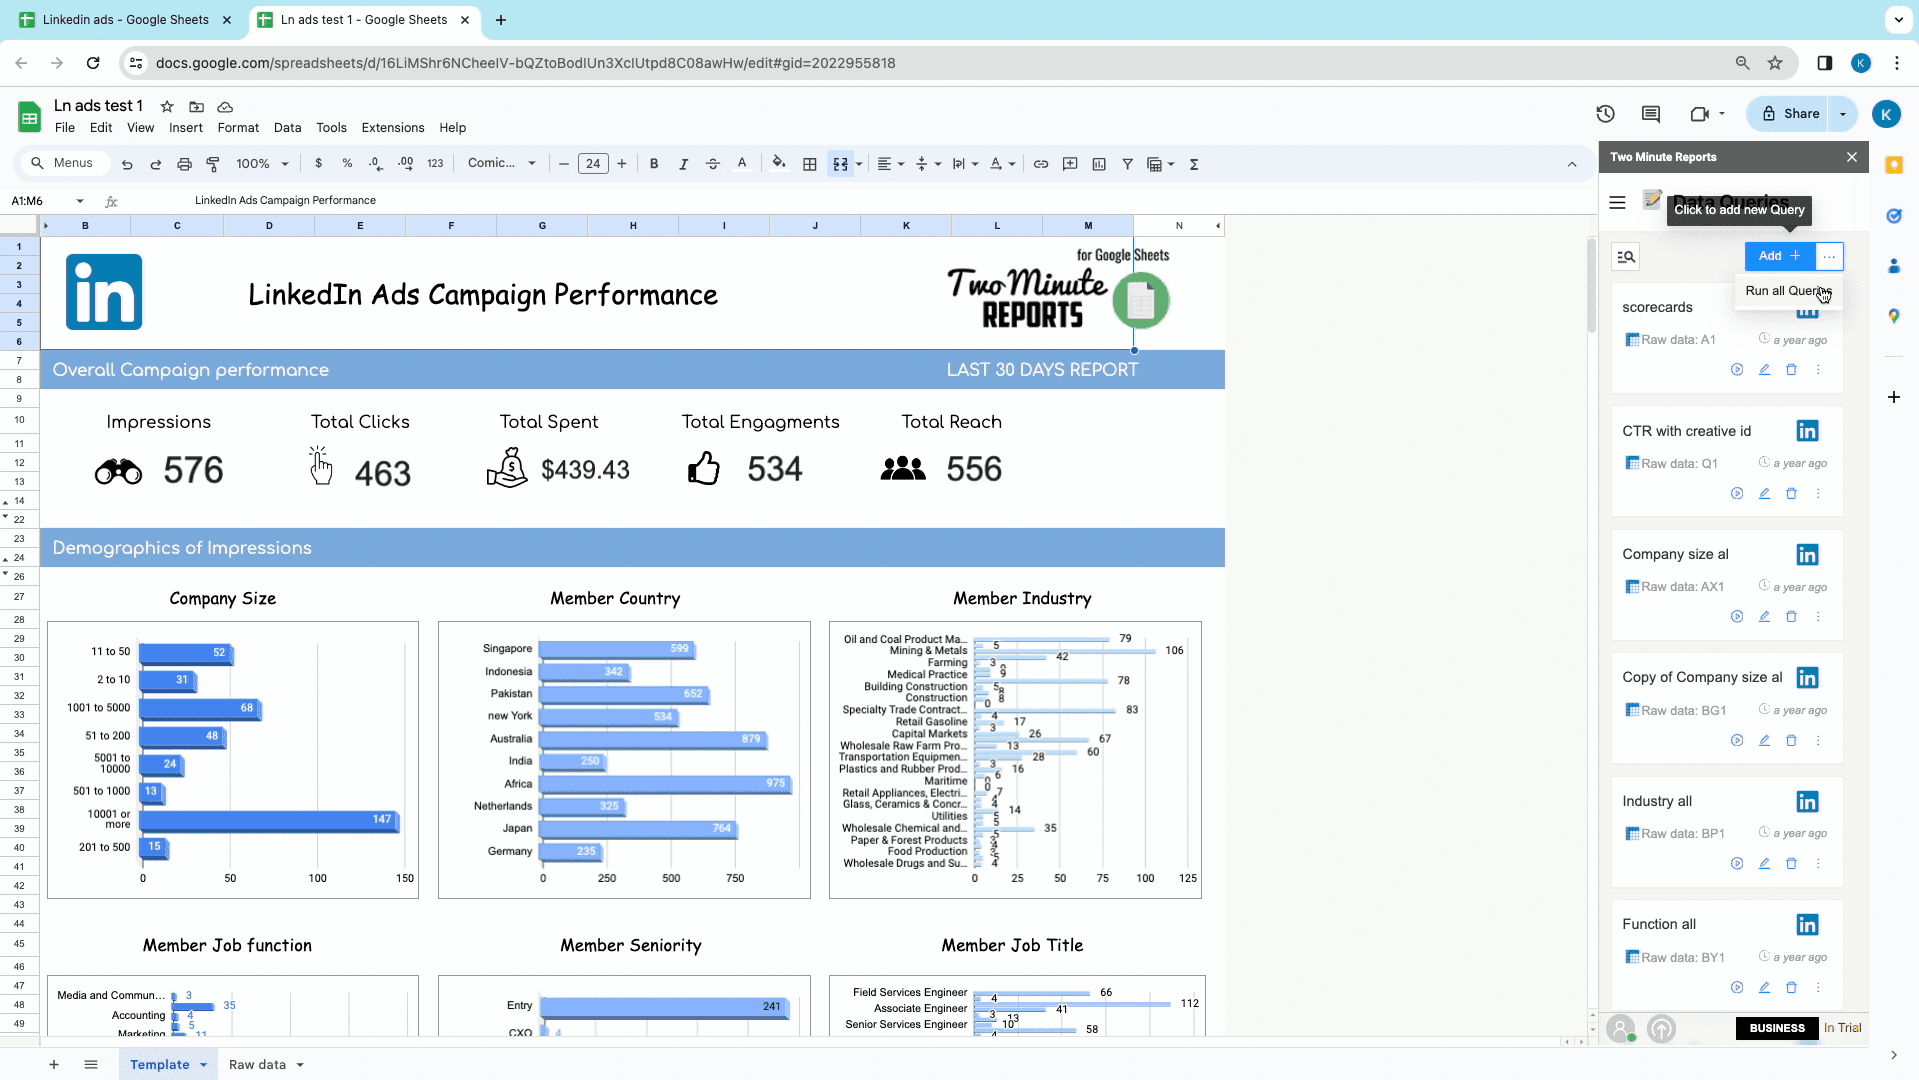
- Go to, Two Minute reports Extension and click on Launch. You will see the sidebar appear on the screen. Next, click on ‘Run all Queries’ from the sidebar and let the template update all your data throughout.
You are now all set to import LinkedIn Ads data on the Template save them.
Here’s our Bonus Feature To Automate Workflows, Reports and Templates For Your LinkedIn Ads
Try out our exciting and unique feature, Schedule Refresh which automates your Reports and Templates to refresh automatically at your desired date, time and duration with a copy sent to your mail. Click here to learn more about Schedule Refresh.
Start using these quick templates for google sheets now
1. Account Based marketing report for LinkedIn Ads
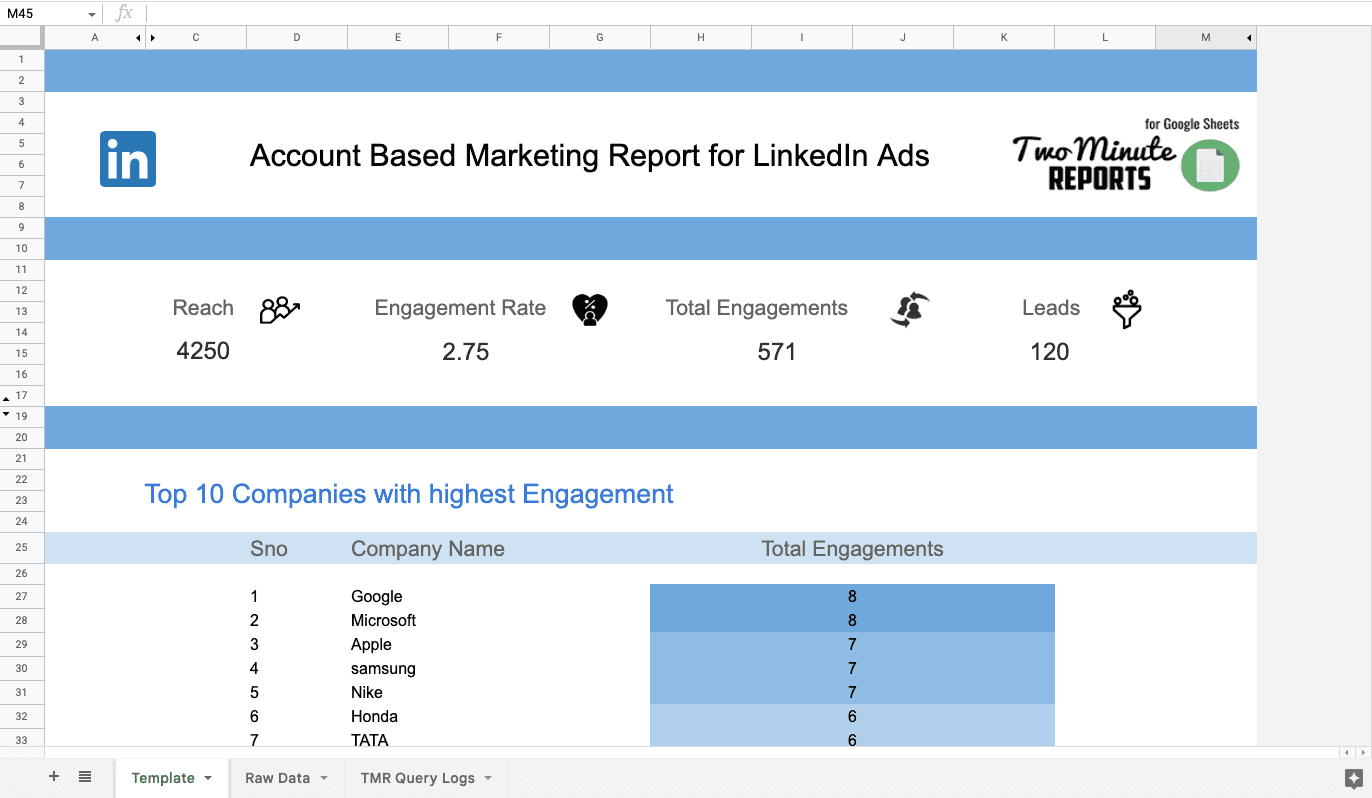
This is an Account Based Marketing Report that includes insights on the Top 10 Companies, such as Reach, Engagements, Engagement Rate, and Leads. Additionally, you will receive cumulative scorecards. This simple, single-paged report can assess your Account Performance in just 2 minutes! Why not click on the preview and see for yourself?
2. Comprehensive Insights for different LinkedIn Ad Types
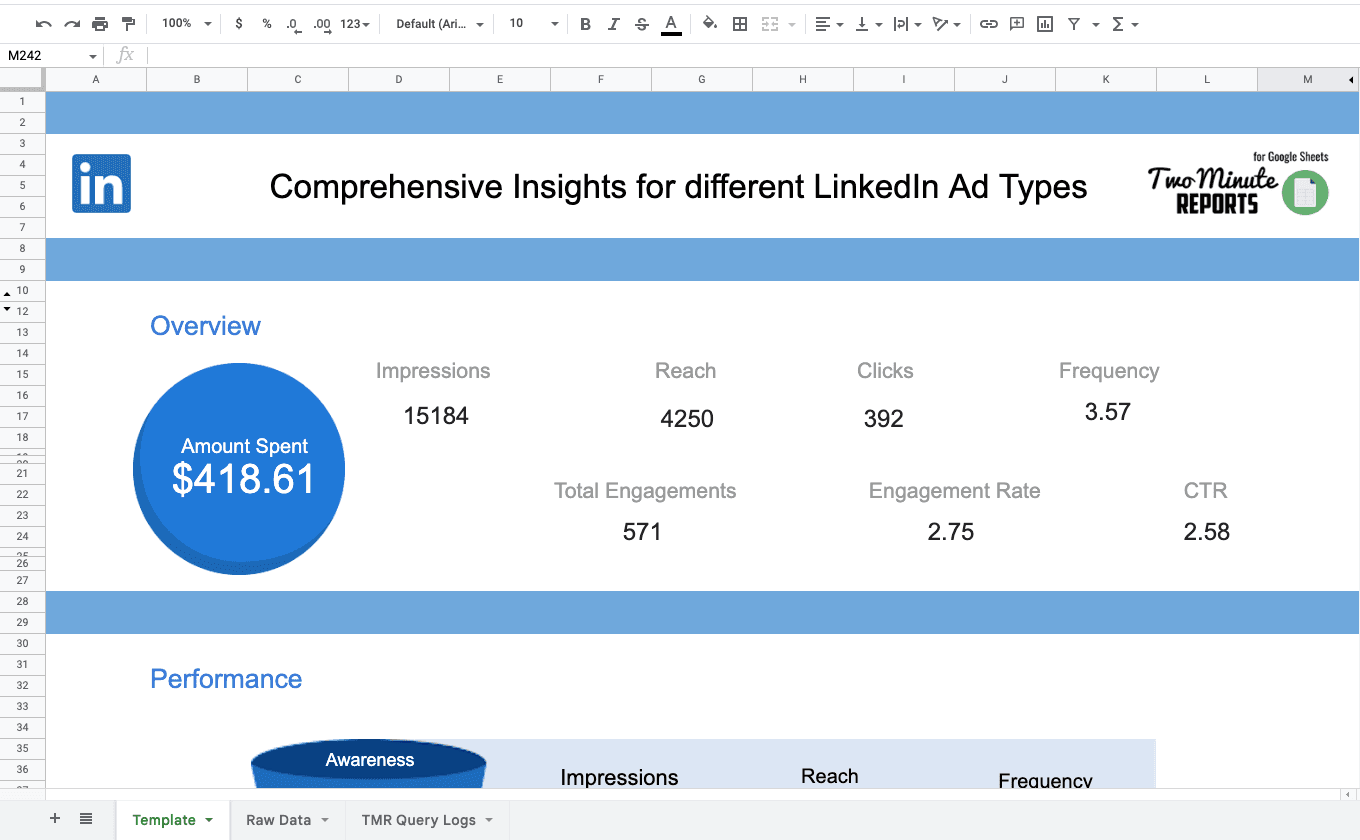
Check out our new LinkedIn Comprehensive Insights Template for different Ad types. This Report provides valuable KPIs and insights including Performance Overview Funnel, Top 5 and Bottom 5 performing Creatives, Video Demographics, and more. You will also find Funnel views of Sponsored Content Performance and detailed infographics of sponsored InMail. Finally, demographic data is provided for Impressions, Clicks, Engagements, Leads, Conversions, and Viral Impressions with respect to Company size, country, Industry, Job Function, Seniority, and Job title. Click on the preview button to start using this Template right away.
Why import LinkedIn Ads to your Google Sheets
Importing LinkedIn Ads to Google Sheets offers innumerable benefits. When users create automated workflow, they not only boost their LinkedIn ads performance and analytic prowess but enable a seamless link between their Google Sheets and LinkedIn Ads. You can tap into vast capabilities, enhancing companies’ marketing strategies. Here’s why you must import LinkedIn Ads to your Google sheets.
Navigate Marketing Success in Minutes
Experience the seamless interface of Two Minute Reports, crafted to best companies’ marketing needs. Generate and monitor your marketing campaigns swiftly and analyze conversions. It requires no extensive training or technical expertise, owing to easy to use capabilities.
Unleash Robust Reporting with Google Sheets
Our Two Minutes Report offers formidable functionalities along with secure infrastructure of Two Minute Reports. It strategically aligns with BI platforms developed through Google Sheets.
Top LinkedIn Ads KPIs to track in Google Sheets
Two Minute Reports gives you one of the finest data fields to fetch your PPC ad analytics from LinkedIn ads. Below are some of the most important KPIs used by our clients to build, high level analytics Report for LinkedIn Ads.
Performance
Analyze the effectiveness of your LinkedIn Ads by diving into key metrics including impressions, clicks, total spent, total engagements, CTR (Click-Through Rate), reach, CPC (Cost Per Click), CPM (Cost Per Mille), landing page clicks, and frequency and adding them to Google Sheets. Through meticulous monitoring of your campaigns, you can enhance operational efficiency and amplify Return on Investment (ROI). Generate insightful reports that offer actionable recommendations, optimizing your LinkedIn Ads strategy for sustained success.
| Title | Description |
| Impressions | This is the count of impressions for Direct Ads and Sponsored Updates and sends for InMails. |
| Clicks | The count of chargeable clicks. Despite not charging for clicks for CPM campaigns, this field still represents those clicks for which we would otherwise charge advertisers (for example, clicks to view the landing page or company page). |
| Total Spent | Cost in the account's local currency. |
| CTR | The percentage of times people saw your ad and performed a click |
Engagement
These metrics collectively enable the campaign managers to asses the effectiveness of their messaging, targeting strategies and enhance maximum audience engagement.
| Title | Description |
| Reactions | The count of positive reactions on Sponsored Updates which can capture, like, interest, praise, and other responses |
| Likes | The count of likes. Sponsored Updates only. |
| Follows | The count of follows. Sponsored Updates only. |
| Viral impressions | Viral impressions are those resulting from users sharing a sponsored update to their own network of connections. Viral impressions are not counted as regular impressions. Sponsored Updates only. |
Campaign
Connect your LinkedIn Ads to your Google Sheets to examine key details like campaign name, status, start and end time, objective type, campaign type, total and daily budget, and time of campaign creation from your LinkedIn Ads. These details offer valuable insights to gauge campaign success, allocate budgets wisely, enhance targeting objectives, and adjust bid prices effectively. Use these metrics to generate detailed and precise reports, contributing to the formulation of more efficient LinkedIn Ads strategies.
| Title | Description |
| Campaign objective type | Objective type of campaign. eg.WEBSITE_VISIT |
| Campaign cost type | Cost type, e.g. CPM |
| Campaign daily budget | Maximum amount to spend per day |
| Campaign unit cost | Amount to bid per click, impression, or other event depending on the pricing model |
One Click Lead Gen Campaigns
Boost your lead generation efforts with insights from LinkedIn Ads One-Click Lead Gen Campaigns. Keep tabs on leads, lead form opens, cost per lead, viral leads, completion rates, and viral lead form opens. Create detailed reports to enhance your LinkedIn Ads campaigns and elevate success rates.
Conversions
Examine the impact of your sponsored updates on users by analyzing engagement metrics by connecting LinkedIn Ads to your Google Sheets. Track viral impressions, comments, likes, follows, reactions, shares, and clicks to gauge how many people are interacting with your content. Leverage these insights to optimize upcoming LinkedIn Ads campaigns and enhance your Return on Investment (ROI).
| Title | Description |
| Conversions | The count of conversions indicated by pixel loads. |
| Post-click conversions | The count of post-click conversions indicated by pixel loads. |
| Cost per Conversion (CPC) | Total spent on your ads divided by total conversions |
| Return on ad spend (ROAS) | Revenue generated for ad spend (total conversion value divided by amount spent). |
Video
Analyze video views, completions, starts and percentage metrics such as 25%, 50% and 75% in LinkedIn Ads. Track users' behavior and the performance of the video ads. Add these insights to your Google Sheets and use it to improve LinkedIn ads content and increase engagement.
| Title | Description |
| Video views | A video ad playing for at least 2 continuous seconds 50% in-view, or a click on the CTA, whichever comes first. An interaction with the video (like going to fullscreen mode) does not count as a view. |
| Video starts | The count of video ads that were started by users. |
| Video 50% | The count of video ads that played through the midpoint of the video. This includes watches that skipped to this point if the serving location is ON_SITE. |
| Video completions | The count of video ads that played 97-100% of the video. This includes watches that skipped to this point if the serving location is ON_SITE. |
Demographics
Collect essential insights on LinkedIn Ads performance by analyzing engagement across member demographics, including job function, industry, country, seniority, company size, region, and name. These key details empower users to optimize ad targeting, enhance engagement strategies, and manage Cost Per Acquisitions (CPAs) in their reports. The ultimate goal is to improve overall strategy and Return on Investment (ROI).
| Title | Description |
| Company Name | Company name of LinkedIn members engaged with campaigns. |
| Industry | Industry of LinkedIn members engaged with campaigns |
| Job function | Job function of LinkedIn members engaged with campaigns.. |
| Country | Country of LinkedIn members engaged with campaigns. |
LinkedIn Ads Campaign Group
Organize your LinkedIn ads campaigns seamlessly using campaign groups. Effortlessly monitor the status, numerical ID, total budget, and start/end time of each campaign for efficient operations. Make the best use of campaign groups to systematically track costs and timelines, adjusting them based on performance data. Enhance your Return on Investment (ROI) by generating comprehensive reports on the metrics of campaign groups by adding LinkedIn Ads to your Google Sheets.
| Title | Description |
| Campaign group value | Unique numerical identifier for a campaign group. |
| Campaign group status | Status of the campaign group |
| Campaign group total budget | Maximun amount to spend across all associated campaigns and creatives for duration of campaign group. |
| Campaign group start date | Represents the inclusive date when to start running the associated campaigns under this campaign group. |
Creative
Identify LinkedIn ads creative names, IDs, titles, destination URLs, body texts, types, and statuses to closely monitor LinkedIn Ads campaign performance. Include a thorough analysis of direct sponsored content metrics by analyzing the info extracted from Google Sheets. Utilize these insights to refine future campaigns, generate comprehensive reports, and foster more effective engagement for your brand.
| Title | Description |
| Creative Id | Unique numerical identifier for the ad creative |
| Creative type | Type of the creative, e.g. TEXT_AD |
| Creative Post URL | Creative Post URL |
| Creative name | Name of the creative |
Get LinkedIn Ads data in other tools too

Two Minute Reports offers an intuitive solution for seamlessly integrating LinkedIn Ads data with Looker Studio (formerly Google Data Studio), enabling advanced data analysis and visualization. This integration allows you to get detailed reports and dashboards using LinkedIn Ads insights without the complexity of manual data entry.
Looker Studio's customization capabilities let users craft custom formulas and benefit from a user-friendly interface, making it easy to manage large datasets from multiple LinkedIn Ads accounts. This means, you can get LinkedIn Ads not just for Google Sheets but for any other integrated apps.
Moreover, the direct import of LinkedIn Ads data into Looker Studio sidesteps the need for downloading CSV files, streamlining the process of data manipulation and visualization. By connecting LinkedIn Ads metrics with Looker Studio, you can gain access to extensive formatting options and easy sharing of insights.
Additionally,it will help you get a comprehensive analysis by combining data from various sources, promoting efficient data management. With the ability to automate workflow and extract data automatically, the union of LinkedIn Ads with Looker Studio exemplifies a strategic approach to business intelligence, empowering users to derive the utmost value from their advertising efforts.
Connect other Platform Data Sources with Google Sheets
Facebook Ads
Social media ad platform for targeted audience reach.
Google Ads
Advertising platform for displaying ads on Google's search results pages.
Snapchat Ads
Social media advertising platform for Snapchat users.
Tiktok Ads
Advertisement data on the TikTok social media platform.
FAQs
How do I extract data from LinkedIn to Google Sheets?
You can use our Google Sheets add on Two Minute Reports to get Linkedin ads data in google sheets. Please go through the method 1 and method 2 mentioned in this article.
How do I integrate LinkedIn with Google Sheets?
Access LinkedIn ads data in Google Sheets effortlessly by using our Two Minute Reports Google Sheets add-on. Check the step-by-step instructions provided in method 1 and method 2 outlined in this article for seamless integration.
How can I extract data from LinkedIn for free?
Utilize our Google Sheets add-on, Two Minute Reports, to import LinkedIn ads data directly into your Google Sheets. Refer to the steps mentioned in method 1 and method 2 as detailed in this article.