PageSpeed matters. With a lightning-fast website, you can rank higher than the competitors in google. Google makes it clear that page speed of a website is an important page rank criteria. So, a faster website will give your website a better ranking and therefore, more user traffic.
PageSpeed encompasses a number of factors that affect the overall web user experience. These include core web vitals like First Input Delay, Cumulative Layout Shift, Largest Meaningful Paint among other metrics. Understanding these metrics can help you improve and monitor any anomalies in your website.
If you own a number of websites or manage 1000s of important URLs the simple PageSpeed Insights Tool would not cut it for you. Entering each url one by one and keeping track of all the PageSpeed metrics regularly, can easily go out of hand.
Without writing a single line of code you can automate PageSpeed insights reporting for multiple URLs for FREE using Two Minute Reports. All this with the convenience of owning everything within Google Sheets. Keeping your SEO data within Google Sheets makes it easier to track over a long period of time and share with someone when needed.
Lets see how to quickly capture PageSpeed metrics for 1000s of URLs inside your Google Sheets below.
Step 1 : Get your free API key and enable Google services
First, we need to enable PageSpeed services and get API key from Google. Using these API keys you can get PageSpeed metrics for up to 25,000 times a day. If you already have an API key you can skip this step.
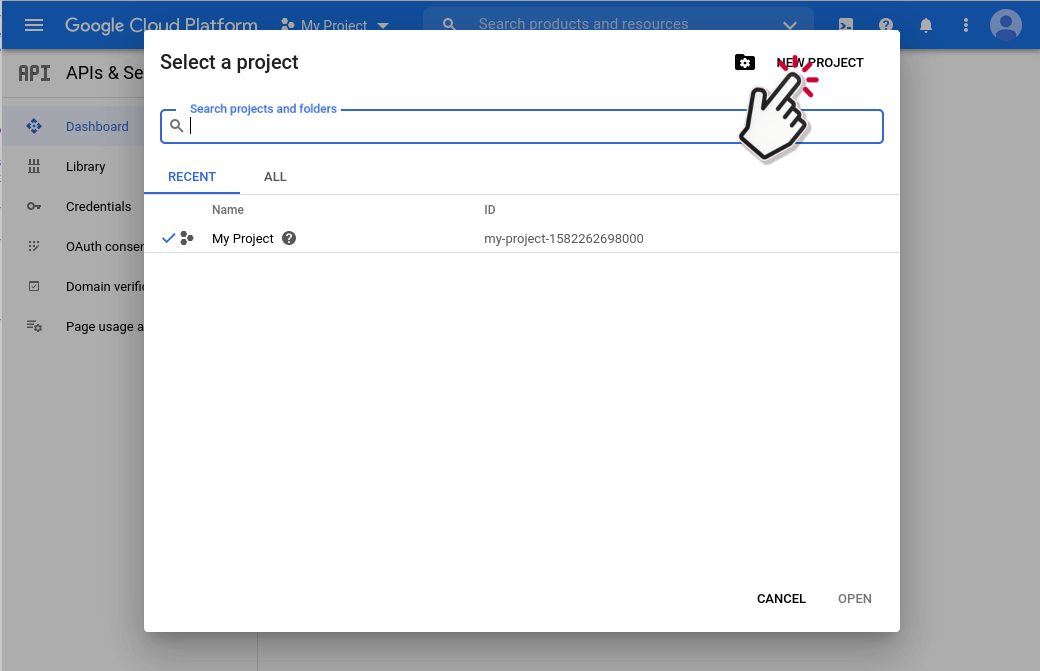
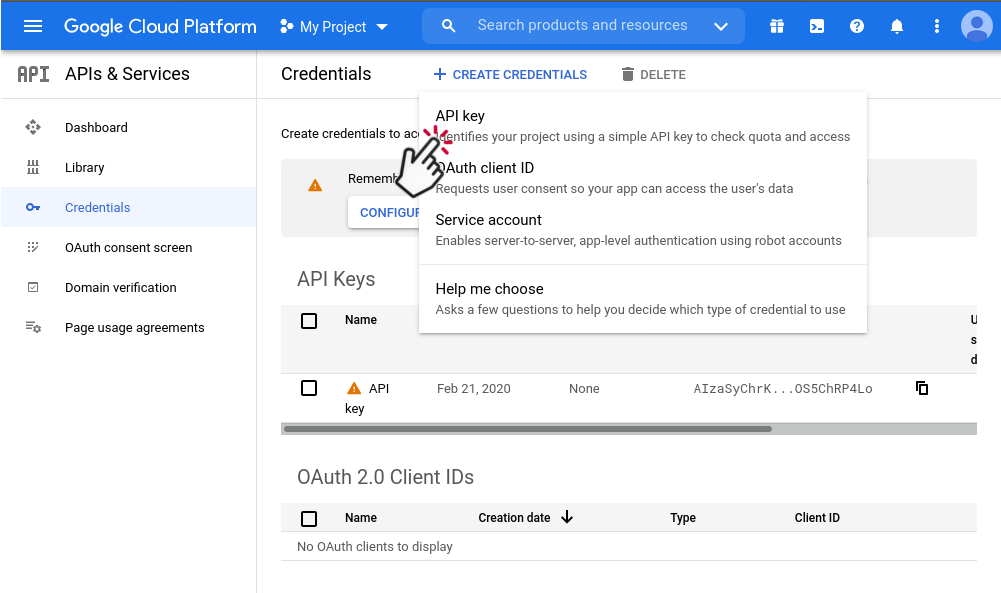
- Click on “My Project” and select an existing project or create a new google project. Then go to Credentials section and create a new API key.

PageSpeed Insights API enables you to scan your URLs on demand and get metrics in realtime. It also provides more than 20 sophisticated metrics about the URL.
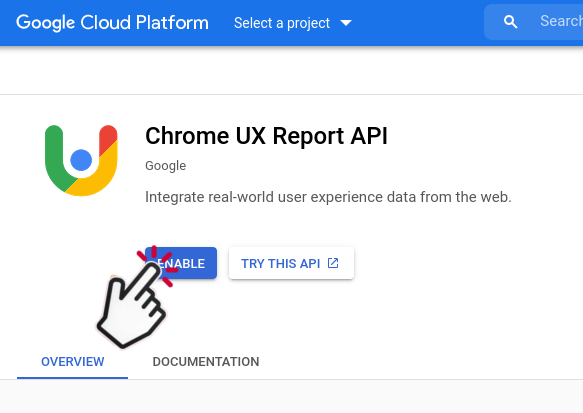
Chrome UX Report API also called as CRUX, provides only core Web Vital metrics data namely : First Contentful Paint, Largest Contentful Paint, Cumulative Layout Shift and First Input Delay. These are the golden metrics that are very important to monitor and improve upon for better SEO and search ranking. CRUX data measures and aggregates these core vitals from real users over a rolling 28-Day period. Since this data is from a vast distribution of real users, it is more representative of the website performance in the real world than the web vitals from PageSpeed Insigths API.
Step 2: Install and Launch Two Minute Reports
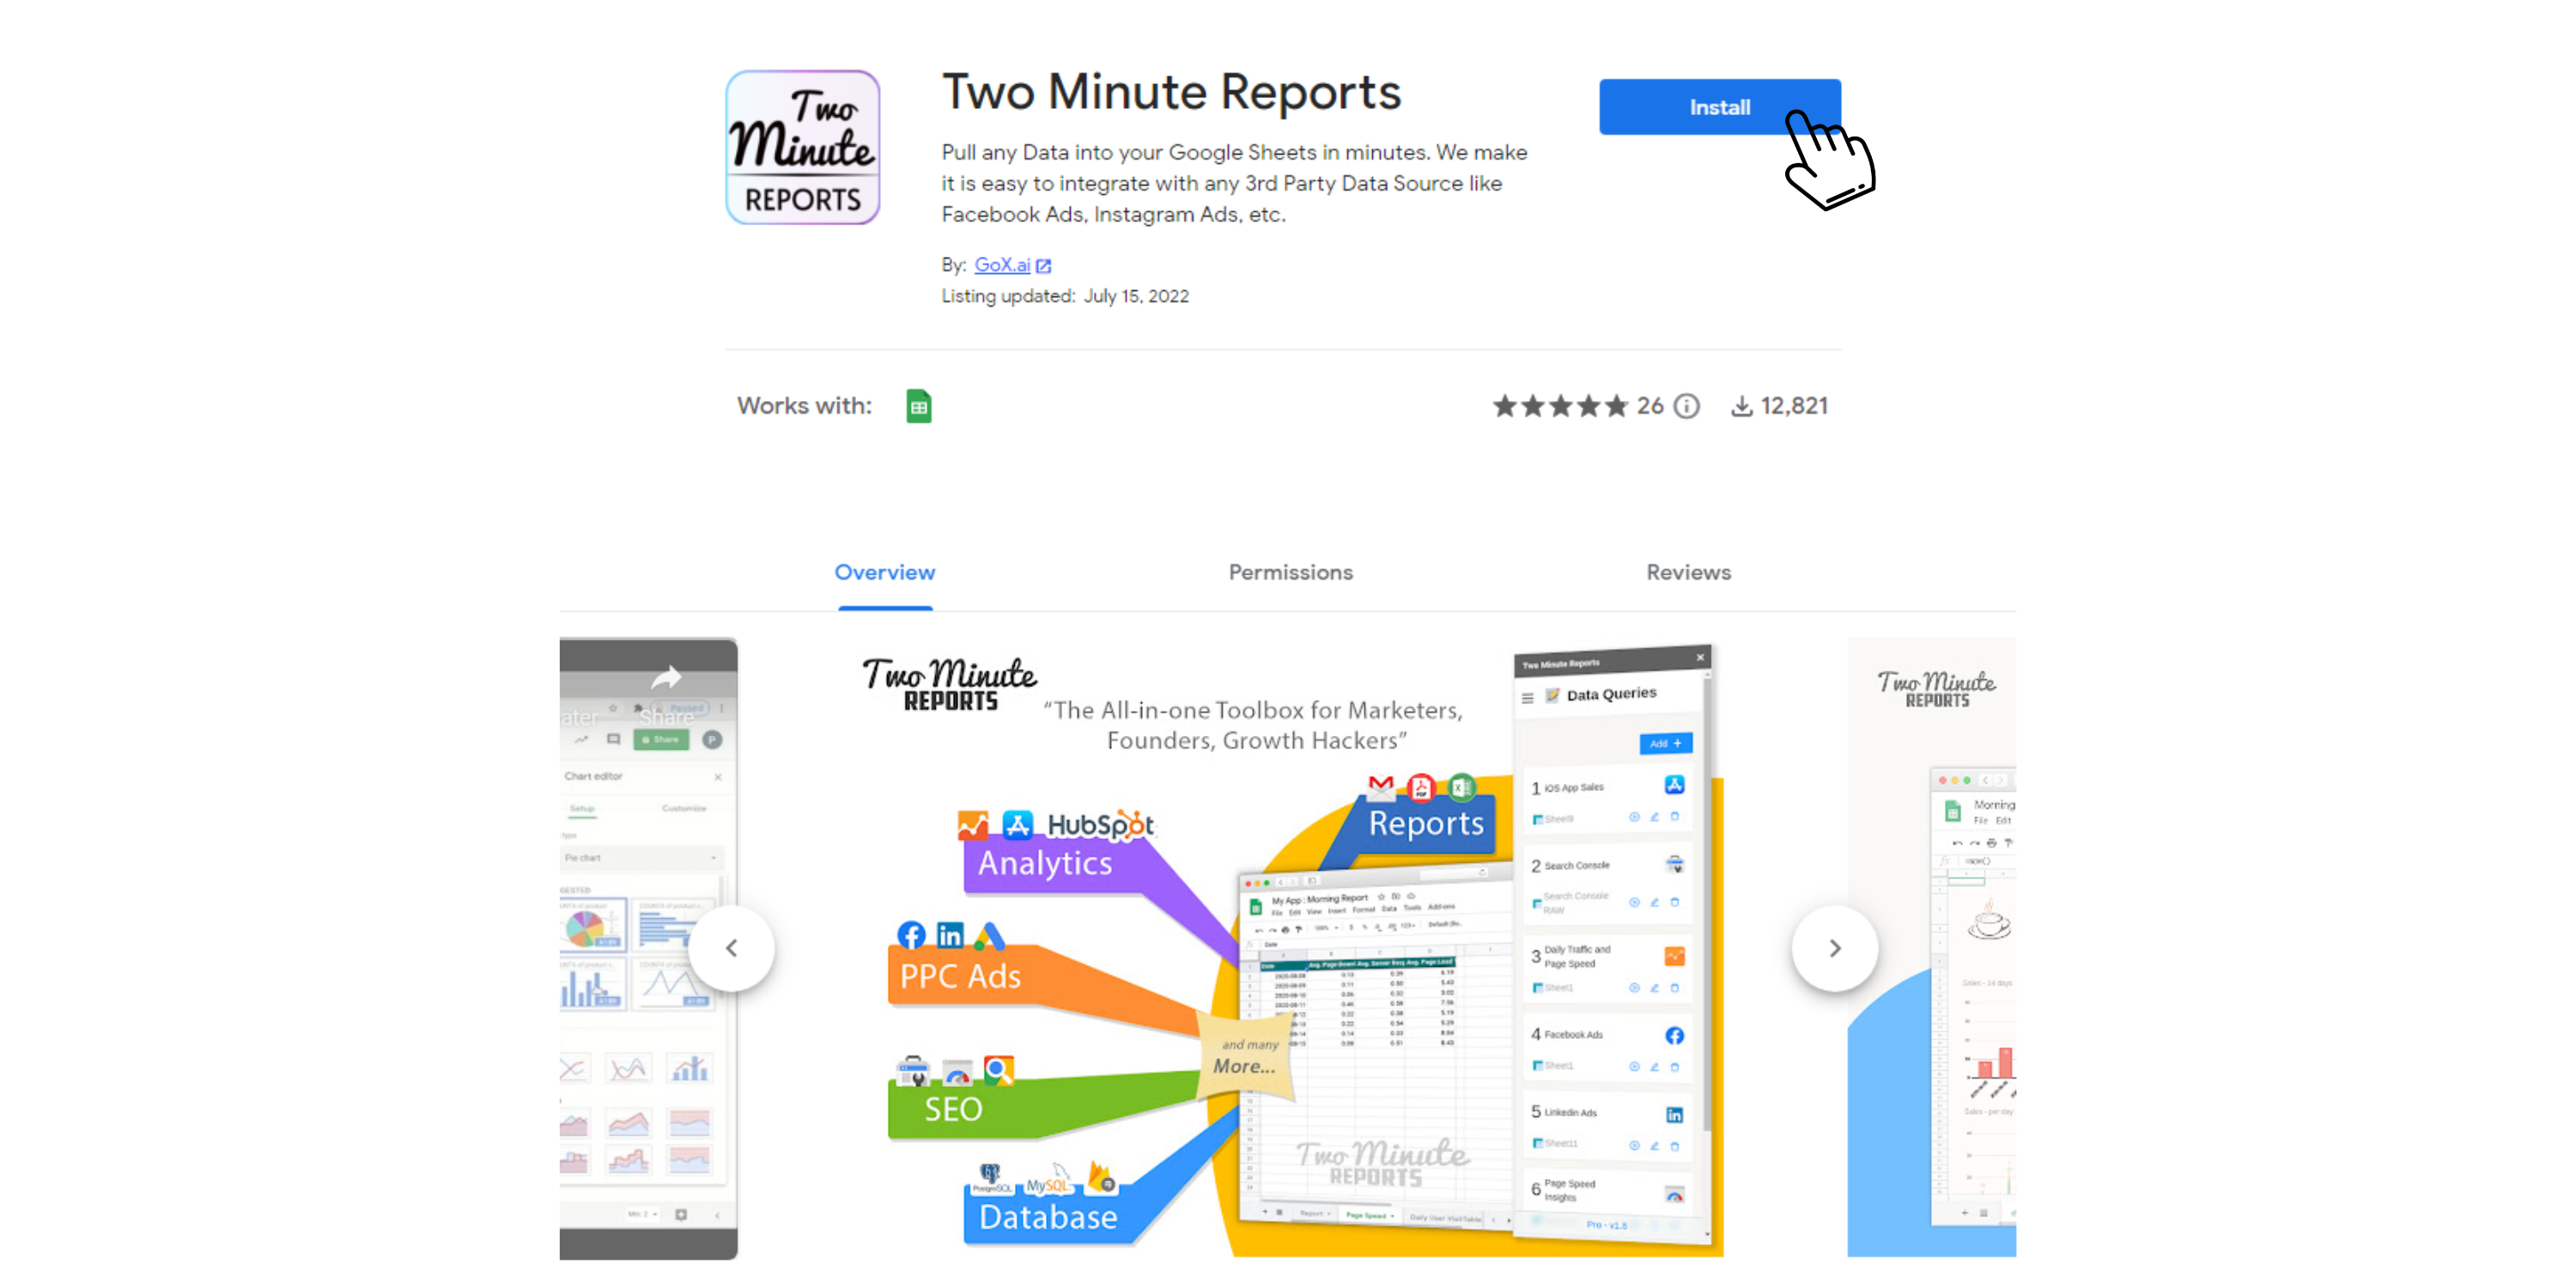
This simple add-on for Google Sheets pulls data from data sources like Google’s PageSpeed Insights API into Google Sheets. Install it from the GSuite marketplace here. Do follow the steps below and experience the full benefits of Two Minute Reports.
Install Two Minute Reports, if you have not done already.
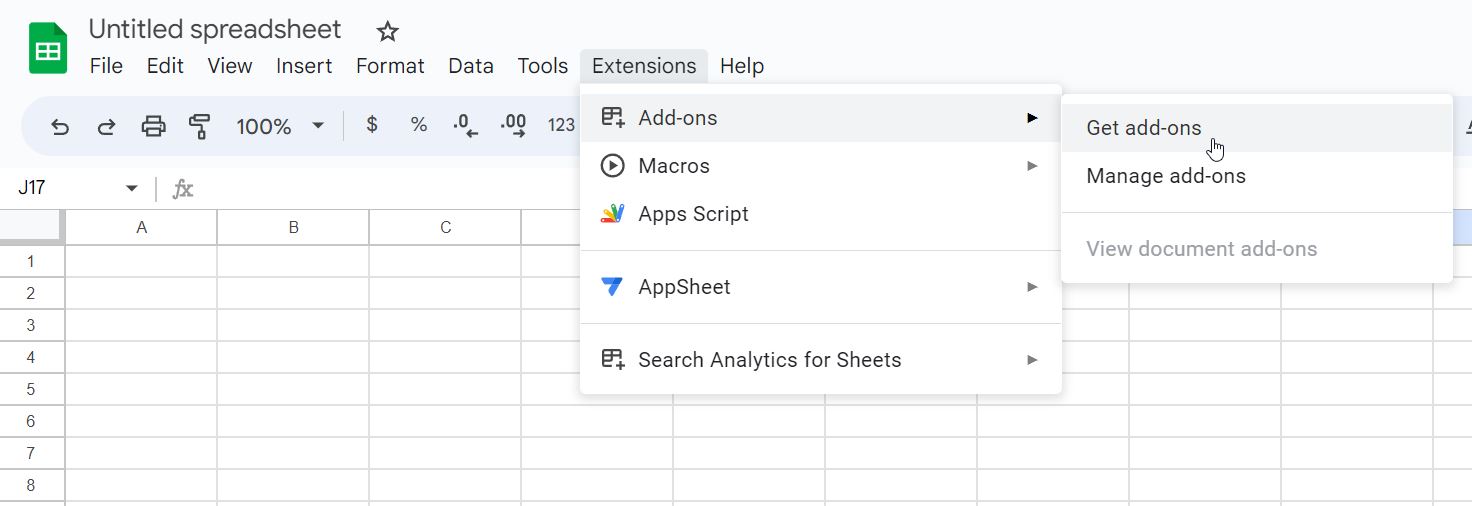
Sign in to any Google Sheet and go to Add-ons -> Get add-ons.
Search for Two Minute Reports and select Install.
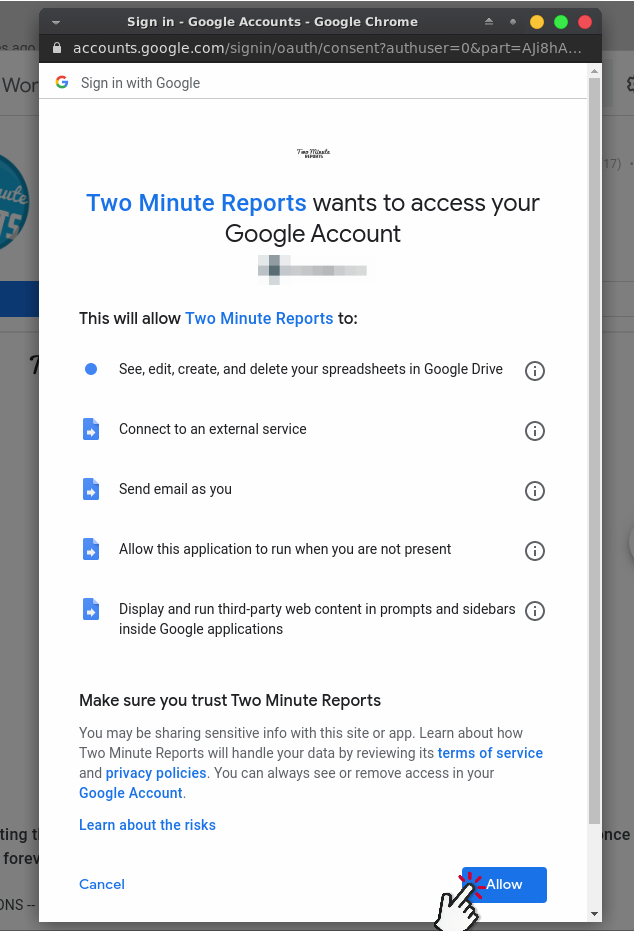
Review and accept the permissions necessary to run Two Minute Reports. Two Minute Reports will be installed for you with the e-mail you are sign in to Google Sheets.
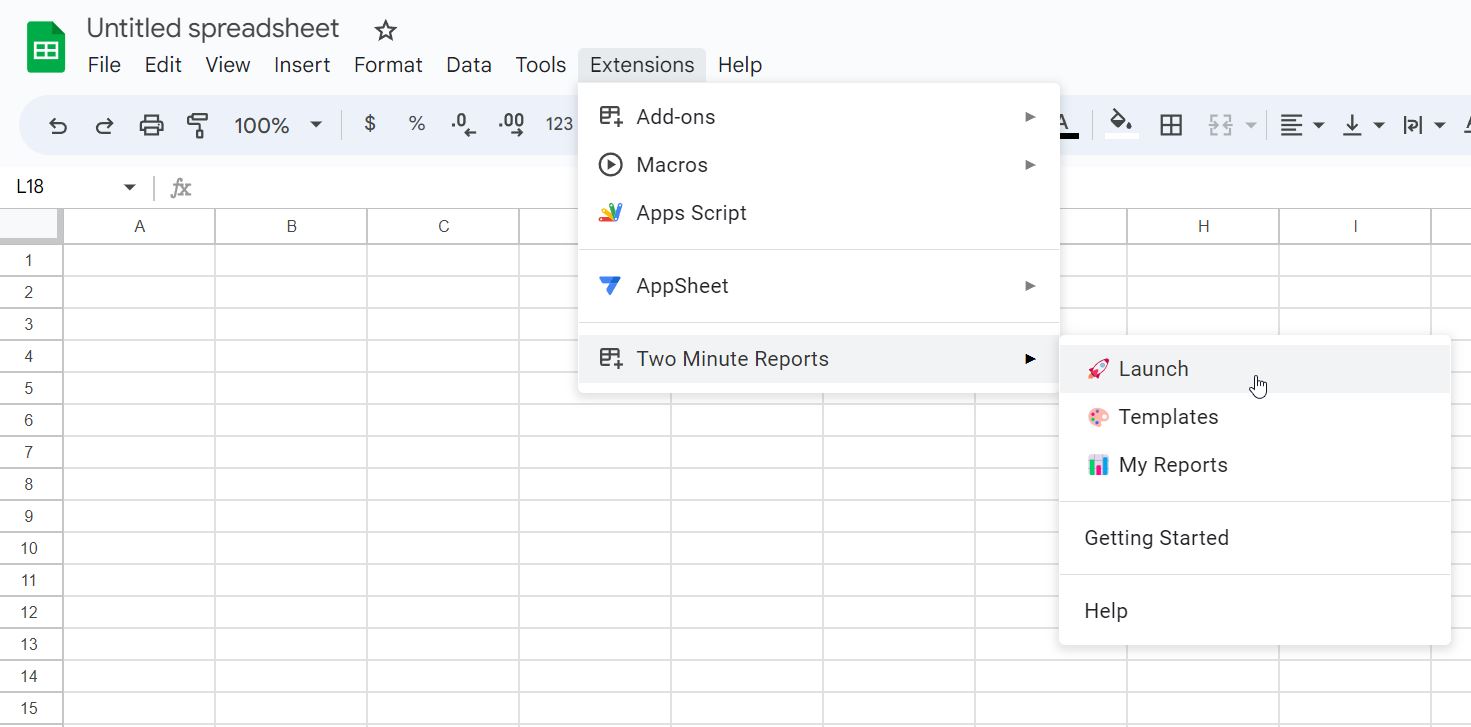
Open Google Sheets and go to Extensions -> Two Minute Reports -> Launch.
Step 3 : Enter the URLs and PageSpeed metrics that you want to track
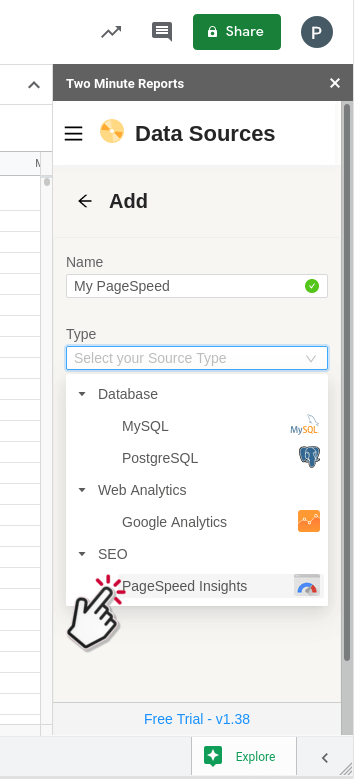
- After launching Two Minute Reports, go to the Data Sources section and select PageSpeed from the “Type” dropdown.
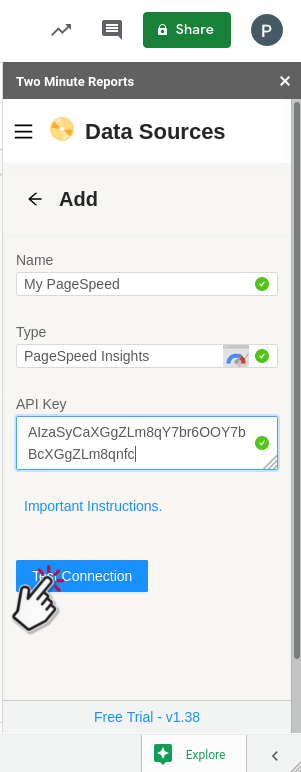
- Enter the API key that got from Google after Step 1
- Press Test Connection to verify if your API key is valid
- The API key is encrypted and stored safely within your Google Account’s userProperties. This ensures that only you can safely access your newly added data source from all your Google Sheets
Once your new data source has been added, you can go to the Data Queries section and start pulling PageSpeed Metrics.
- Select your newly added data source from “Use (Data Source)” dropdown.
- Select the sheet (Run on Sheet) onto which you want the core web vitals data to be saved.
- Next, select the Method of your choice. Selecting Rolling 28Day will fetch data from the Chrome UX Report API. And selecting RealTime will fetch data from the PageSpeed Insights API.
- The difference is that the Realtime option scans your website in real-time and gives you more additional metrics than the other method.
- However, such a scan can sometimes result in data not being representative of the real-world user experience. This can be overcome by using the Rolling 28Day data. This method aggregates data from real-world users, allowing you to get a consolidated view of your user experience.

- You can scan up to 1000 URLs at a time using the Rolling 28Day method vs 5 URLs in the Realtime method.
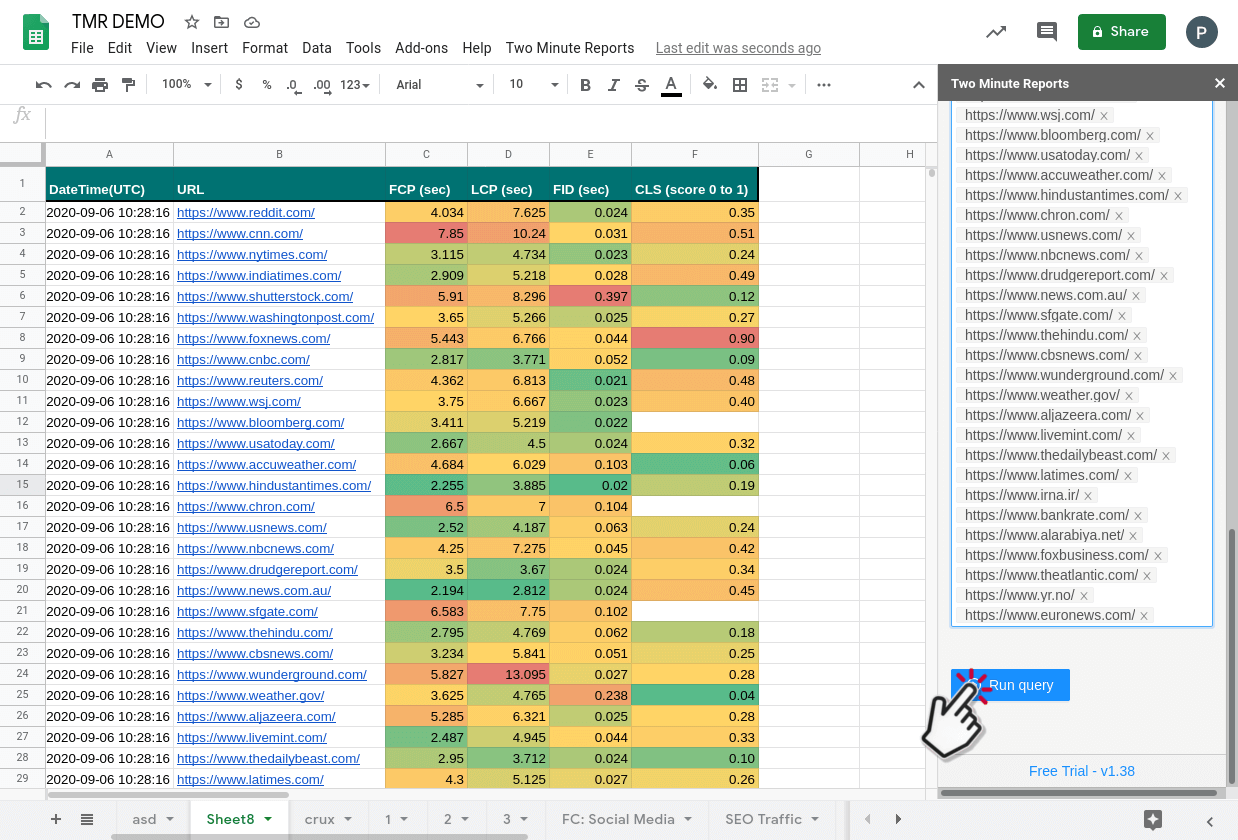
- Once you have added your URLs, pressing Run query will process the URLs and save the results in your spreadsheet.
You can refresh or run queries again by pressing the “run icon” shown beside your query listing in the Data Queries section.

Do note that the queries are securely stored locally in your Google Sheets. And so it can only be accessed from within the Google Sheets that created it. This makes it easier to manage multiple queries properly within different google sheets. This is different from how we store Data Sources, which can be accessed from any spreadsheet within that Google account.
Step 4: (Optional) Schedule and email report
Once you have fetched data once, you might want to get new data from your database at periodic intervals. You can do this creating a new schedule under the “Schedule Reports” section. You can schedule updates hourly, daily, weekly or monthly based on your needs.
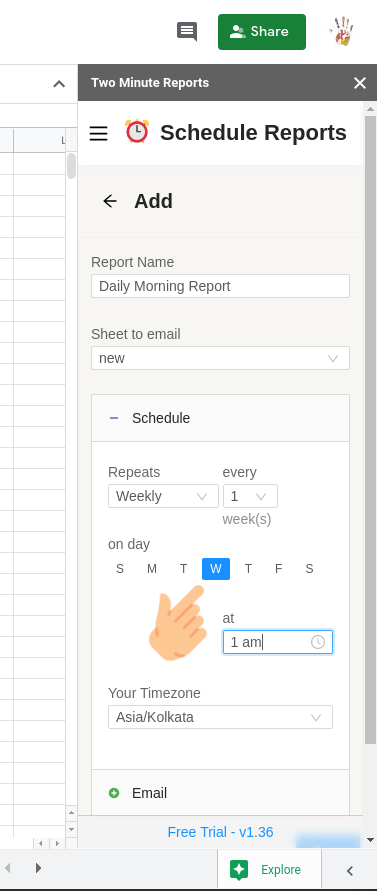
You could also create a report and ask Two Minute Reports to email that report with updated data automatically. Under the email section enter the email Id of the recipients and save your new schedule.
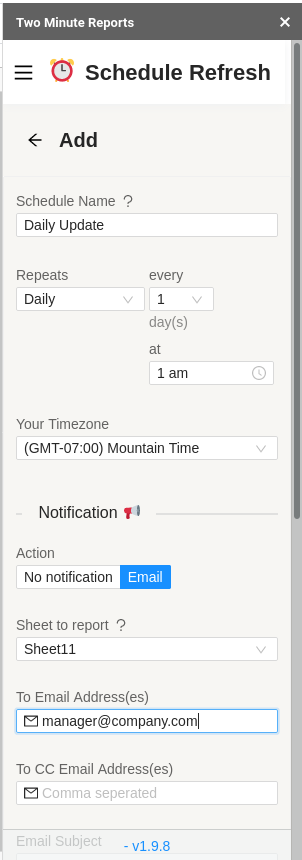
When the time comes, Two Minute Reports will automatically fetch new data from your queries, and email your report to the said recipients. You have freed a lot of your time from mundane reporting tasks.
There are other features with Two Minute Report’s schedule refresh or data refresh feature. You may read our guide How to Refresh Data Automatically in Google Sheets.
Chrome UX Report Data not Found
- An unavailable score or “chrome ux report data not found” means that the CrUX (Chrome UX Report) does not have enough information about the traffic and data of the page.
- Generally, the method “Rolling 28 Day Average” in the query uses a public dataset called “Chrome UX Report” to get the site’s performance report.
- This Chrome UX Report dataset is collected from what millions of chrome users do: how they interact with a page, how long it takes to load the content of the page, what device they are using, etc., This data is collected, stored and updated periodically and it is not real-time.
- On the other hand, the method “RealTime” uses the PSI (Page Speed Insights) API to analyze a site and generates the performance report by real-time.
Try Two Minute Reports for Free by installing from the GSuite marketplace, and start managing your SEO tasks in a breeze within Google Sheets. Cheers!