Connect Facebook Ads to Looker Studio: Tutorial & Free Templates (2024)

- How to export Facebook Ads data to Looker Studio in under two minutes?
- Start using these quick templates for google sheets Now
- Why connect Facebook Ads to Looker Studio?
- Top used KPIs of Facebook Ads in Looker Studio
- Get Google Analytics 4 data in Google Sheets too!
- Connect other Platform Data Sources with Google Sheets
How to export Facebook Ads data to Looker Studio in under two minutes?
With Two Minute Reports (TMR), you can build comprehensive Facebook Ads Reports, and automatically pull data from Facebook Ads to Looker Studio; all without a single line of code.
There are two methods to build your Facebook Ads Looker Studio report using TMR /
Method 1 : Connect Facebook Ads to Looker Studio and build a report from scratch.
Method 2 : Connect Facebook Ads to Looker Studio using in-built Templates of Two Minute Reports.
Step 0: Getting Started
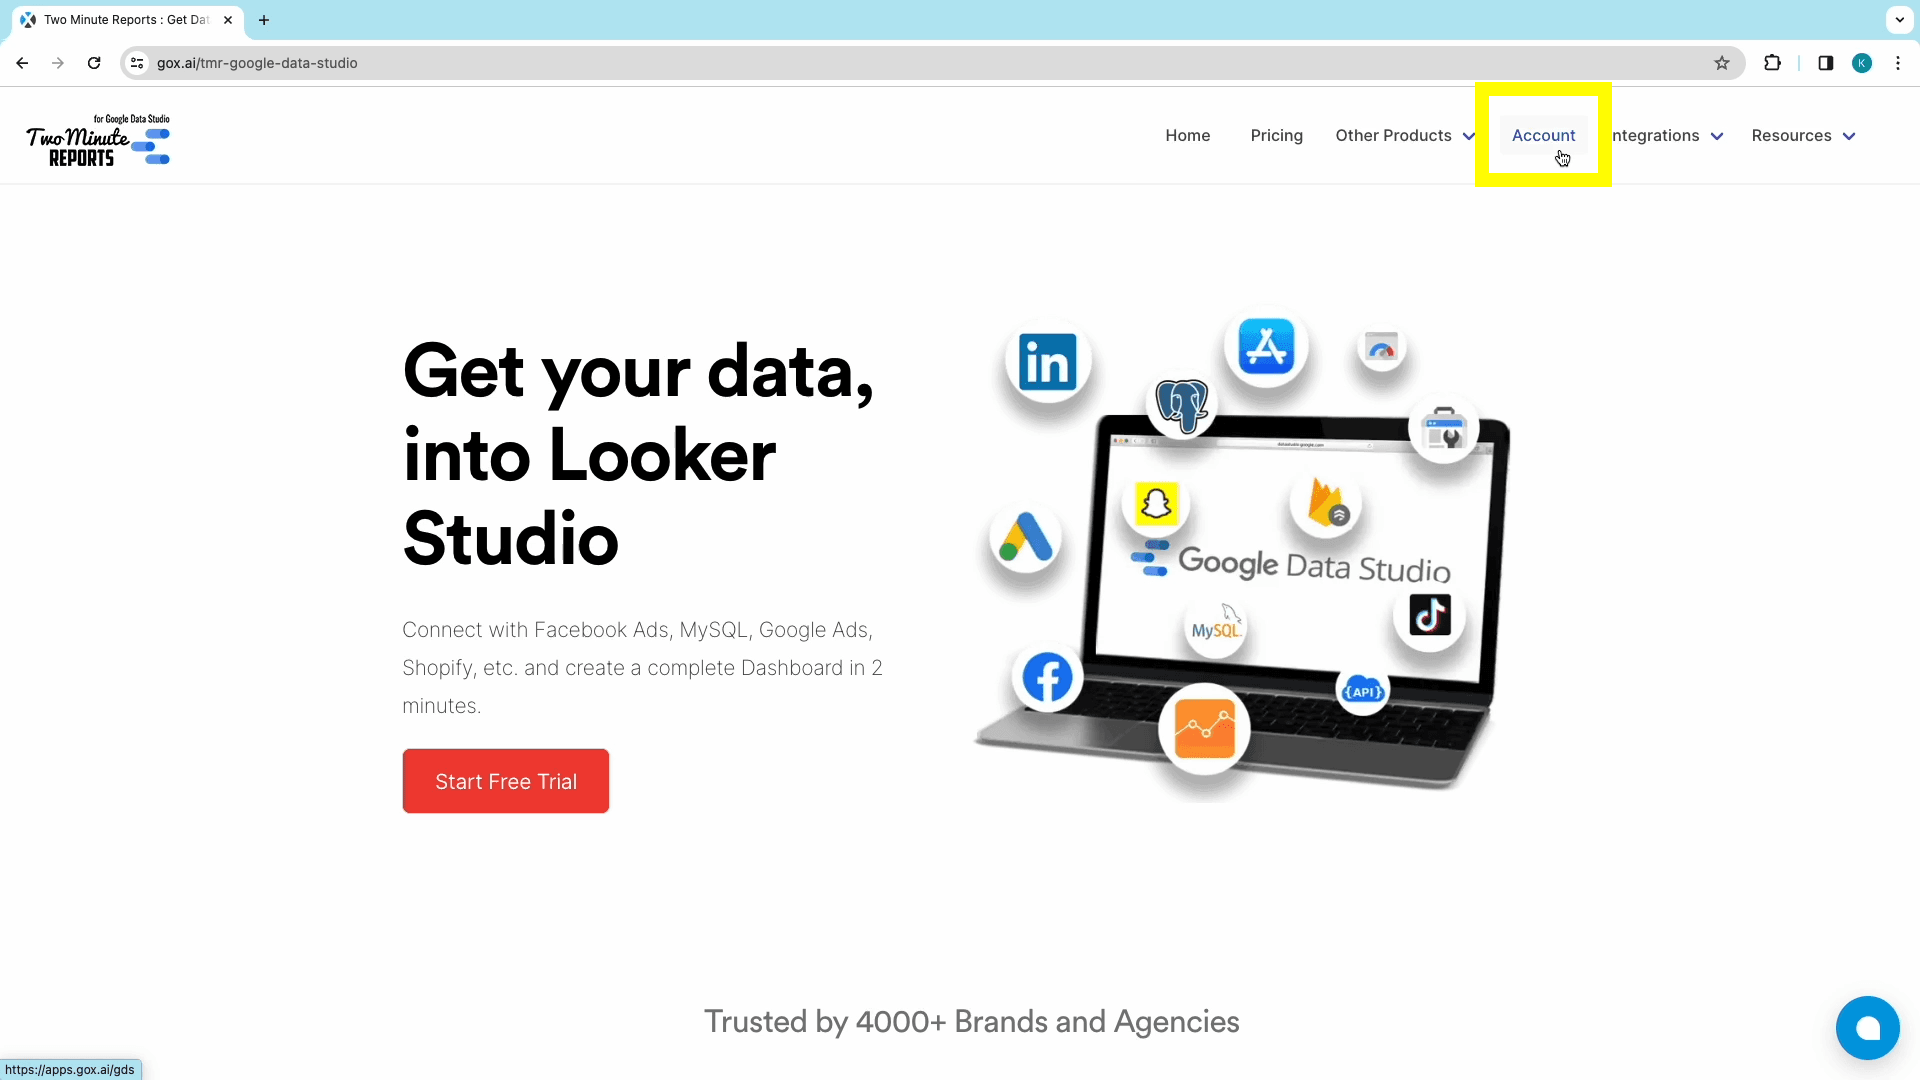
 Both methods start with logging into through the apps portal , or from Home->Two Minute Reports -> Products -> Two Minute Reports for Looker Studio -> Account
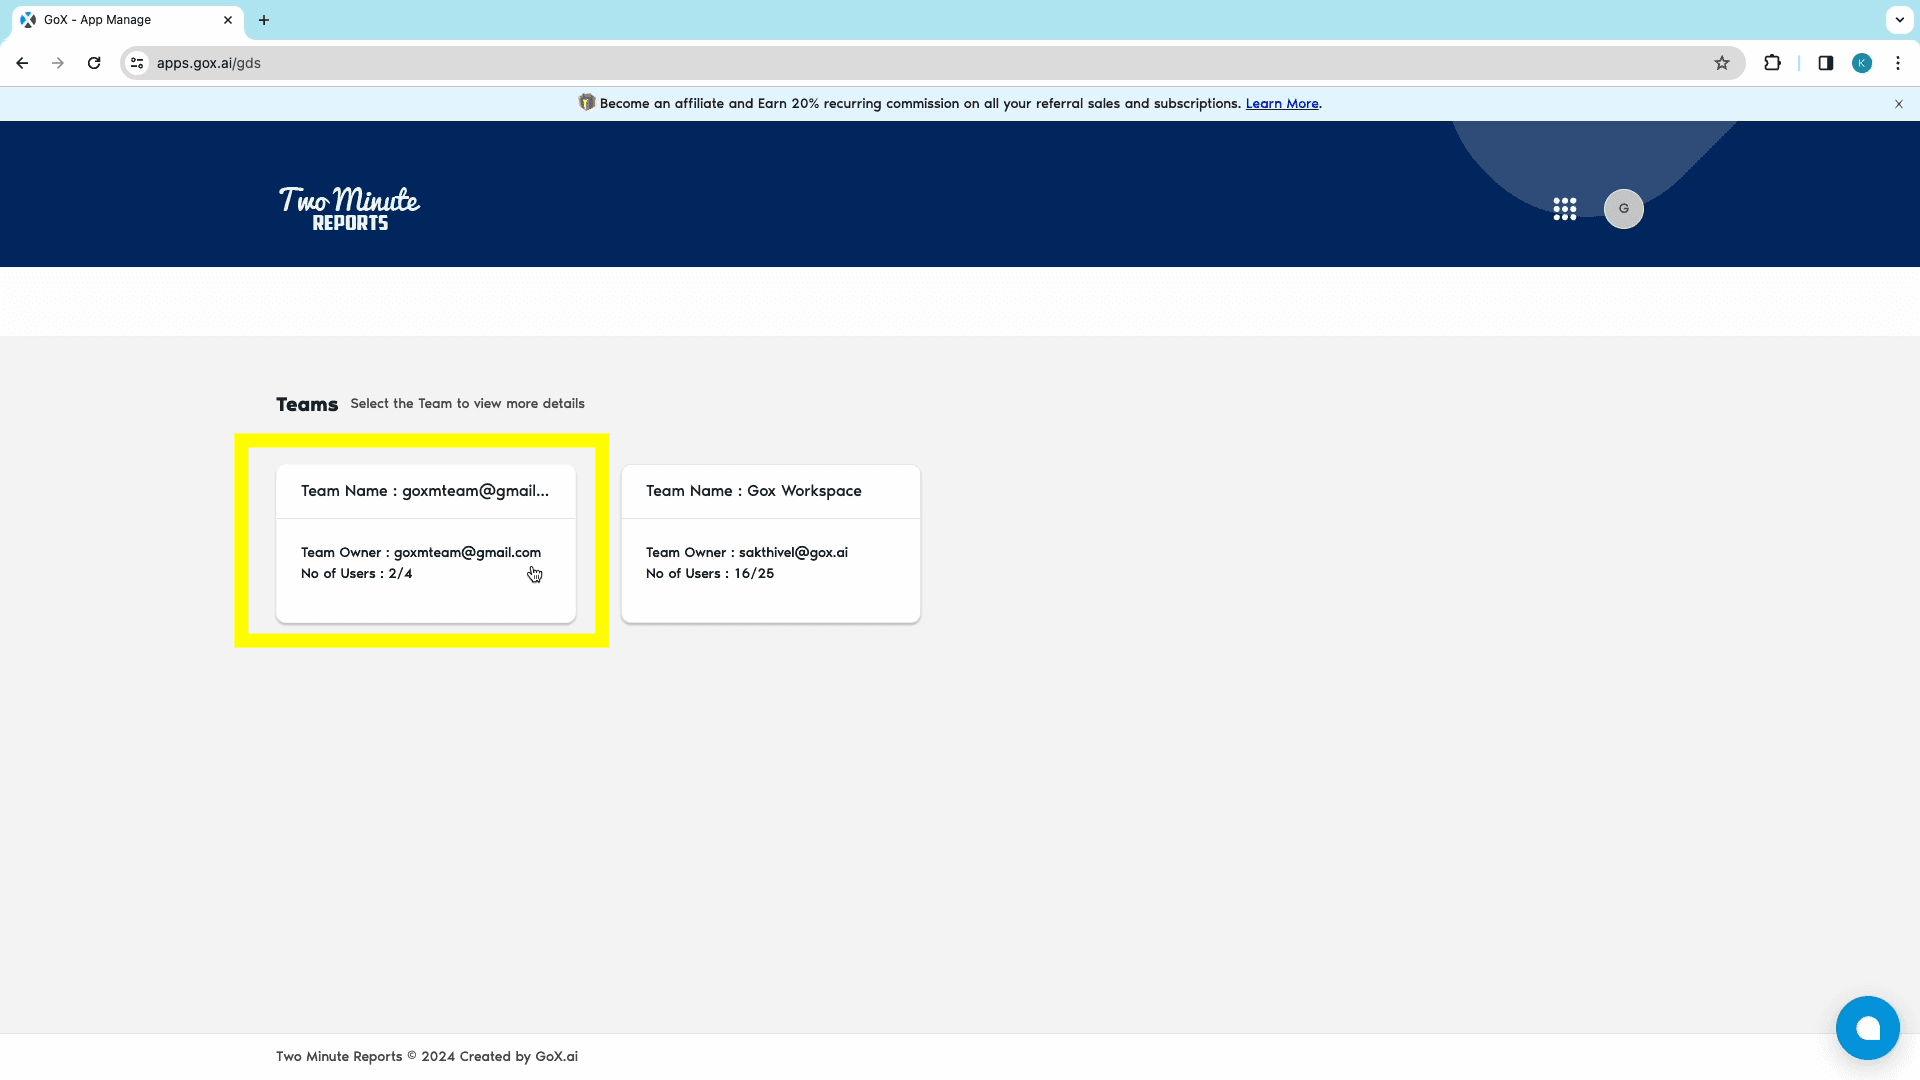
- Once logged in, you need to select a team to access its dashboard.
- If you work with multiple teams, you need to select the relevant team.
- If you aren’t added to multiple teams, you’ll be redirected to the Connectors Page.
[NOTE]: Every organization has separate teams with their separate tasks. To ease management workflows, reports, and collaborative projects, Two Minute Reports has the “Teams” feature. This feature allows your organization to create separate groups within the product to enable collaboration.
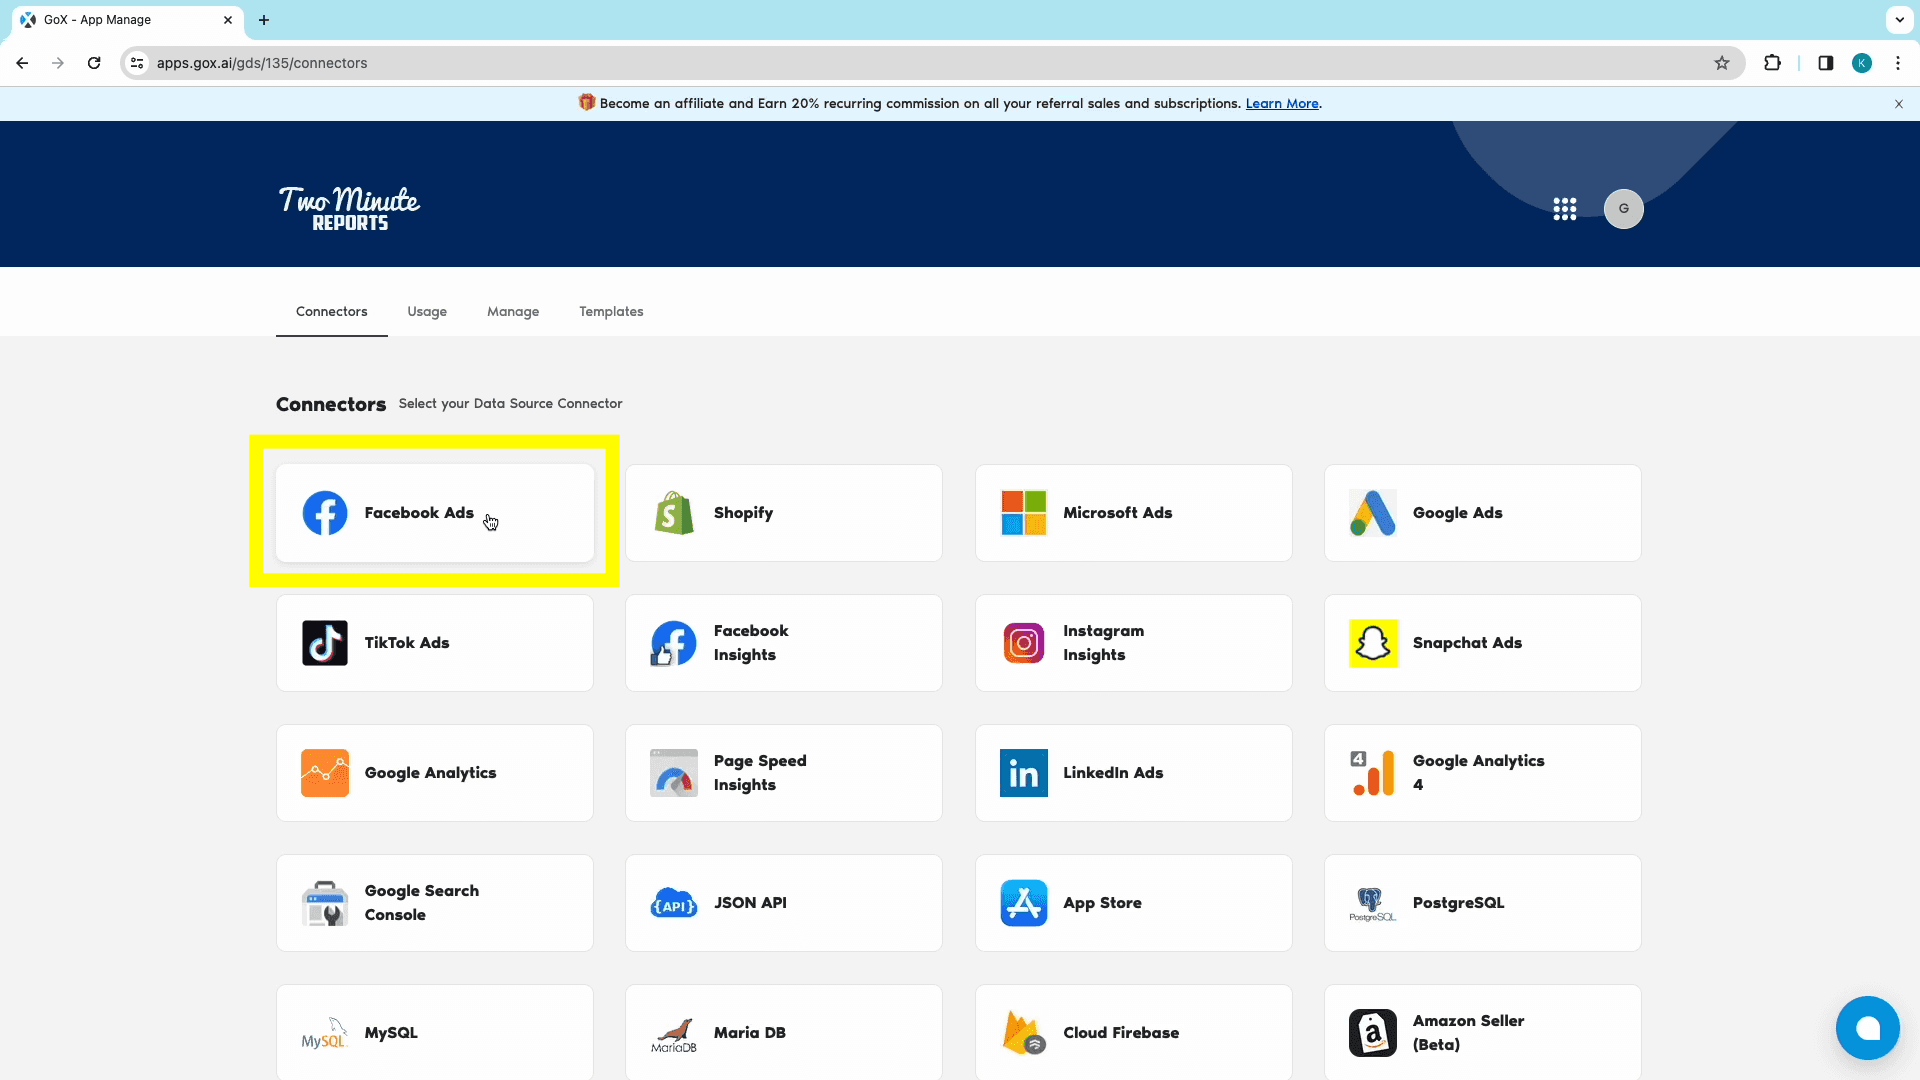
- Choose the relevant data source connector from the connectors page: in this case, click on Facebook Ads.
Method 1: Creating a Looker Studio Facebook Ads Report from scratch
Step 1: Adding the Data Source and authorizing through Facebook Ads account
- Once inside the Facebook Ads Connector dashboard, click “Add New” from the Data Sources section to open the “Adding New Data Source” window.
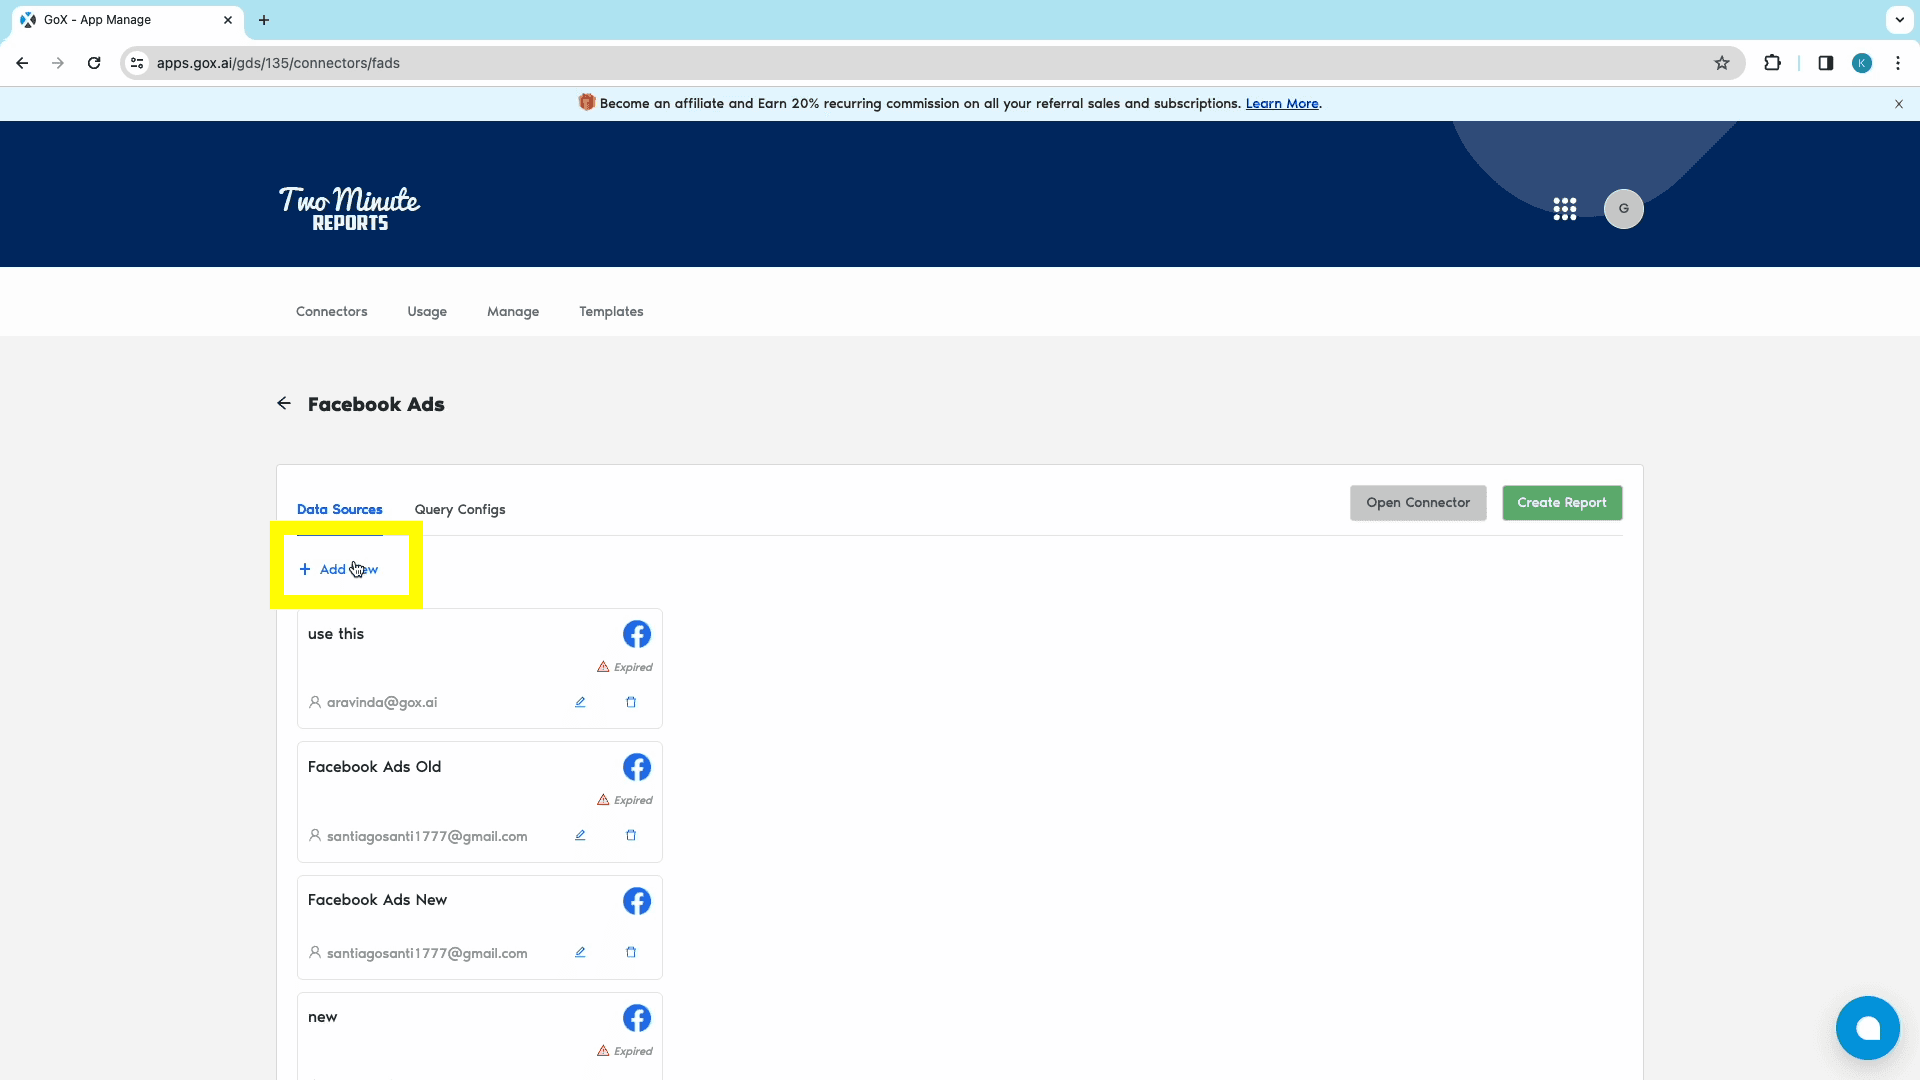
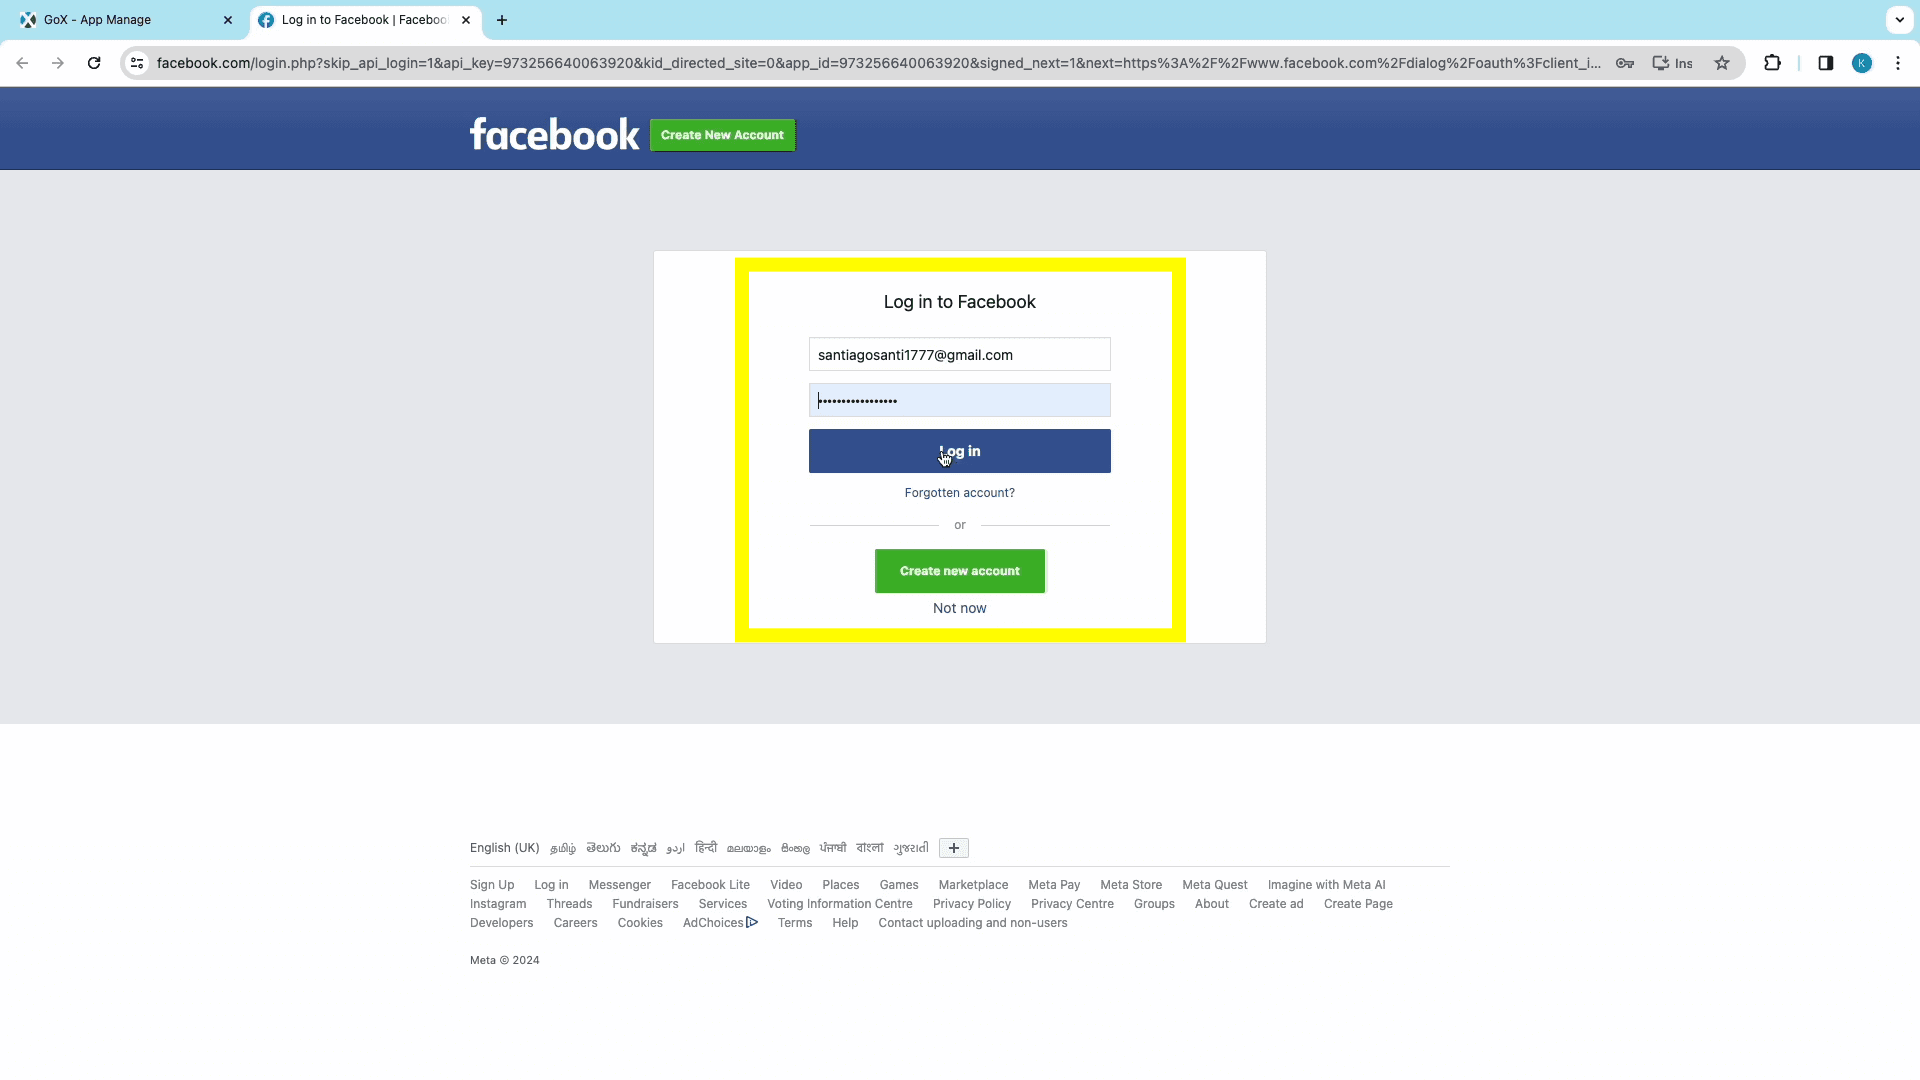
- Name your data source, log into your Facebook Ads account and authorize TMR’s Looker Studio Facebook Ads connector.
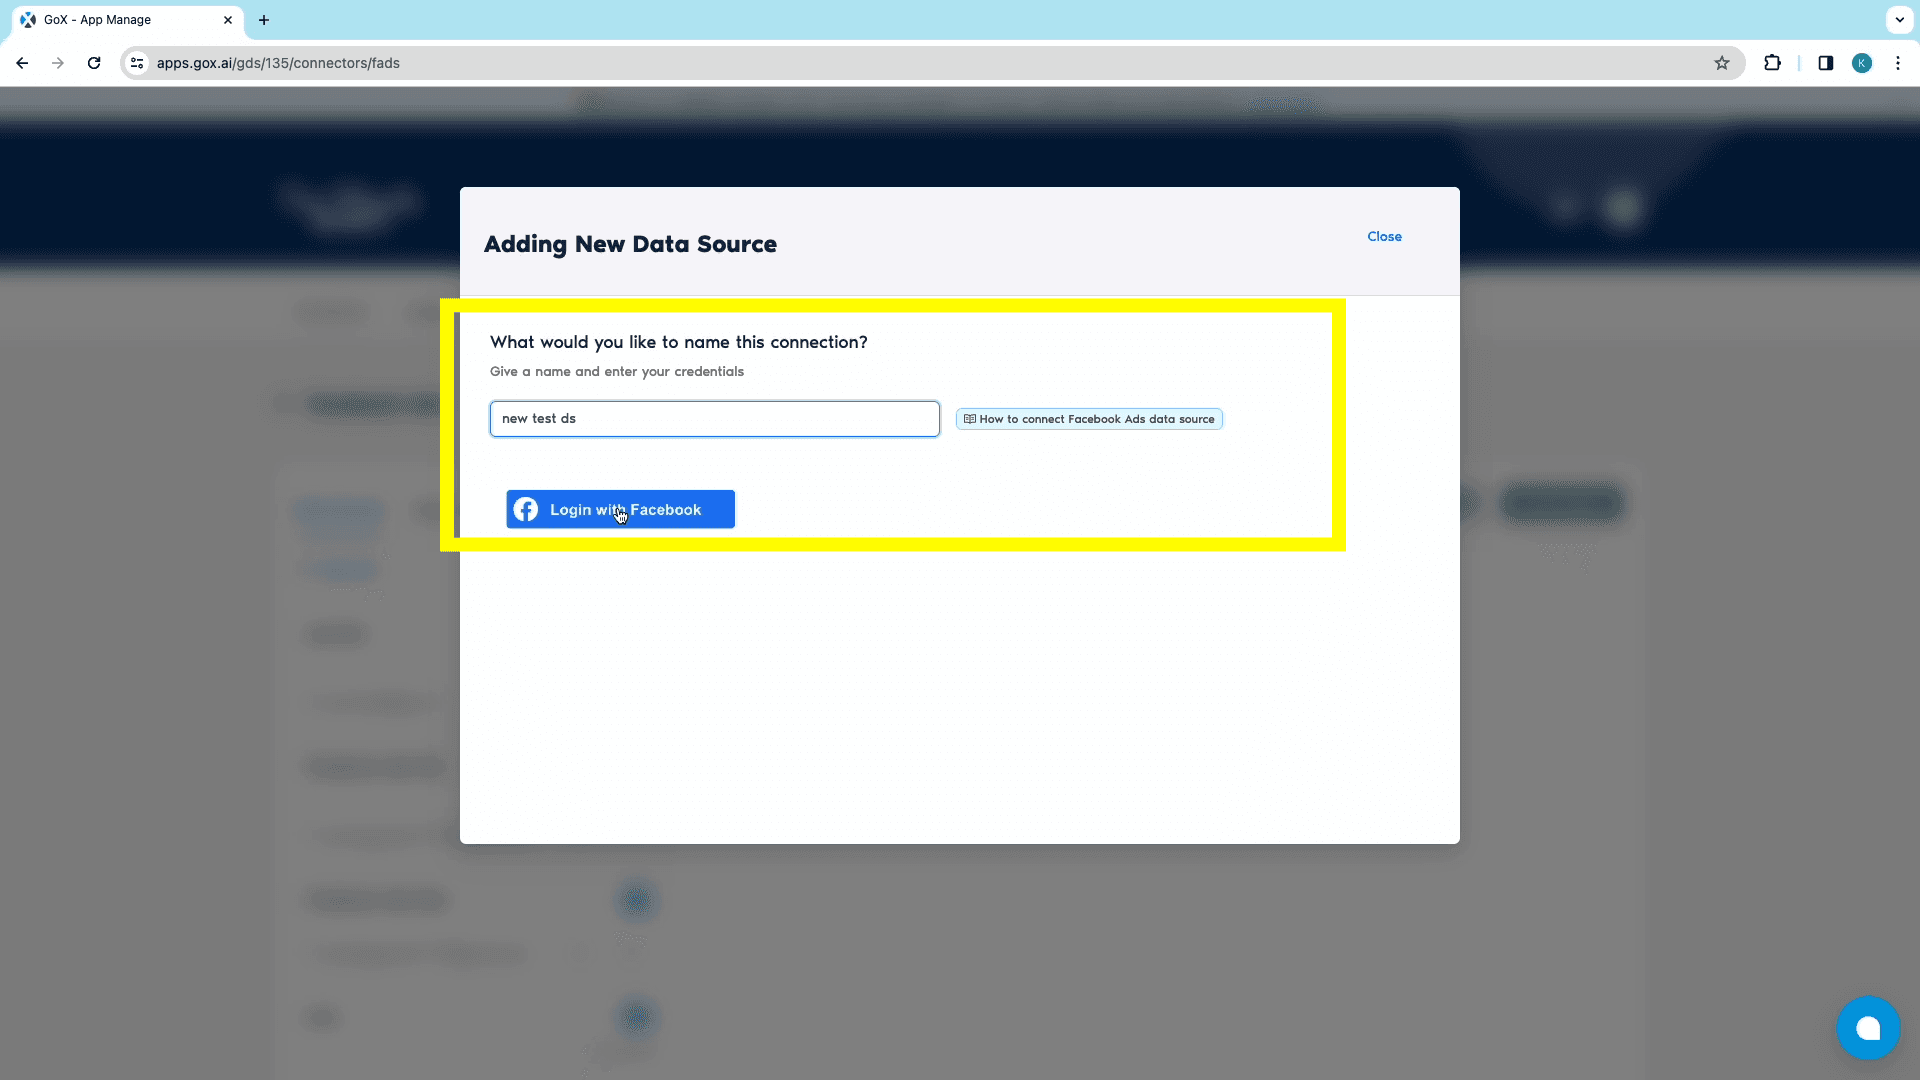
- With this step, your Facebook Ads account has been authorised added as one of the data sources.
Step 2: Query Configuration
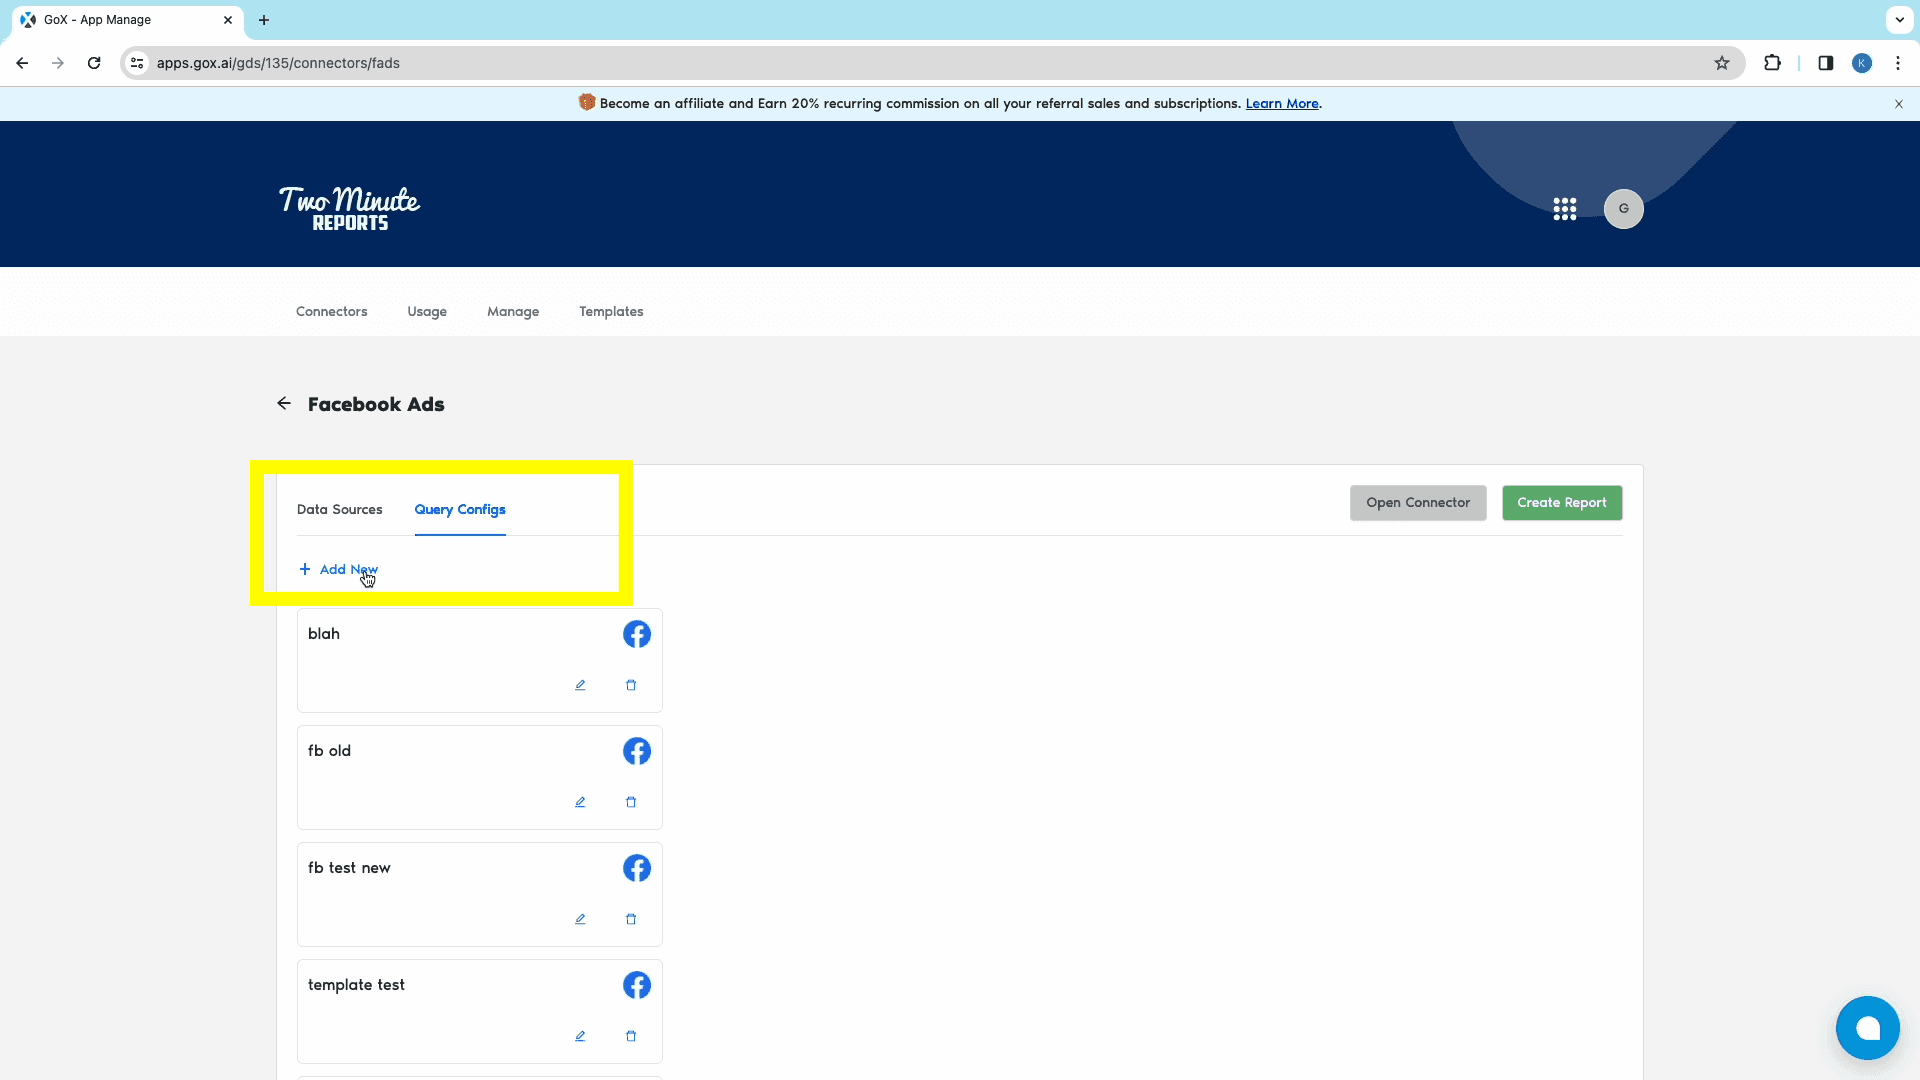
- Next, we can shift to the “Query Configs” section to start configuring a query to export data from Facebook Ads to Looker Studio.
- Click “Add New” to open the “Adding New Query Configuration” window.
- From here, select the data source which you’ve already created and click on Next.
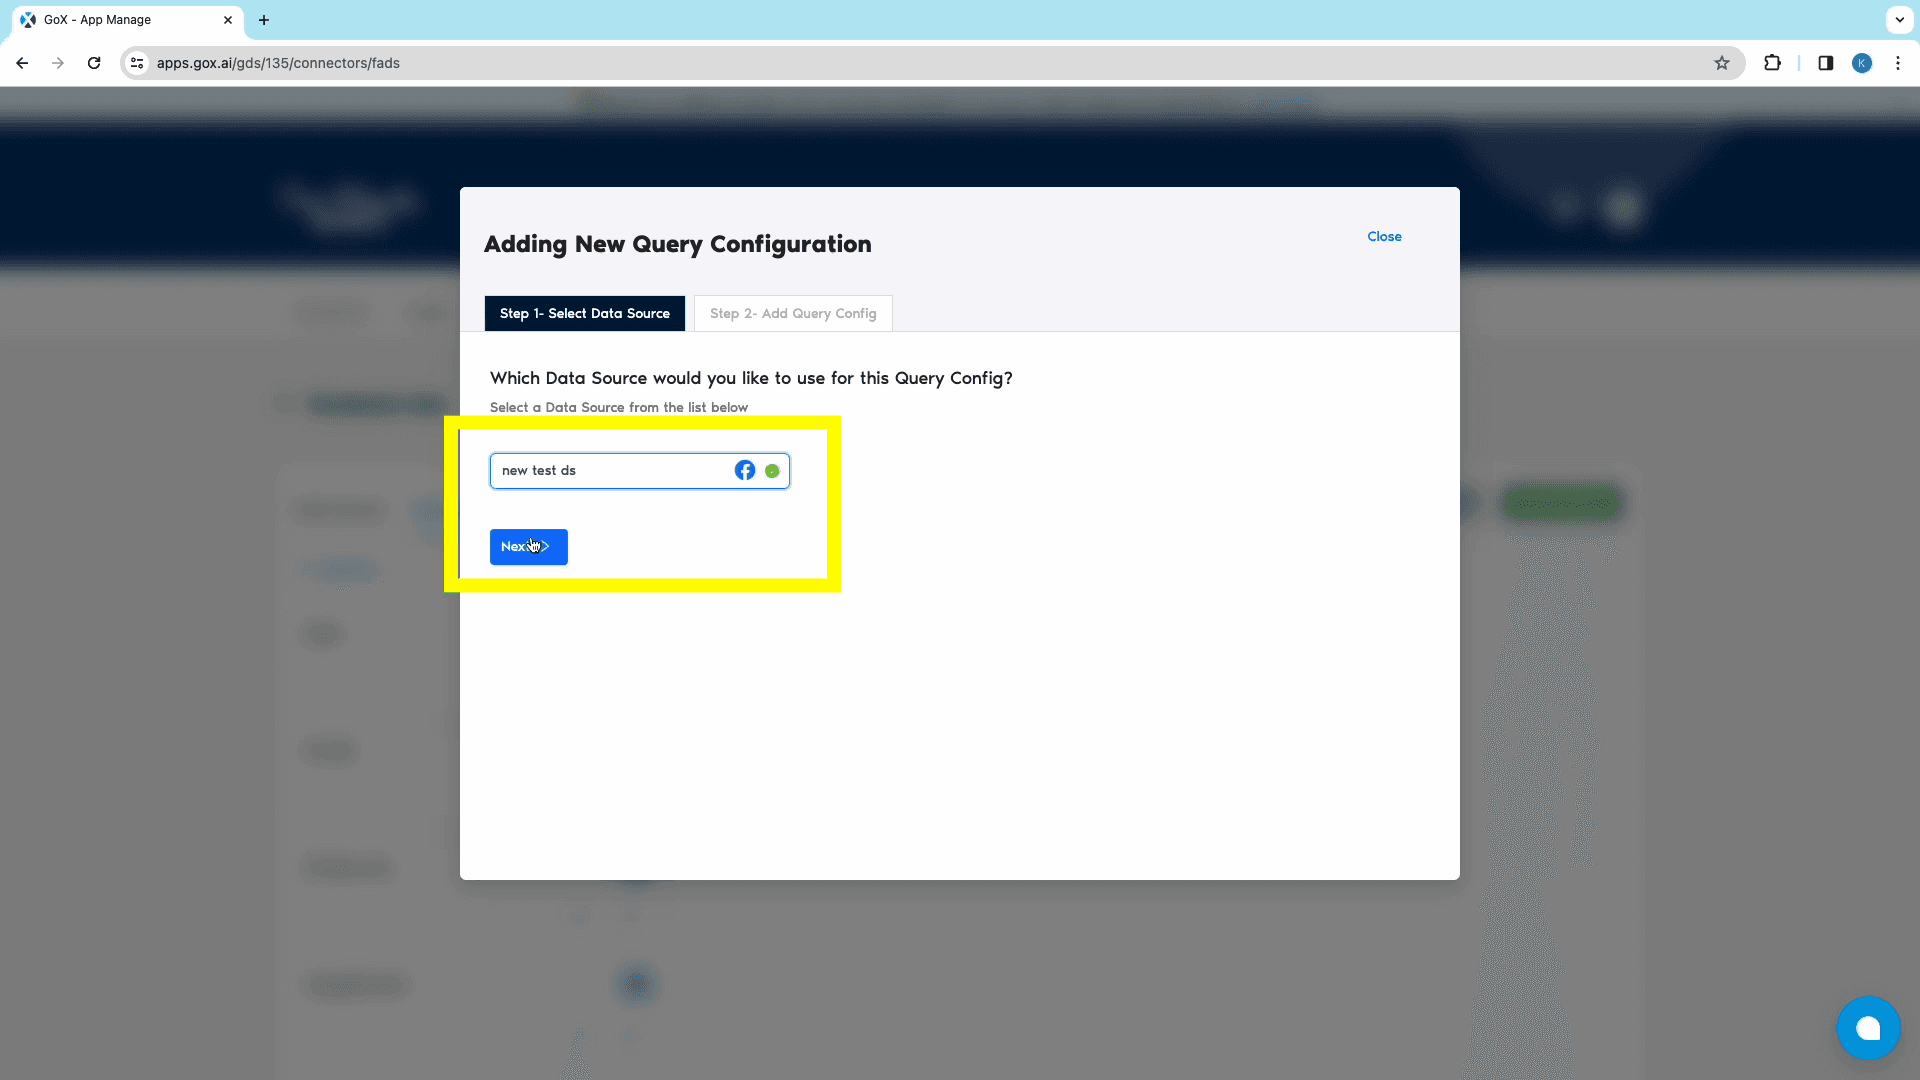
- In the next tab Name the Query, and choose the required Ad Accounts. You can choose 1 or multiple Ad Accounts at the same time.
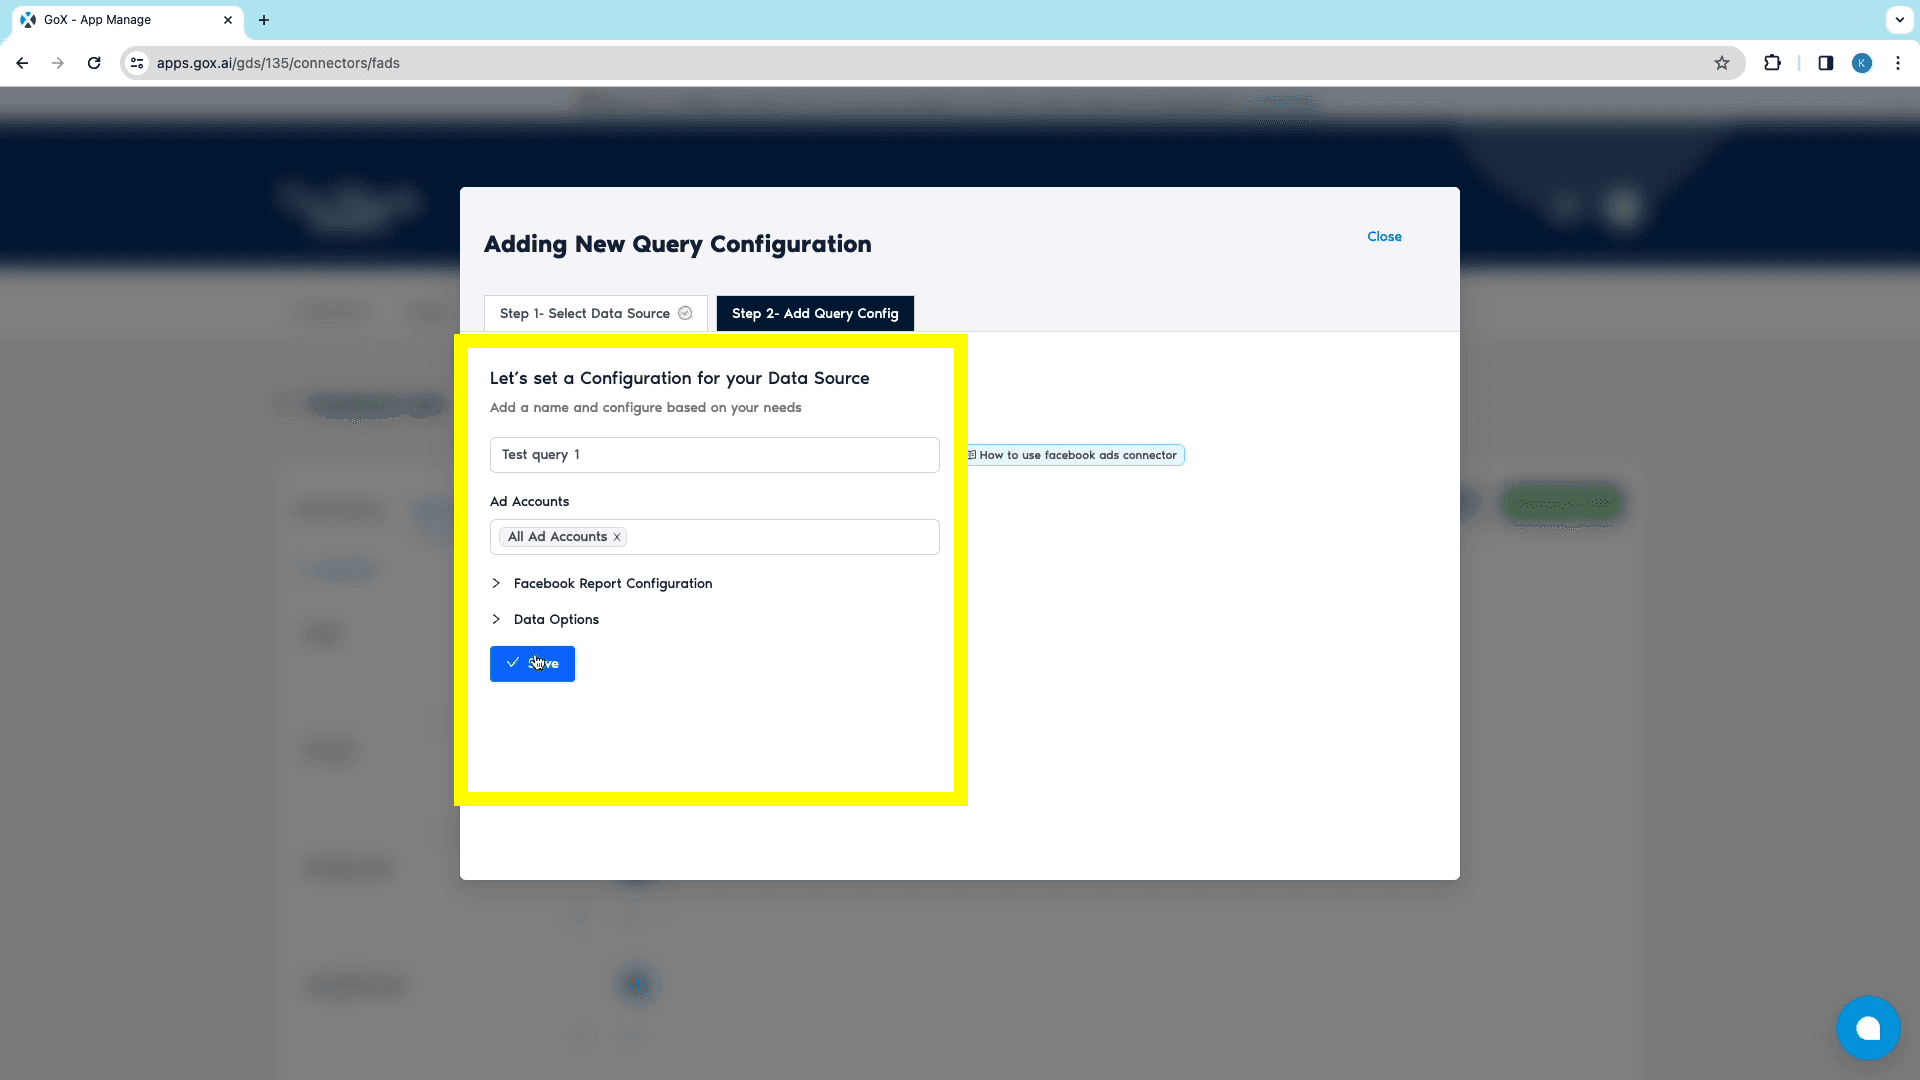
- You can also modify your data from the Data Options drop-down menu.
- Once you’ve completed configuration, Save to create the Query Config.
Step 3: Creating the report from the Google Data Studio Dashboard
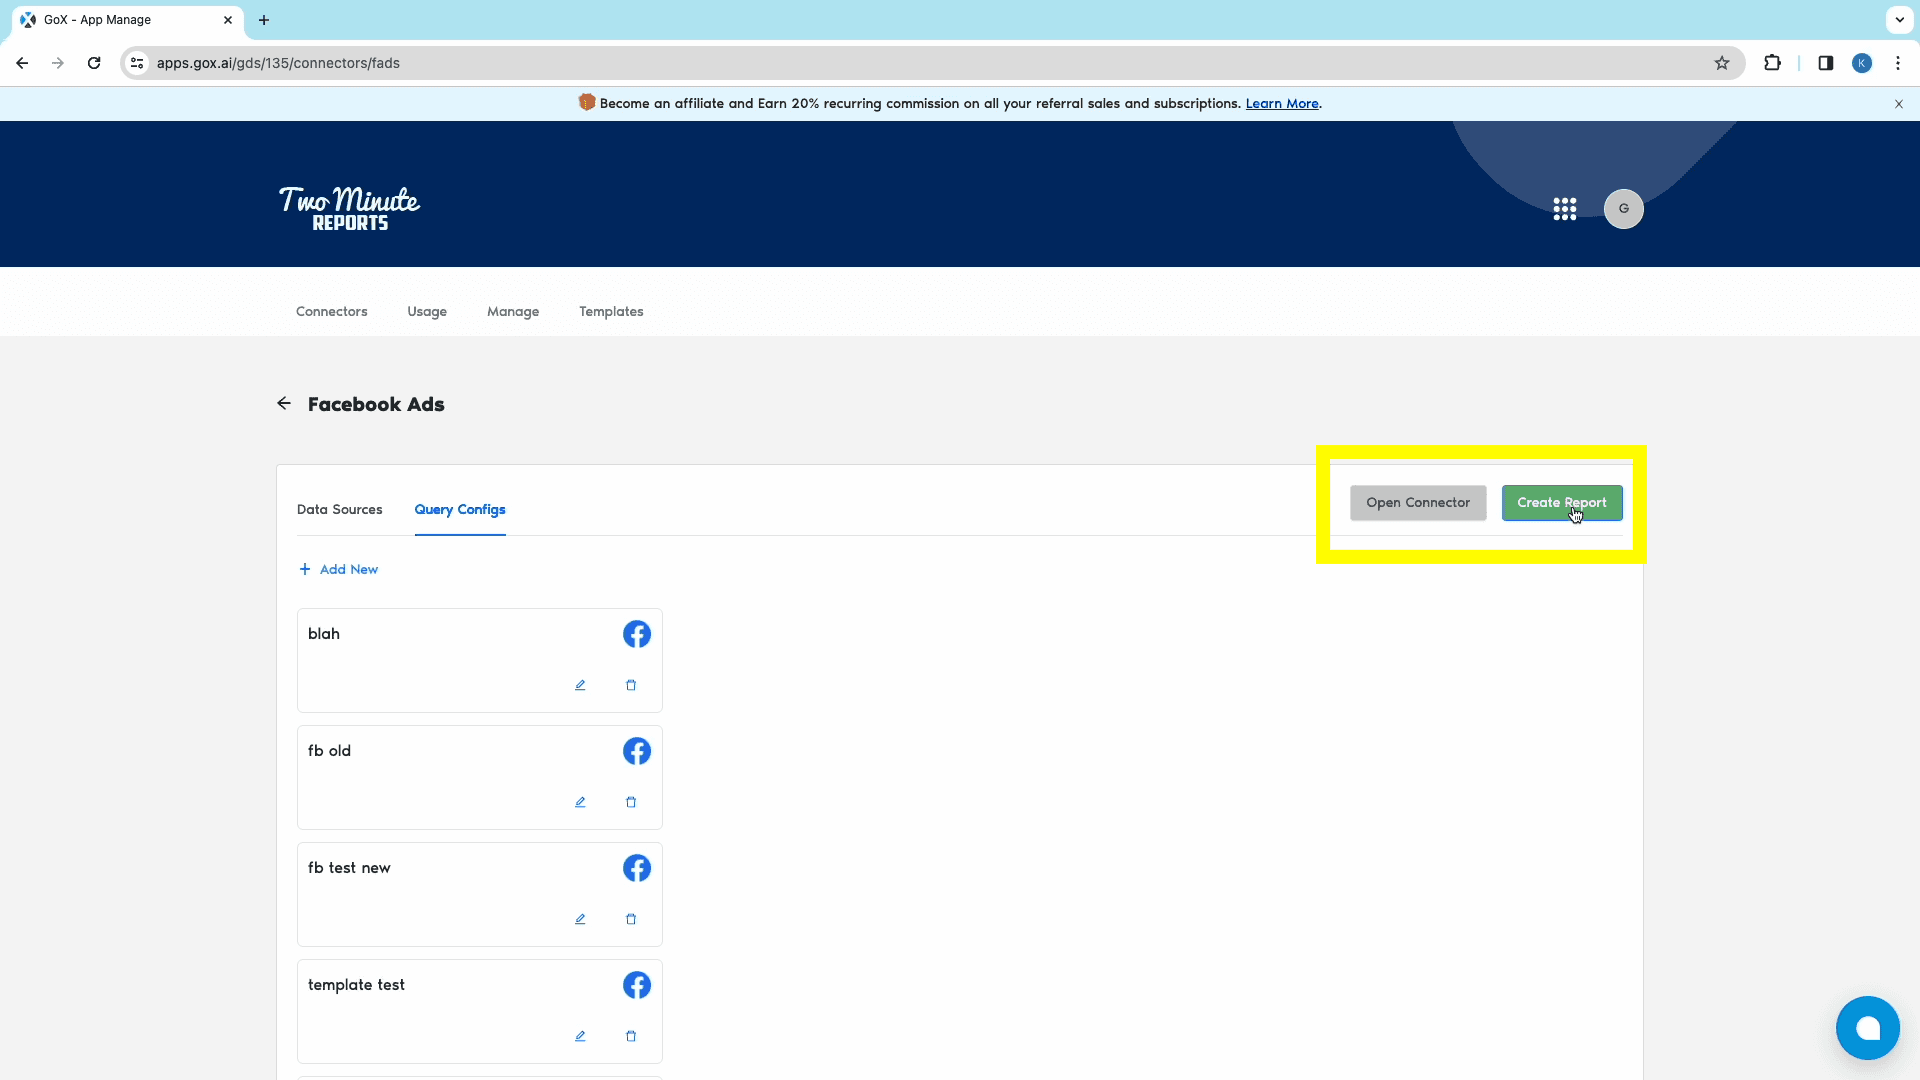
- After adding data source and query configs, click on the green “Create Report” button to open the “Creating New Data Studio Report” window.
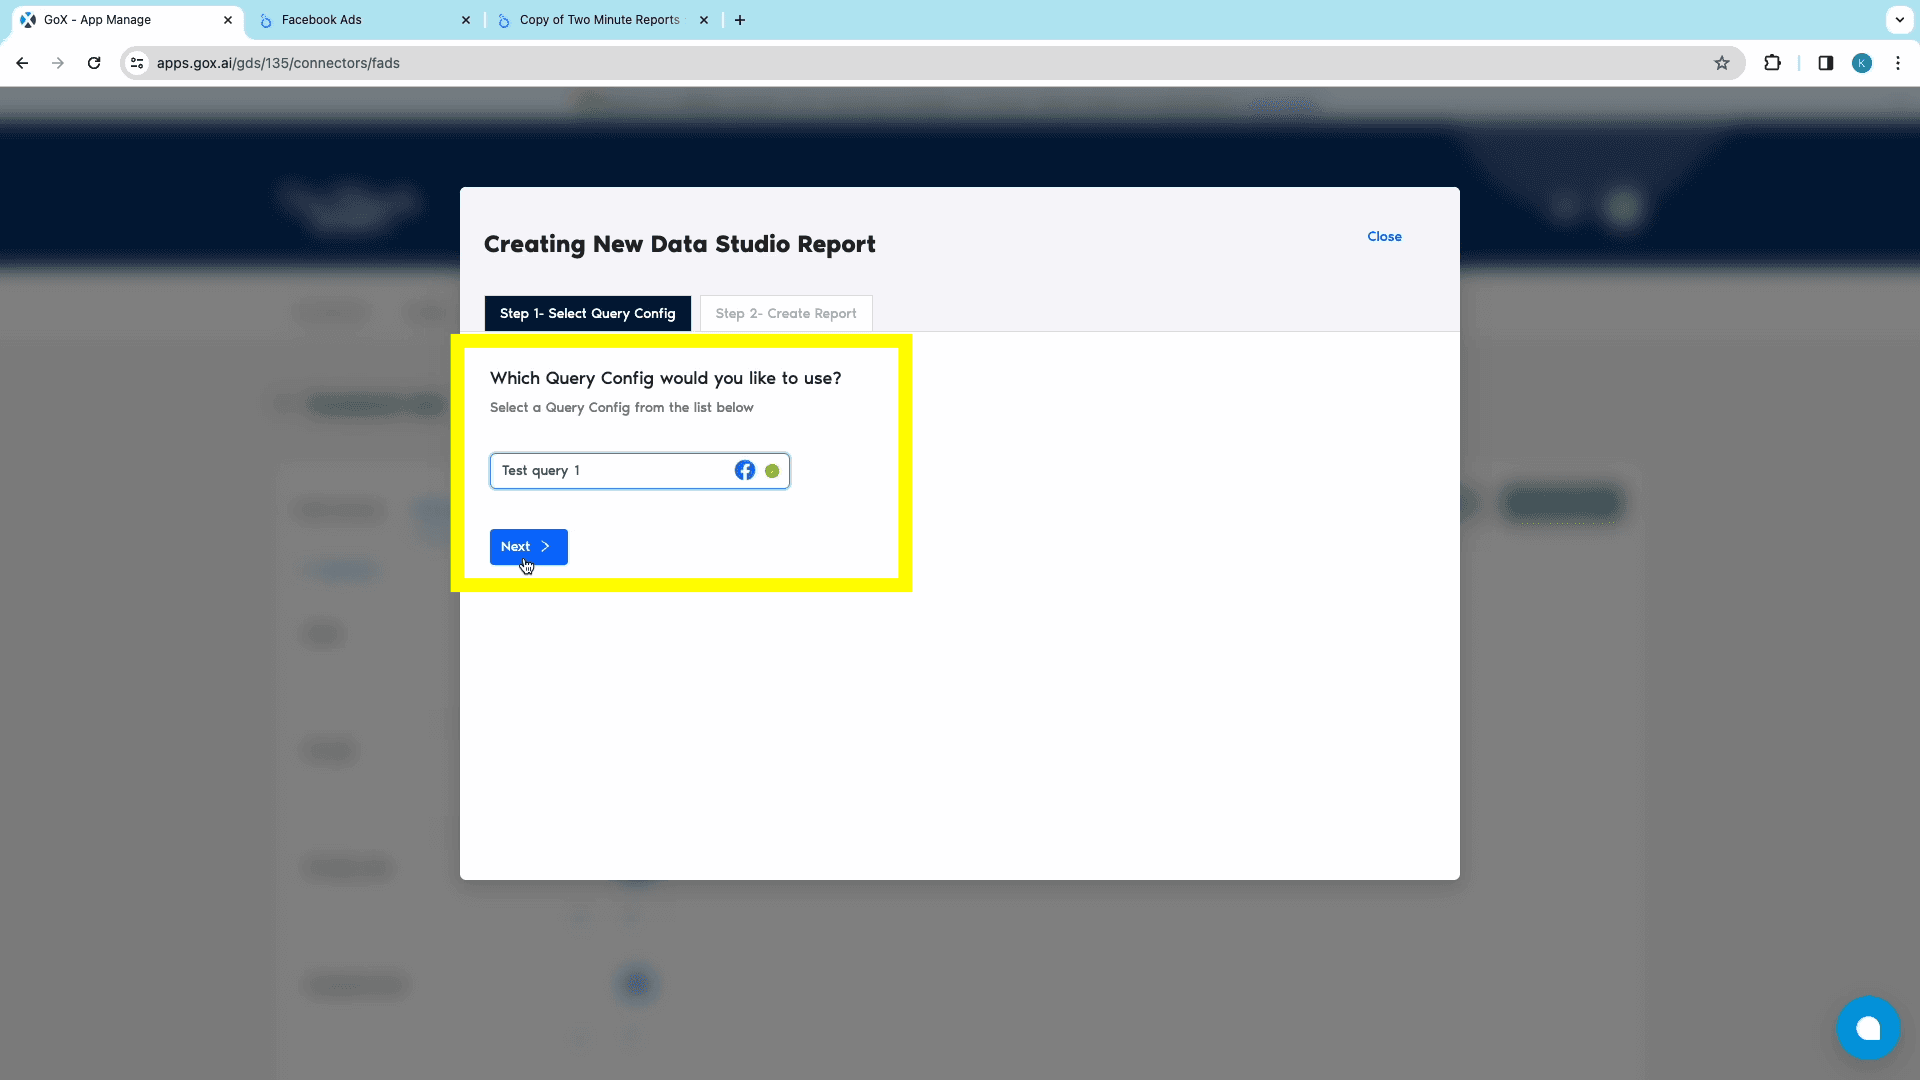
- From this window, choose the relevant previously created Query Config from the search bar, and click on the Next button.
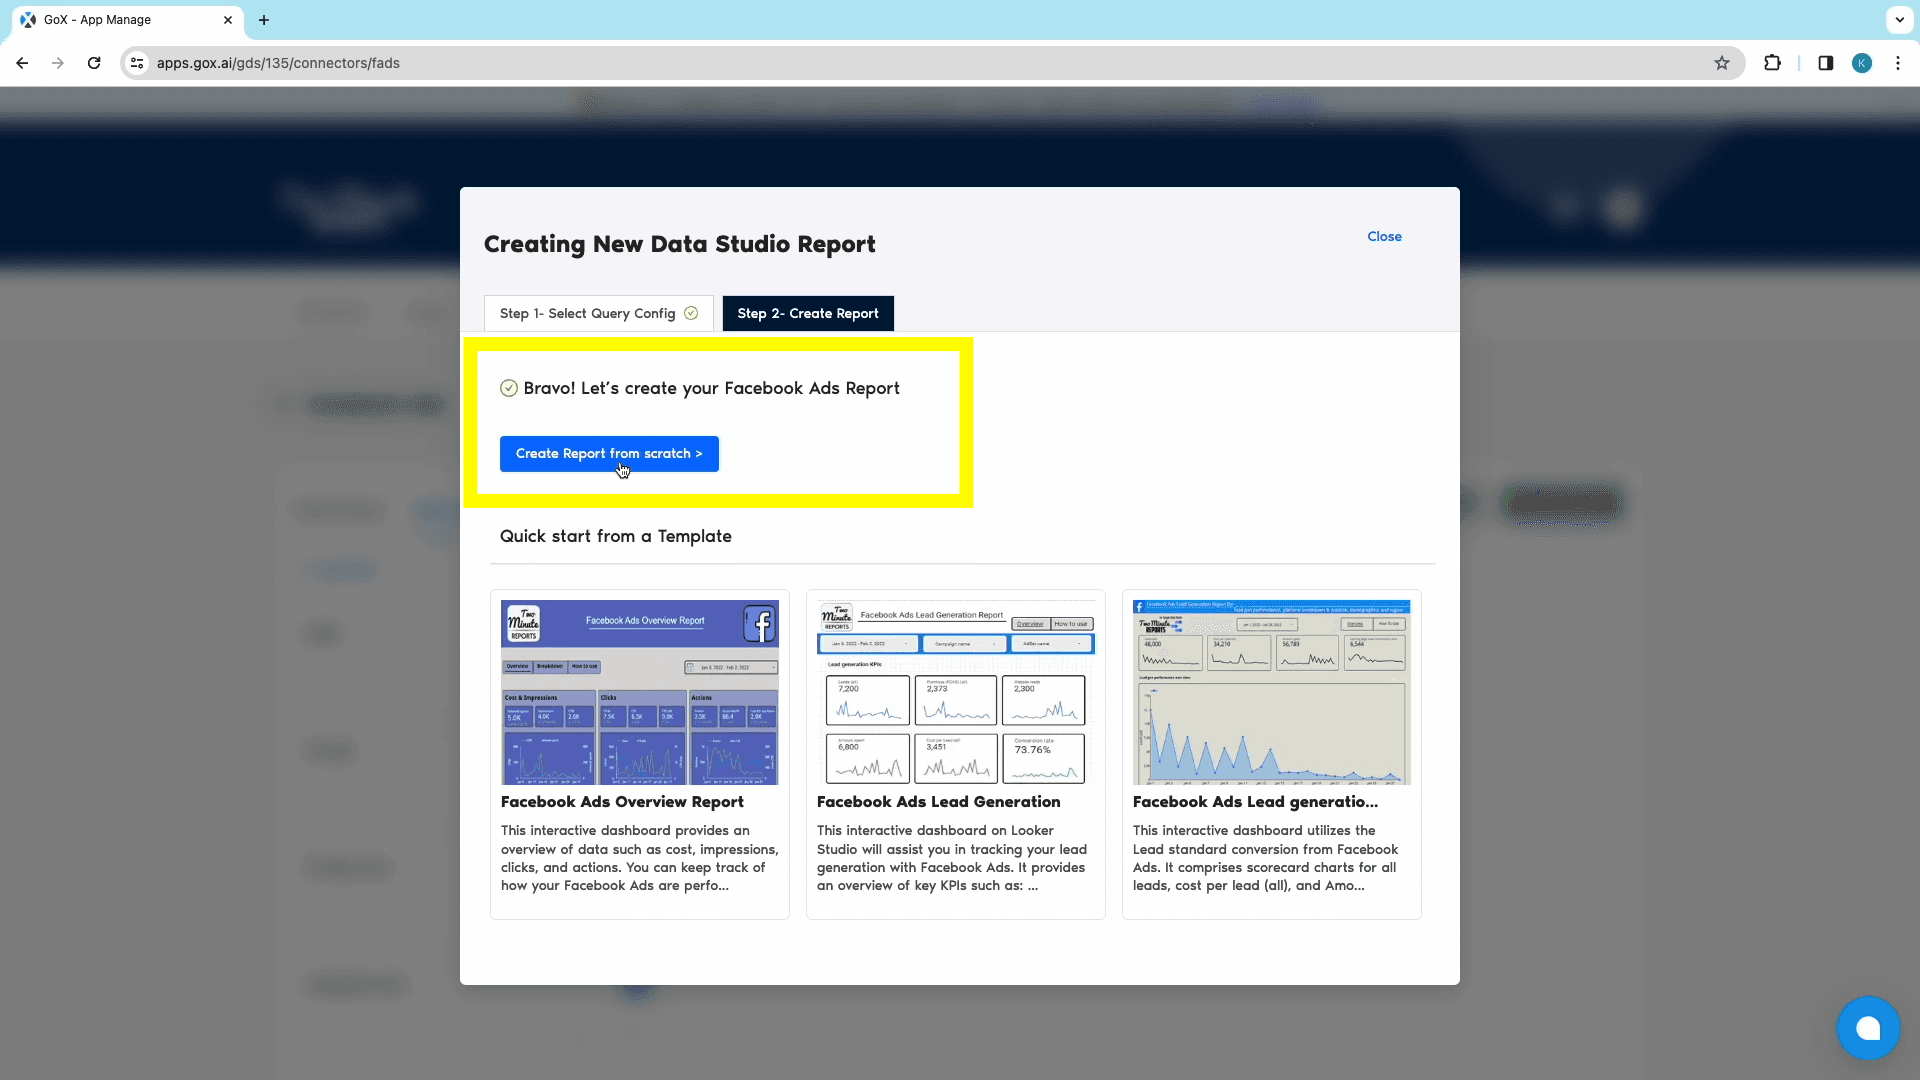
- From the next Create Report tab, click on “Create Report from scratch” to open Looker Studio.
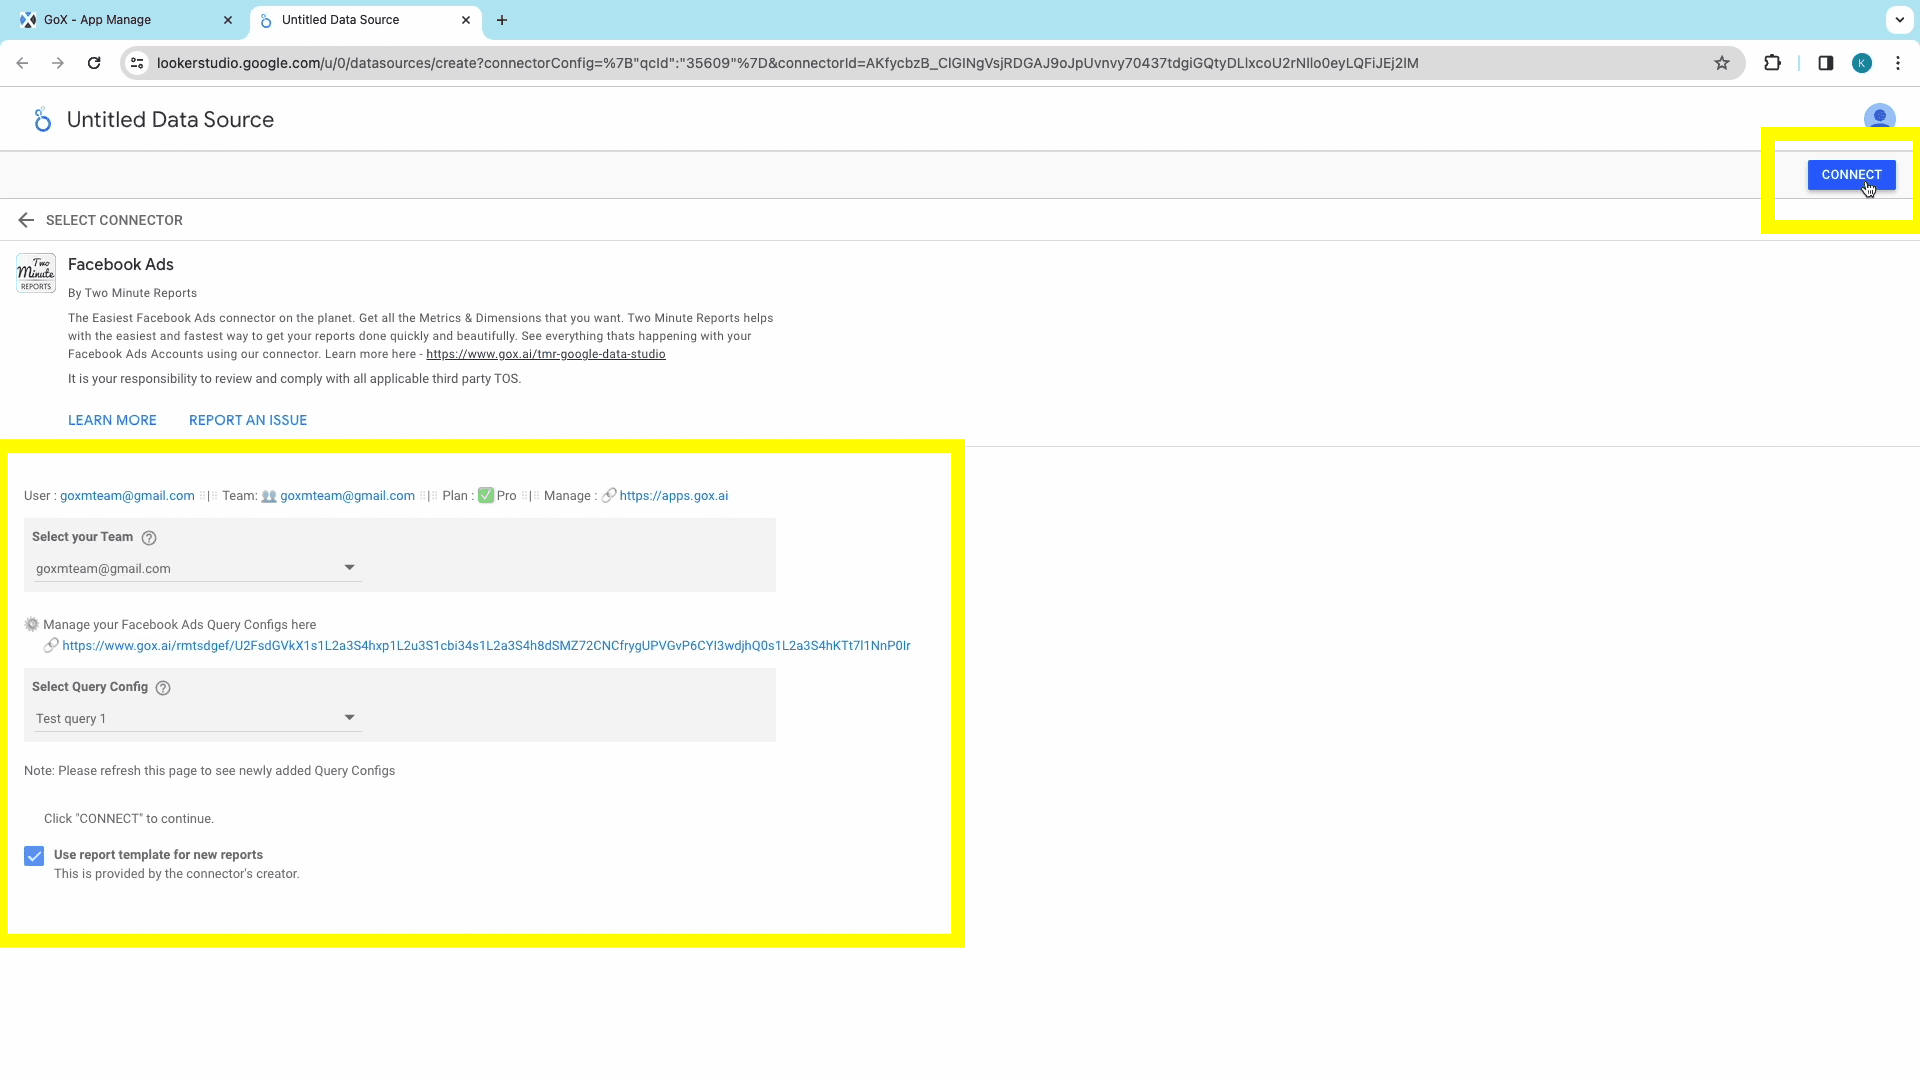
- Once Looker Studio opens up, choose the relevant team. Ensure that “Use report template for new reports” is checked. Once done, click on Next to continue.
- Then, select the relevant Query Config for the data source and click on the Connect button at the top-right corner. This step connects TMR to Looker Studio.
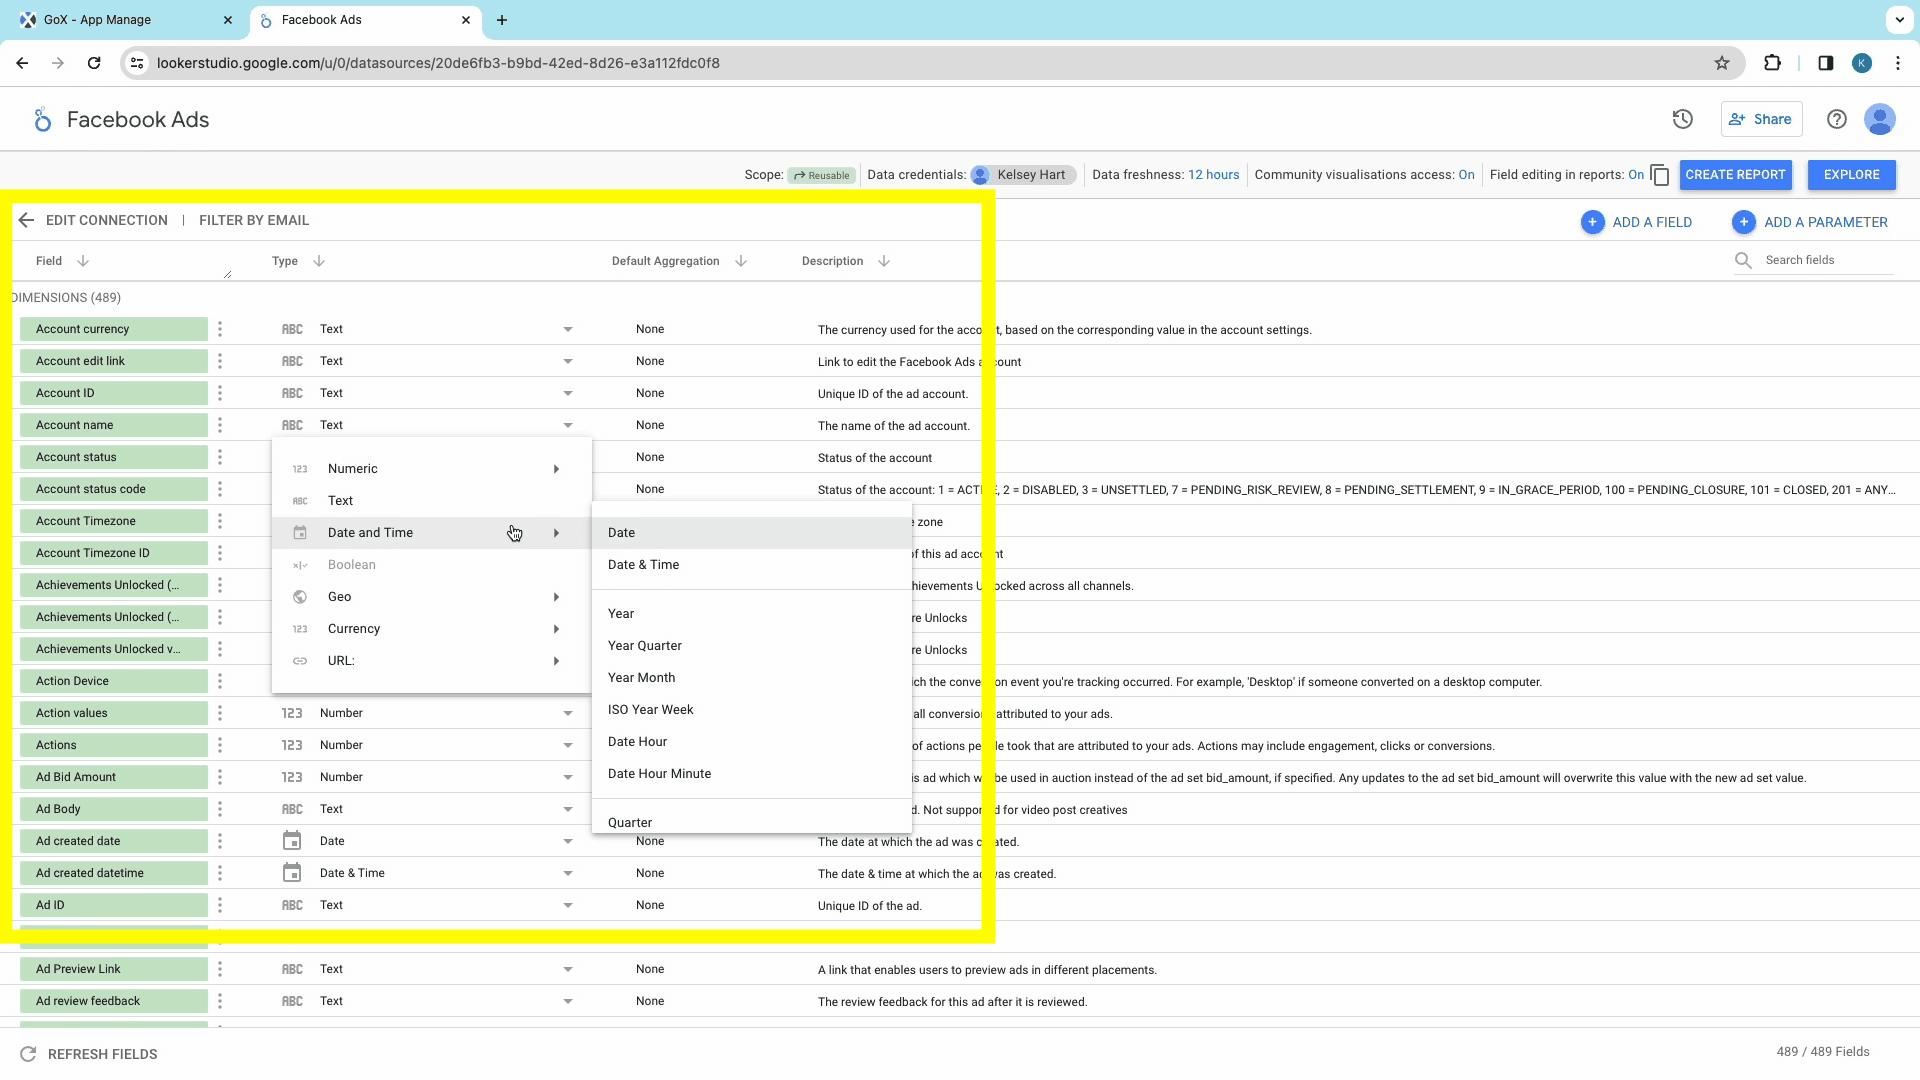
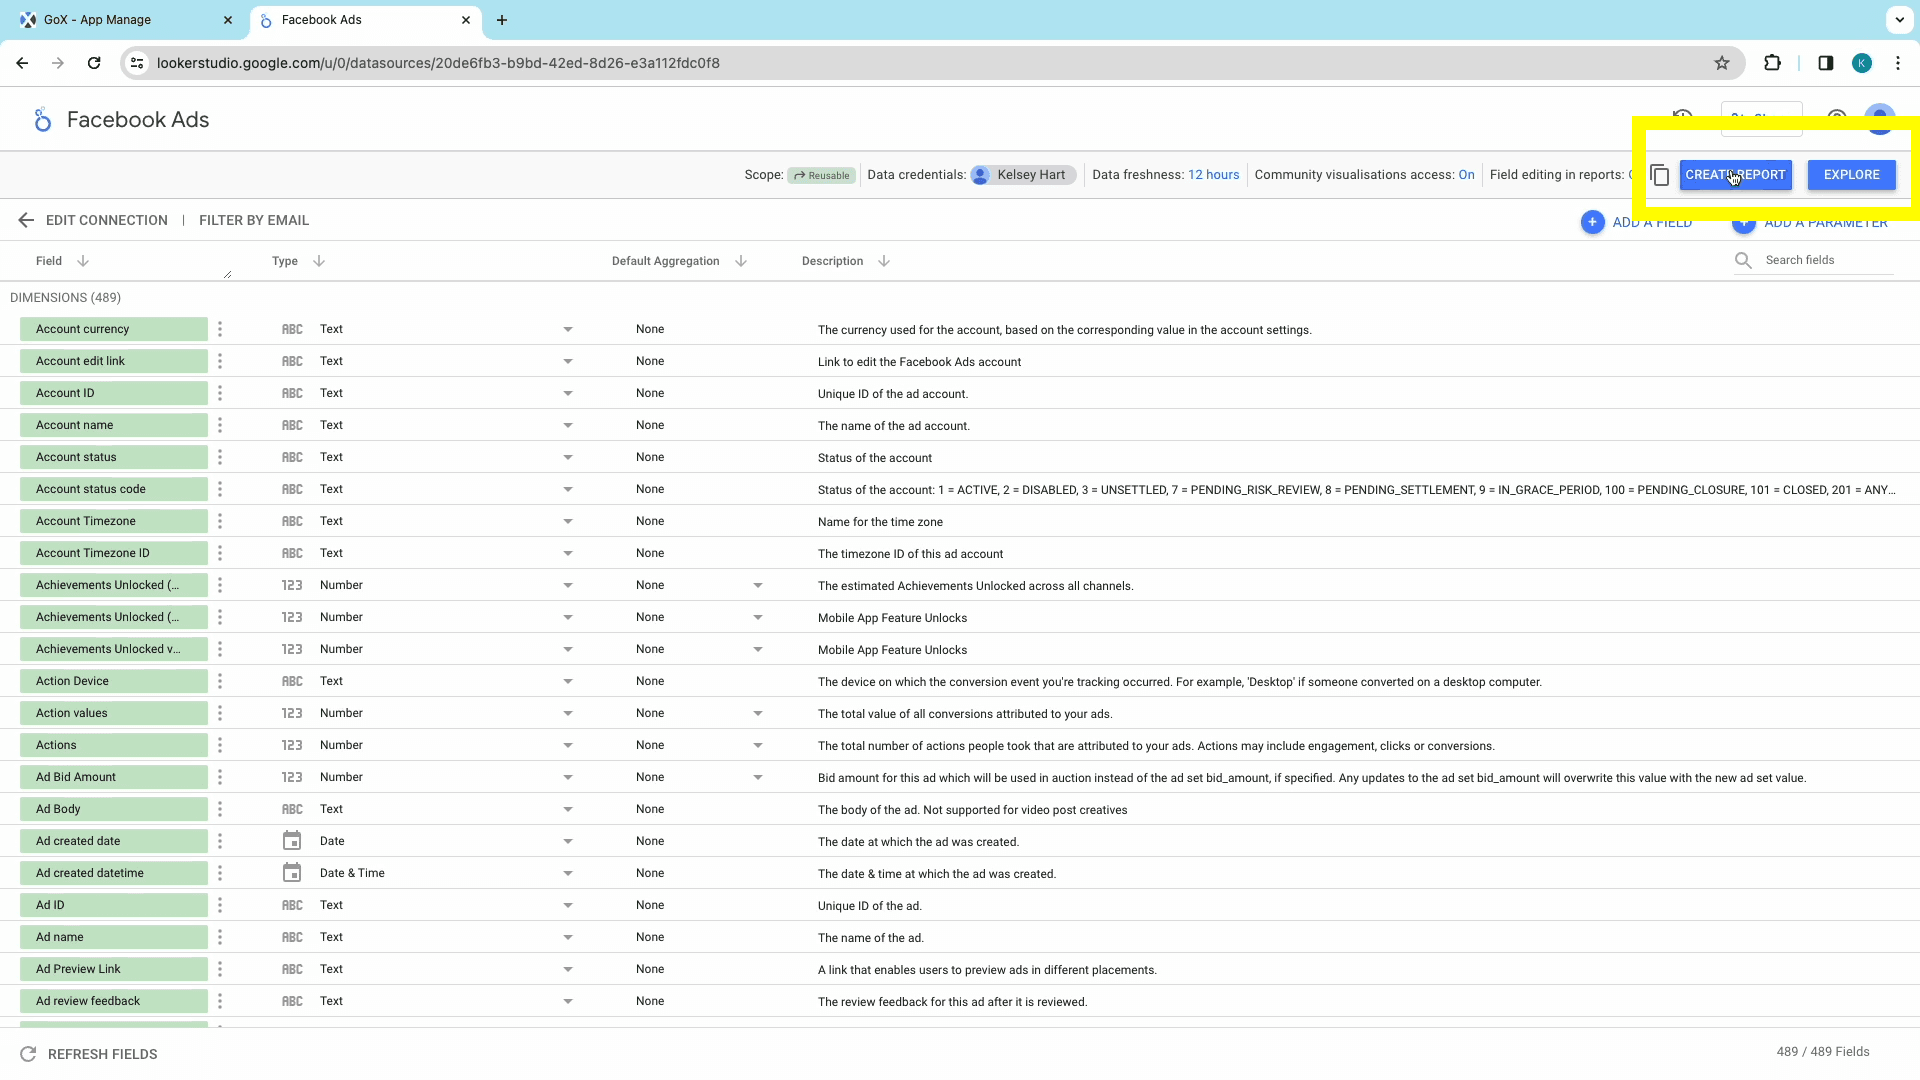
- The next window shows all the available Facebook Ads metrics, ready for the report. You can modify the metrics, or click on the Create Report button at the top-right corner.
- You’ll then be notified about the addition of new data to the Looker Studio report. Click on Add to Report to authorize the activity.
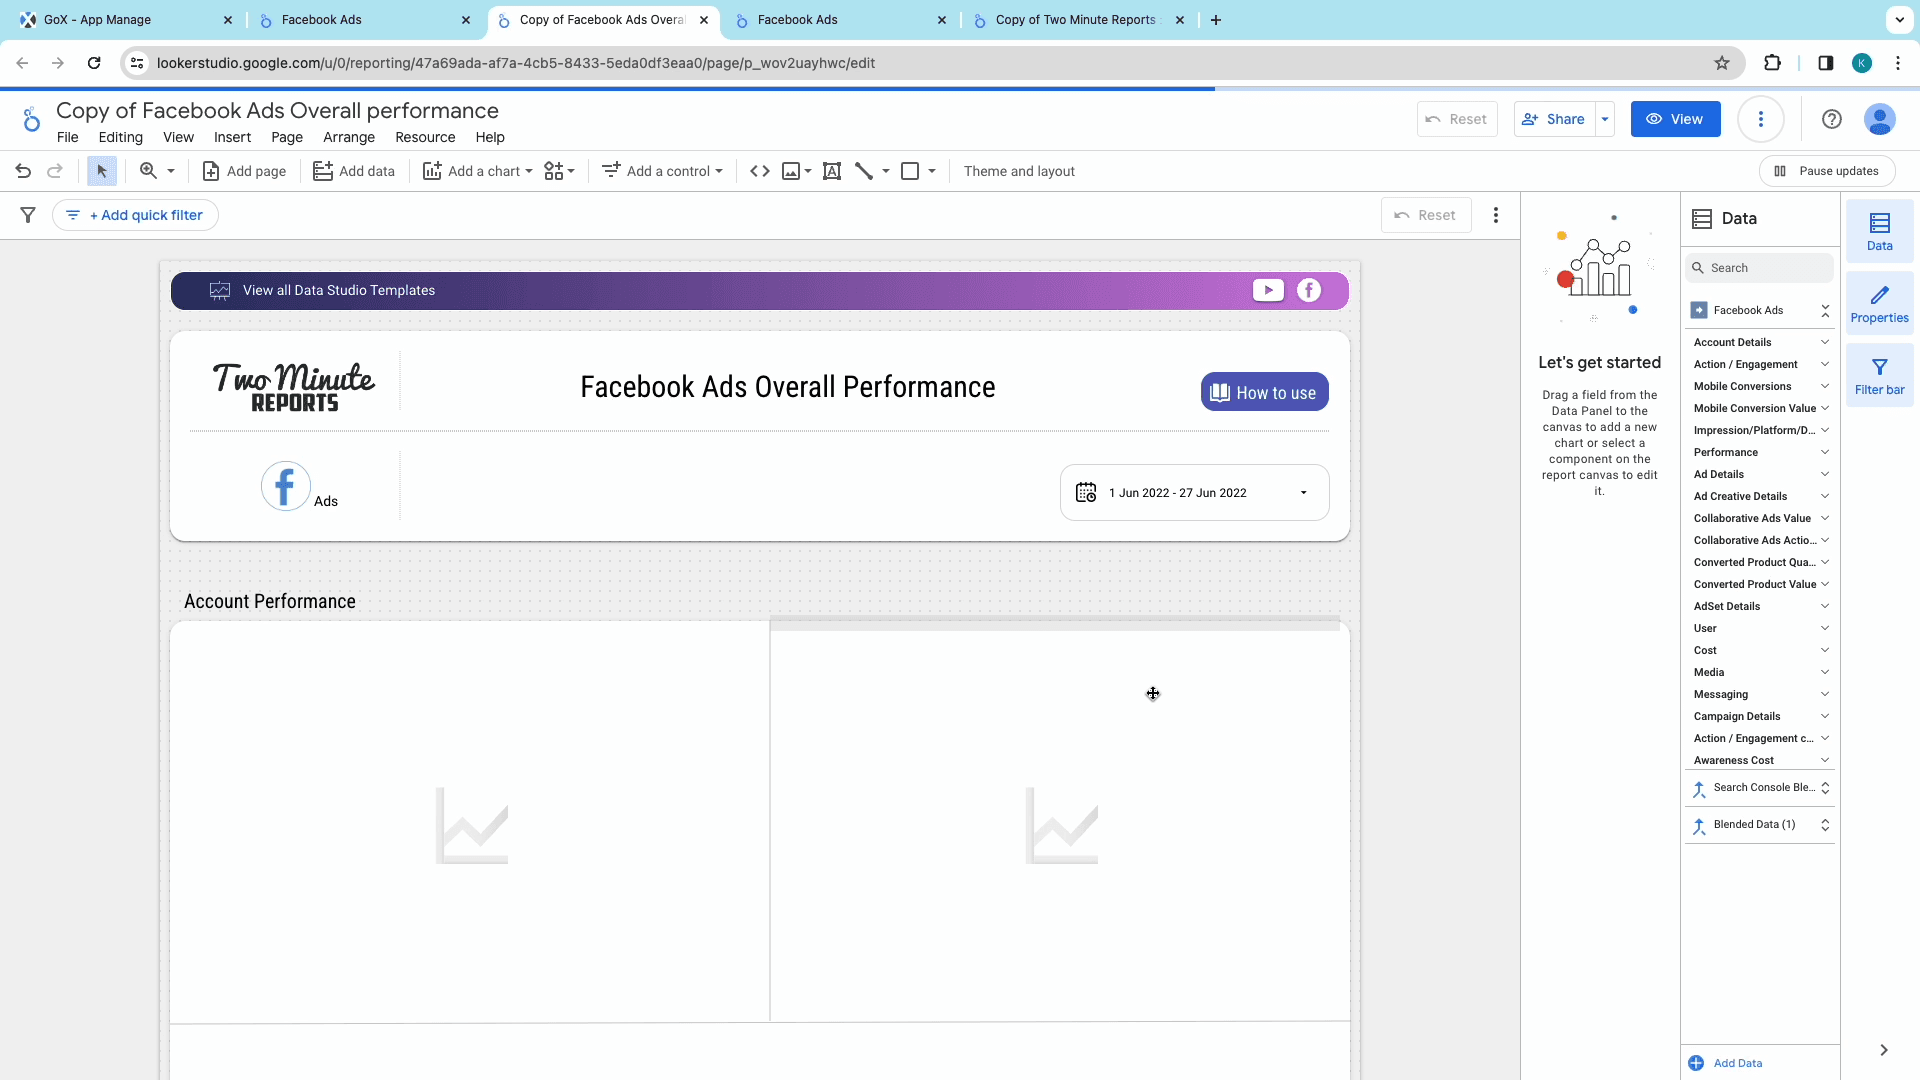
- You’re now at the Google Data Studio Dashboard, ready to build a report from scratch. All the metrics and dimensions that you might need will be available in the sidebar to add to the report.
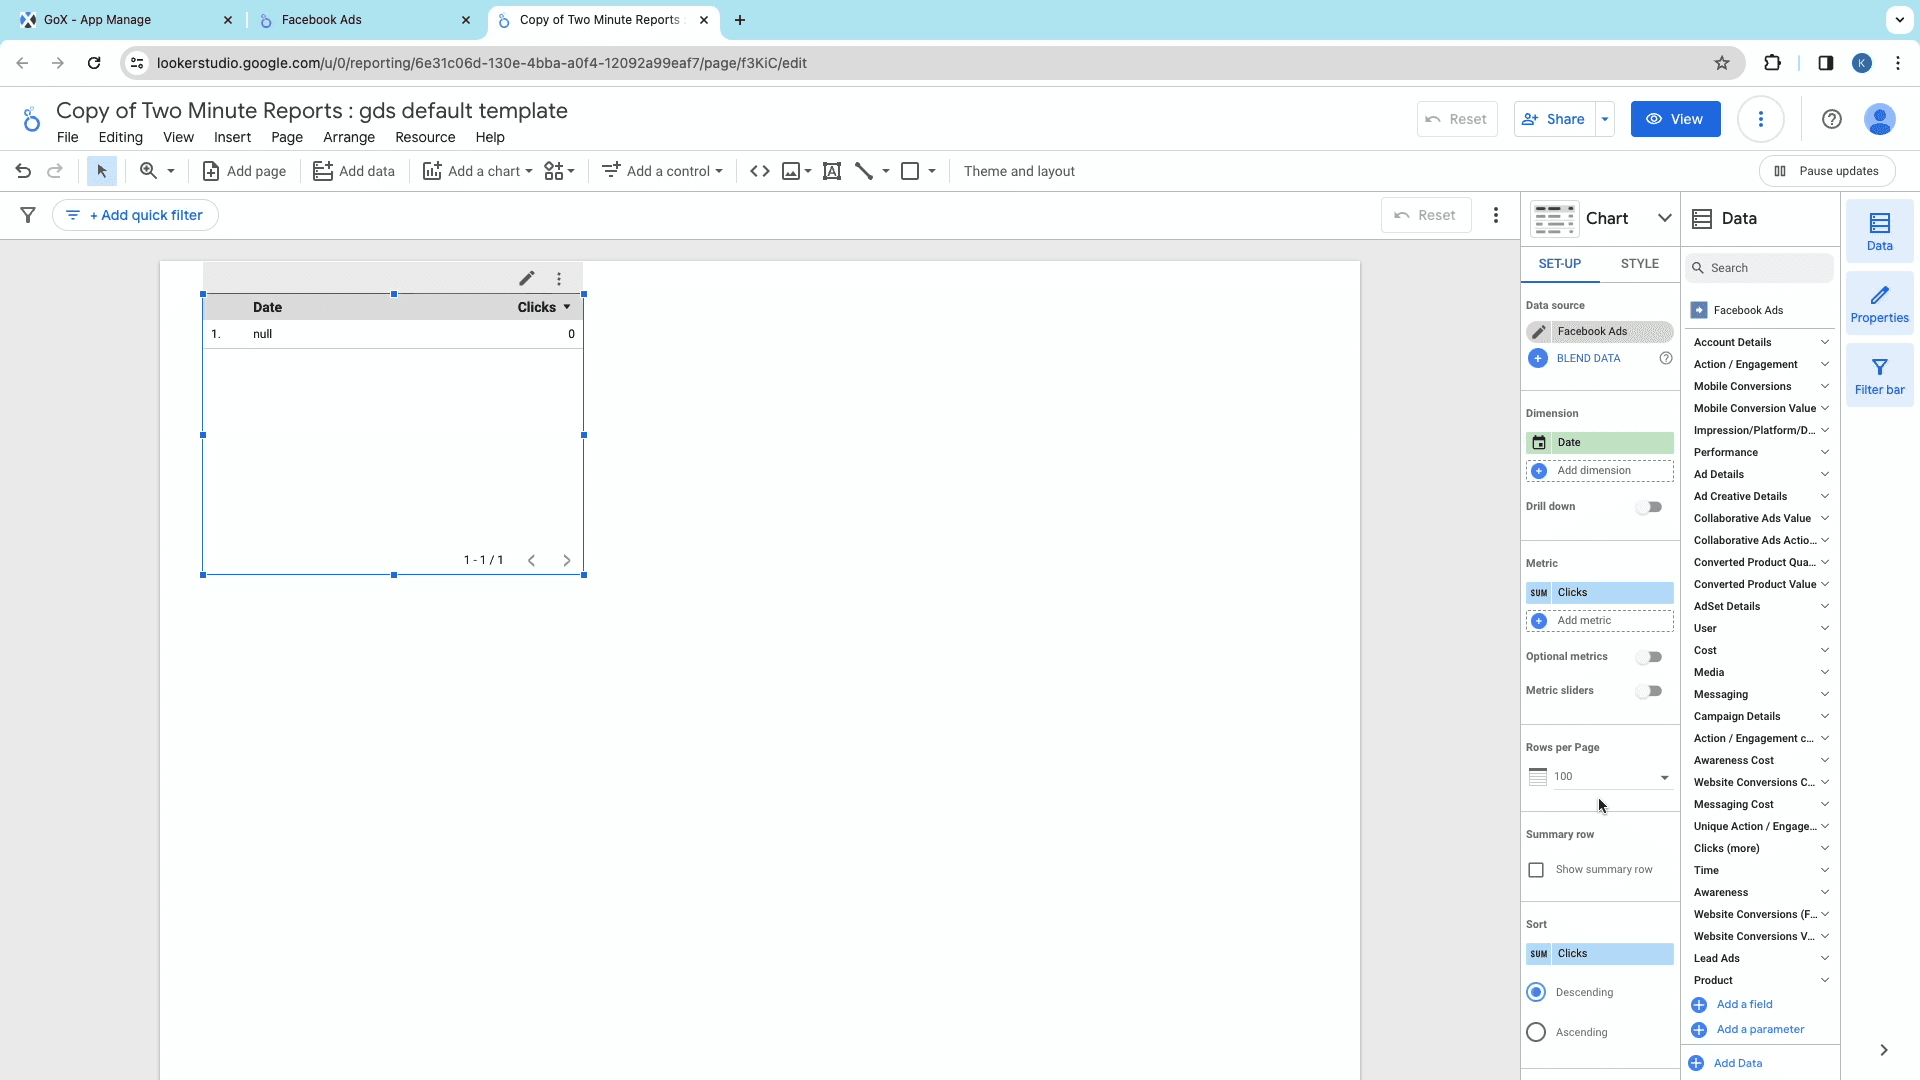
To create a table/chart with a particular metric:
- Create a table or chart at the desired position.
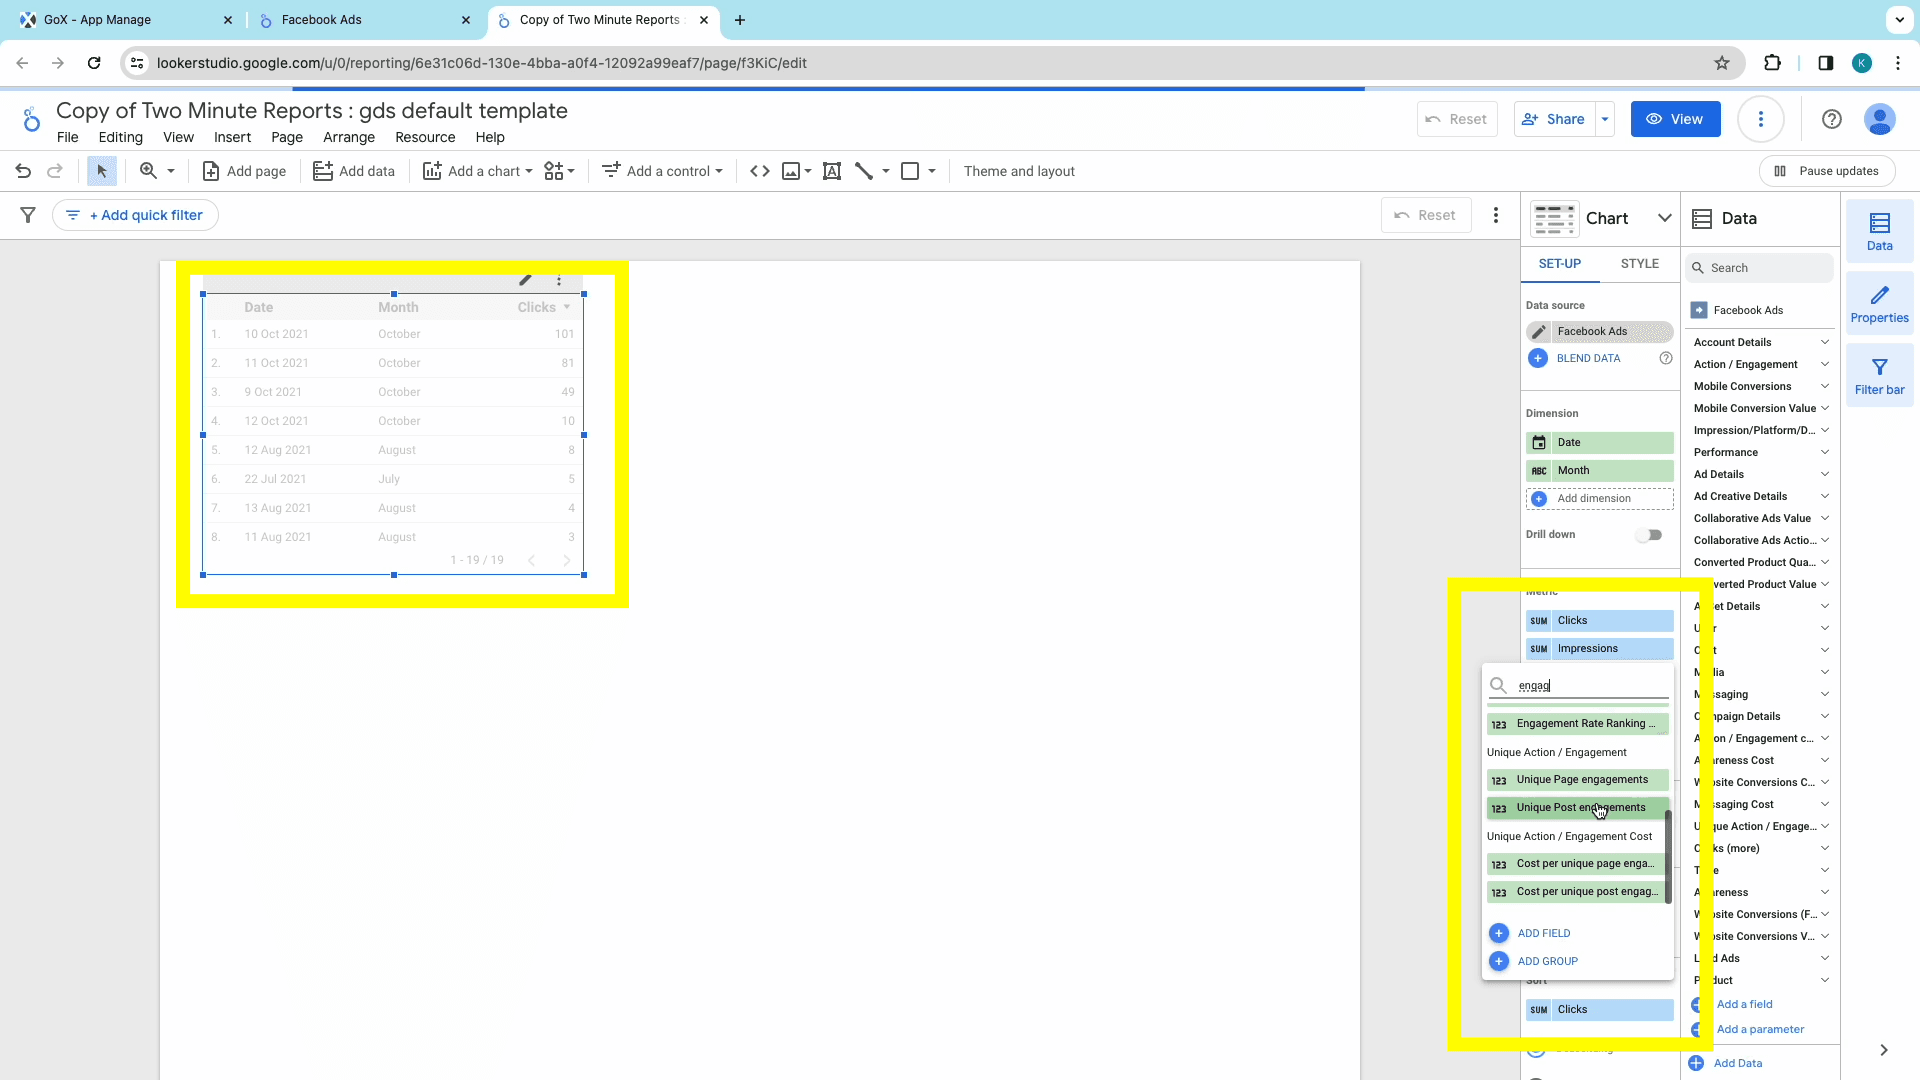
- With the table/chart selected, choose the metrics that you need in your report. Make sure to explore the various categories in the “Metrics” dropdown menu to explore all the metrics available for your report.
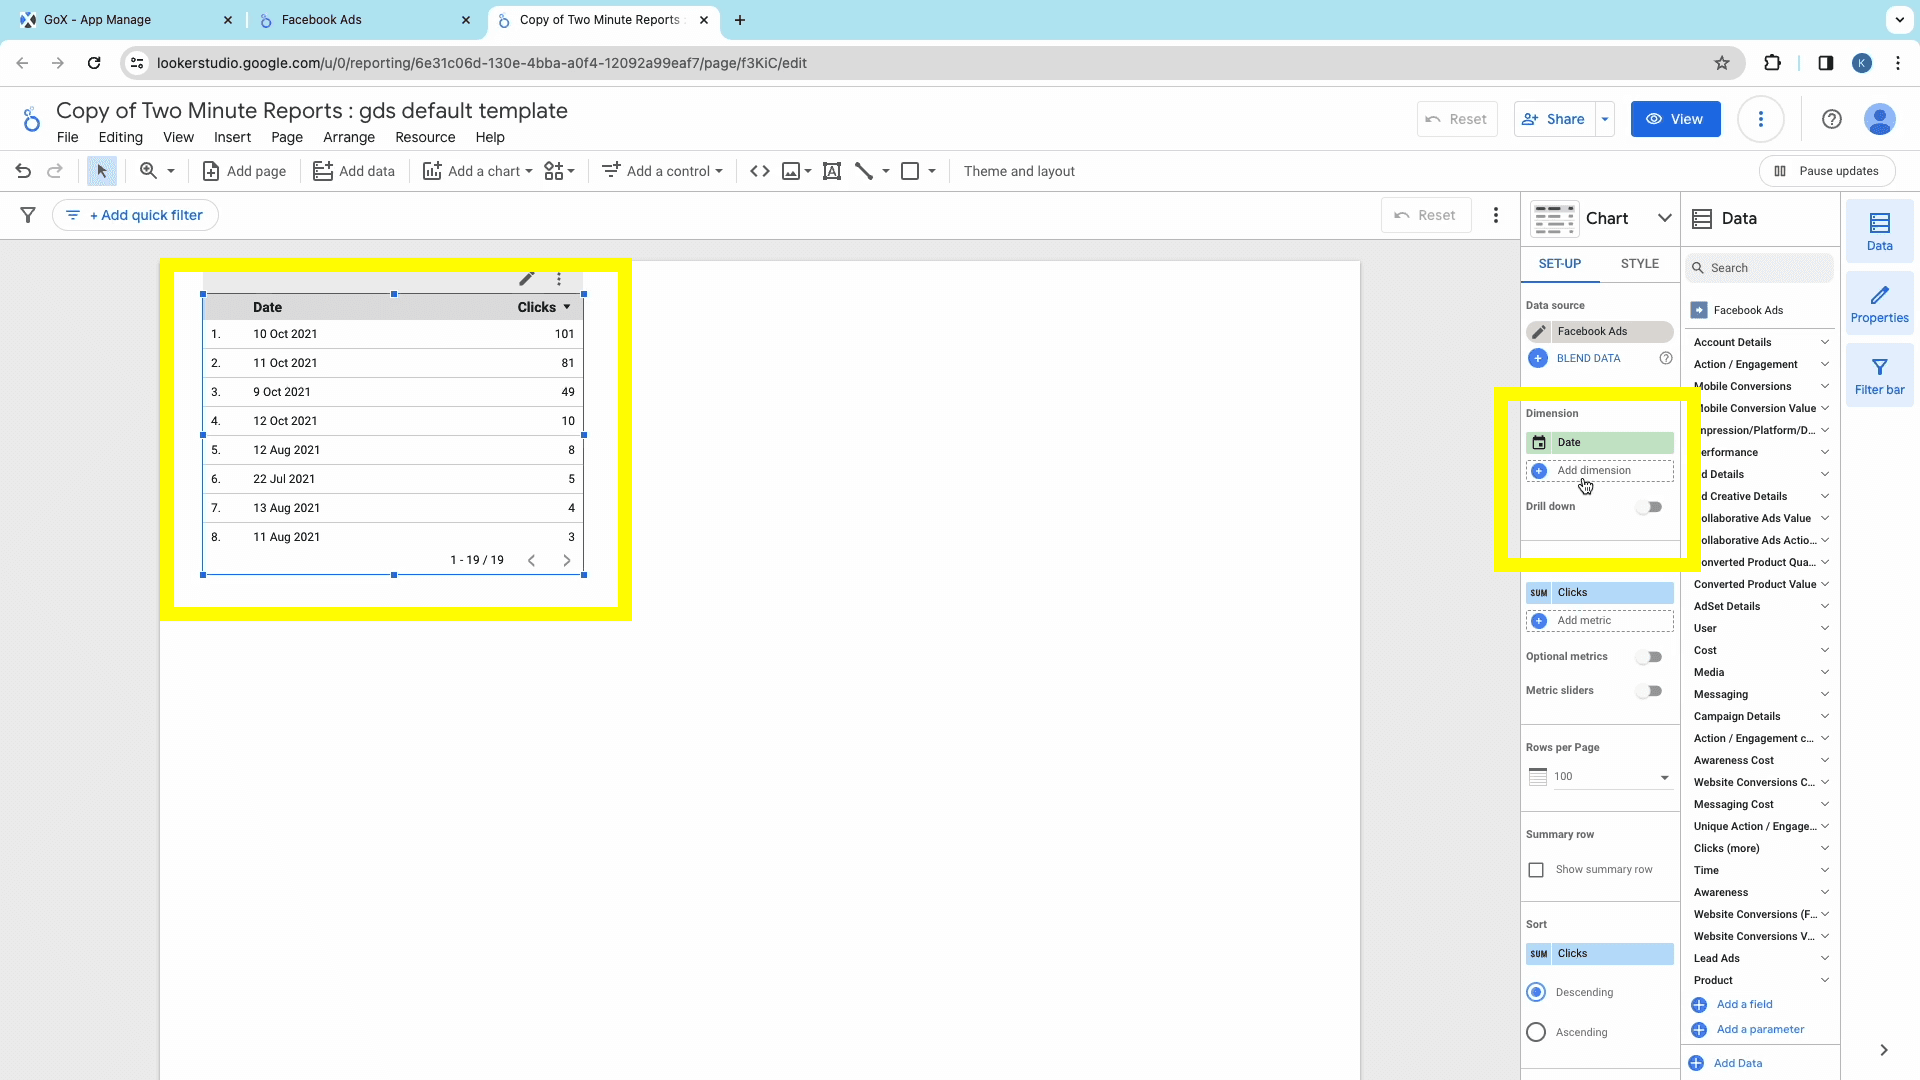
- Next, we set the dimensions of the report. Choose the right dimensions to add to your report, under the categories in the “Dimensions” dropdown menu.
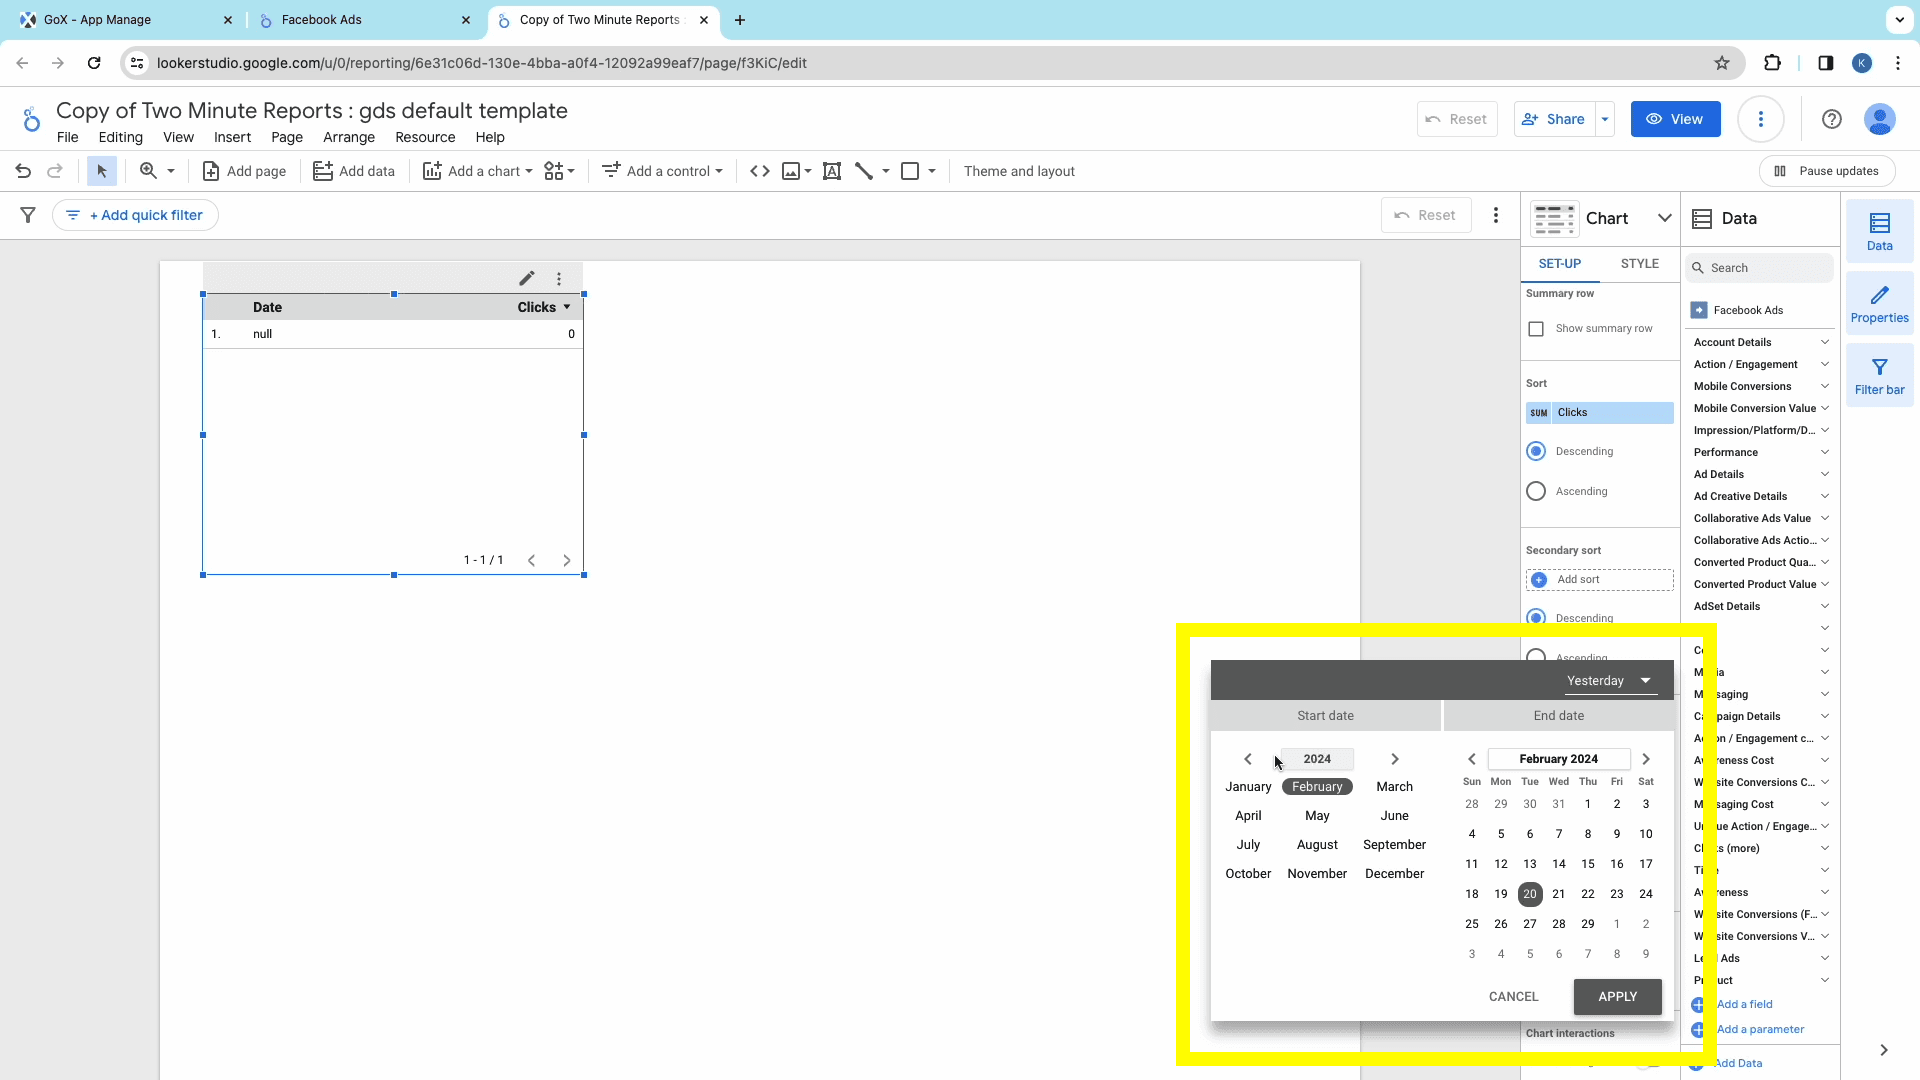
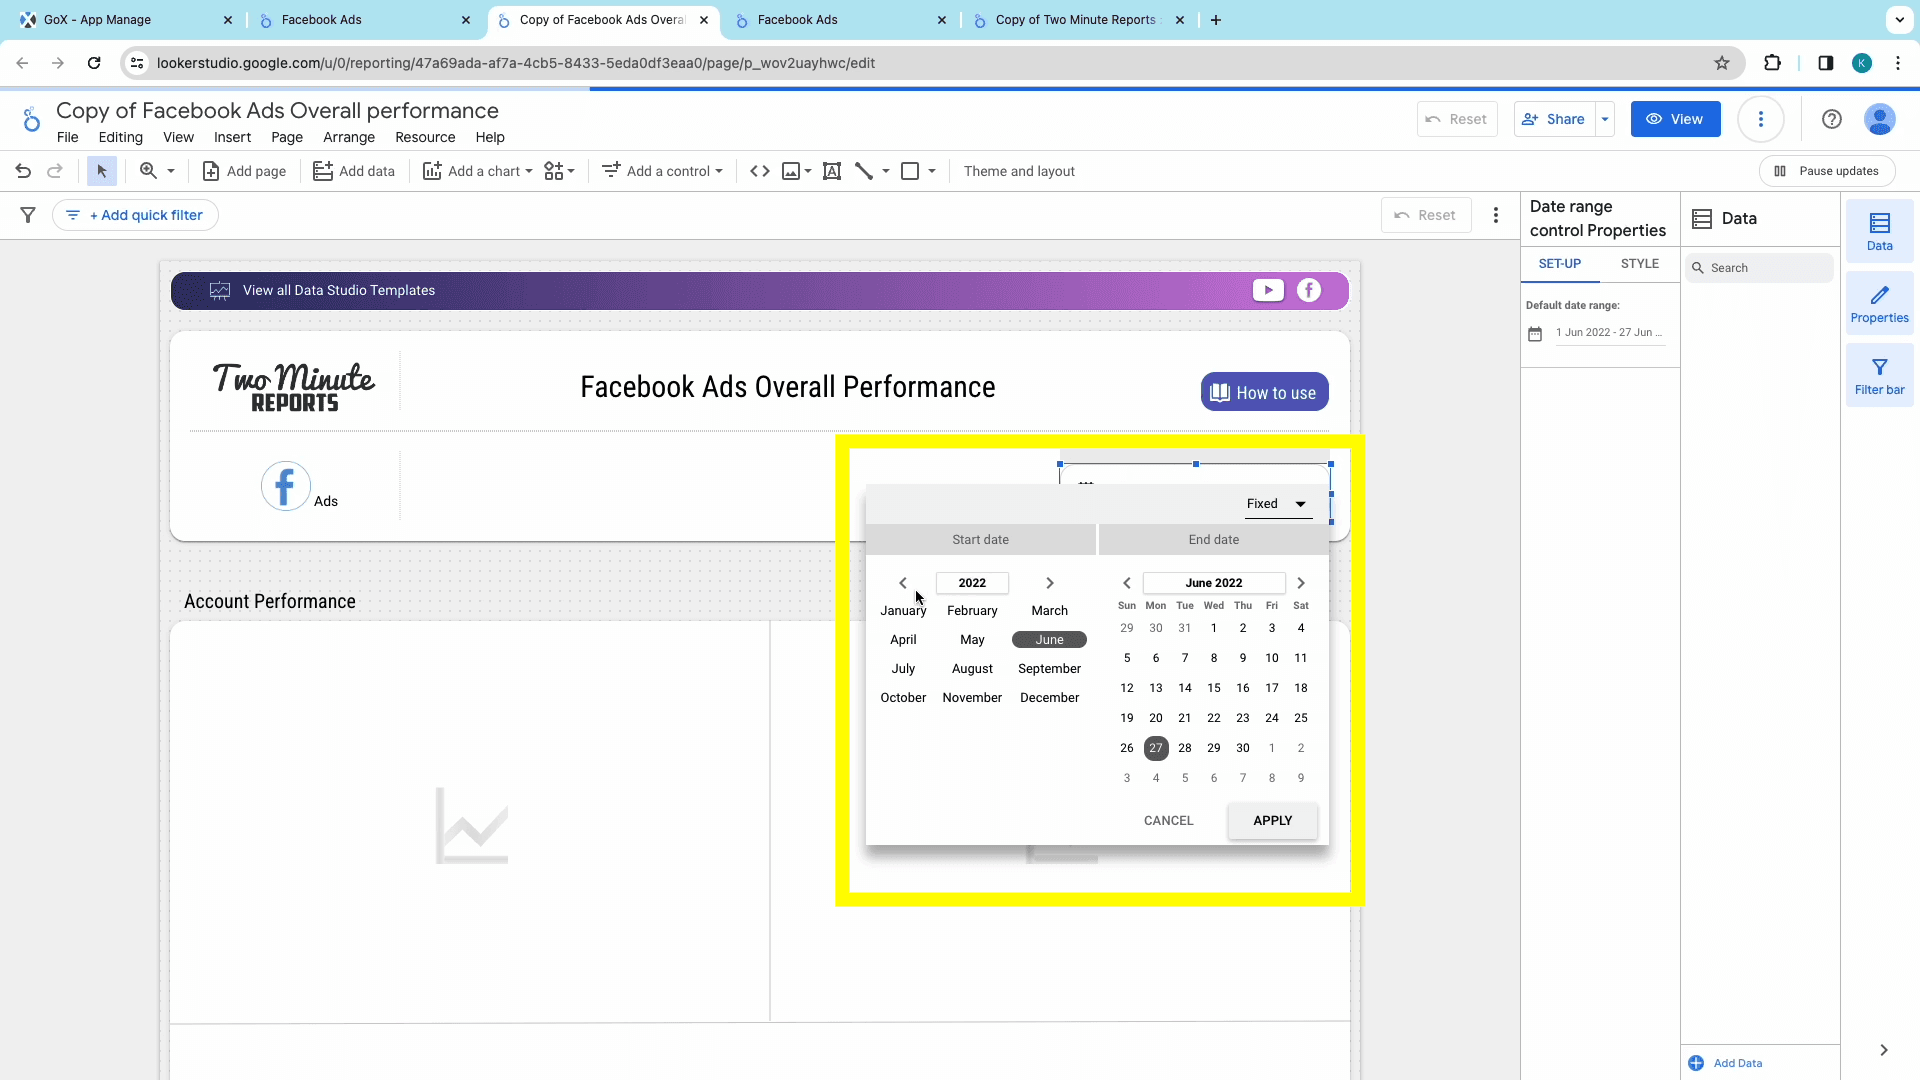
- Then, you set the date range: either the preset date ranges, or your custom date range from the sidebar.
You can repeat the same steps to add the required tables/charts to the new report.
Method 2: Creating a Facebook Ads Dashboard using templates
Two Minute Reports has a gallery of templates: preset dashboards combining relevant marketing data for specific use cases. Every template is crafted by analysts and marketers for specific purposes. They also reduce the time spent on the report editor, manually creating charts, tables, and graphs.
Two-Minute Reports Templates
TMR’s templates enable reports to combine the right metrics and dimensions and present them visually within minutes.
To create a Looker Studio dashboard using templates, follow Steps 1 and 2 from the previous method.
Step 3: Creating the Looker Studio report
- After adding the data source and configuring the queries, click the green “Create Report” button to open the “Creating New Data Studio Report” window.
- From this window, choose the relevant previously created Query Config from the search bar, and click on the Next button.
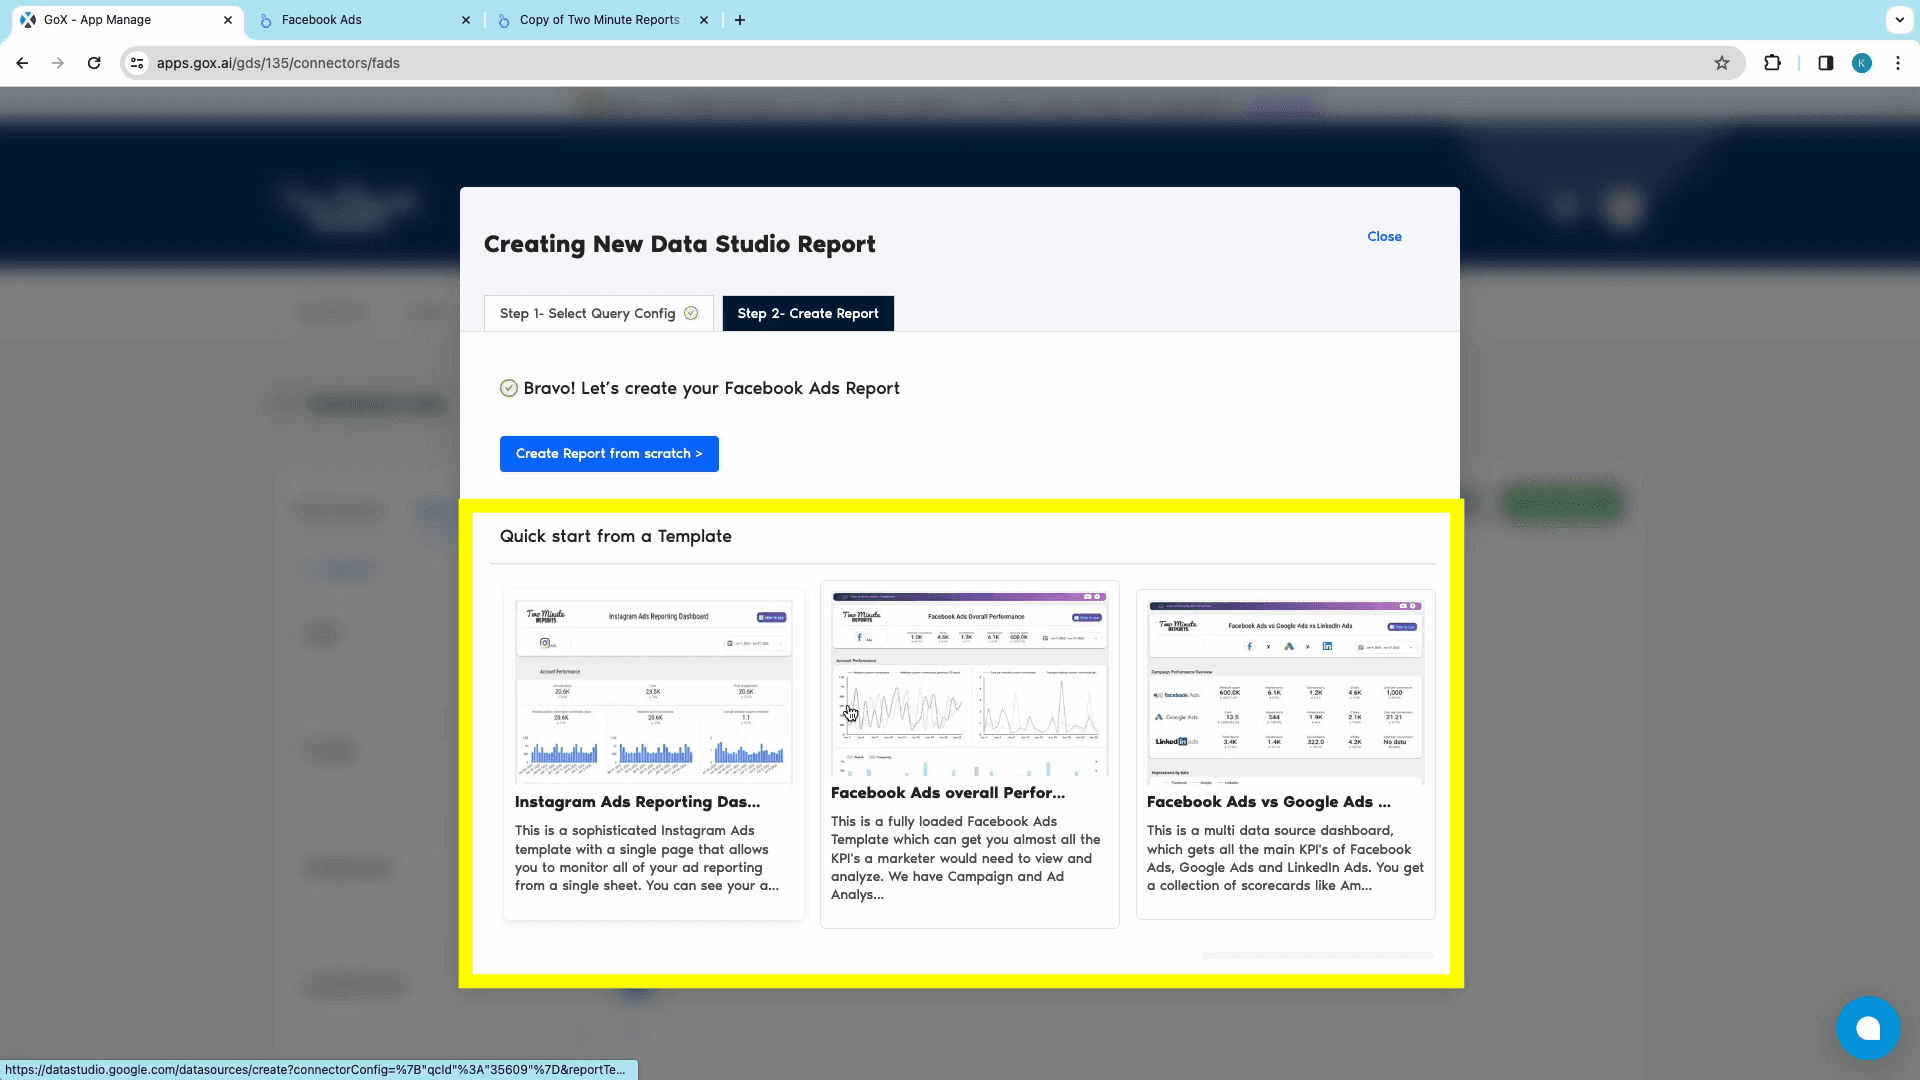
- From the Create Report tab, you can explore TMR’s templates from the Template Gallery. Once you’ve selected the required template, click on it to open Looker Studio.
- Once Looker Studio opens up, choose the relevant team and check the box next to “Use report template for new reports”. Click on Next to continue.
- Then, select the relevant Query Config for the data source and click on the Connect button at the top-right corner. This step connects TMR to Looker Studio.
- The next window shows all the available Facebook Ads metrics, ready for the report. You can modify the metrics, or click on the Create Report button at the top-right corner.
- Next, authorize the data export activity and complete creating the report with preset tables and charts with your metrics.
- Set a date range from the dashboard to display the relevant data. You can choose from some of the preset date ranges like “Last 7 days” or “Last Month”, or set your custom date range from the drop-down calendars.
And like that, you’ve created your Facebook Ads report on Looker Studio. You can modify the tables/charts, metrics, and dimensions from the TMR Sidebar , and schedule reports to your email to collect data and make timely optimisations.
Start using these quick templates for looker studio now
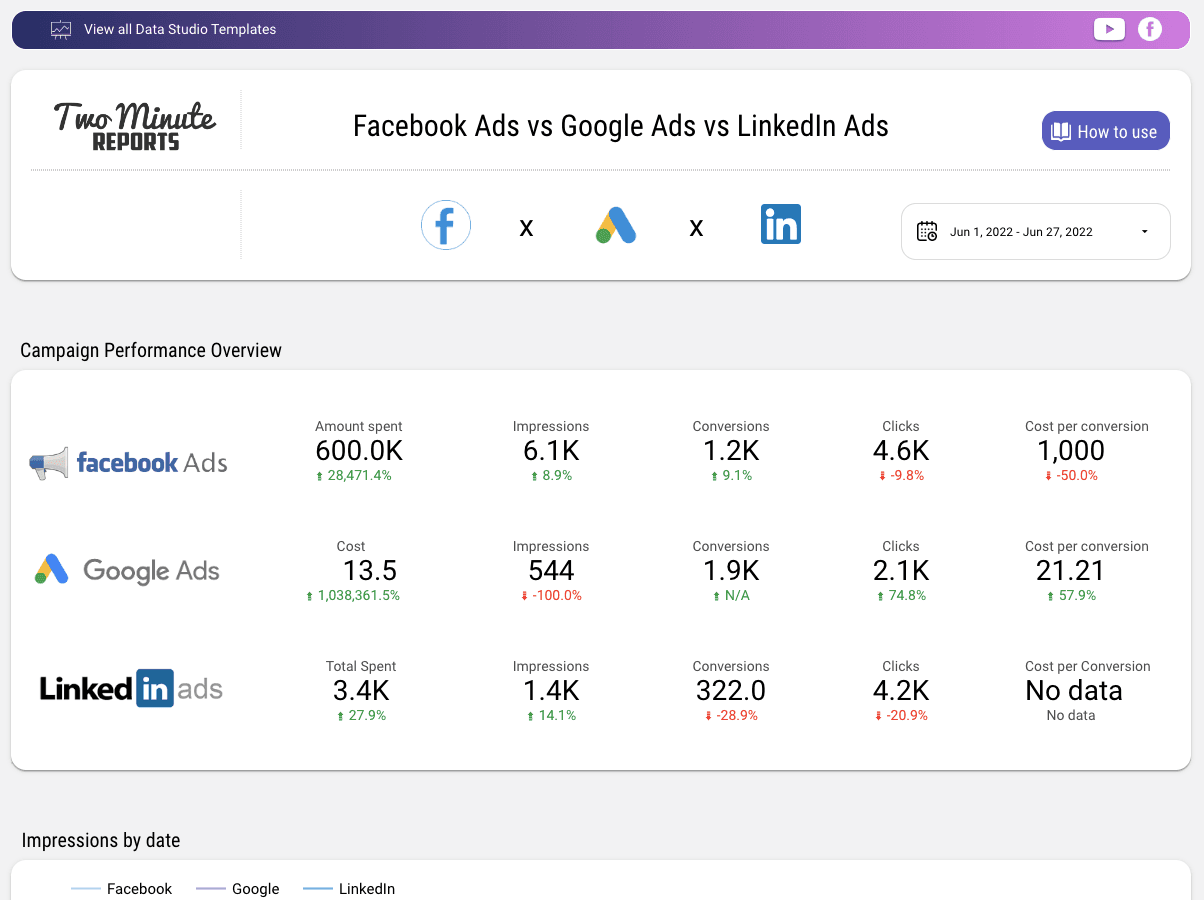
1. Facebook Ads vs Google Ads vs LinkedIn Ads
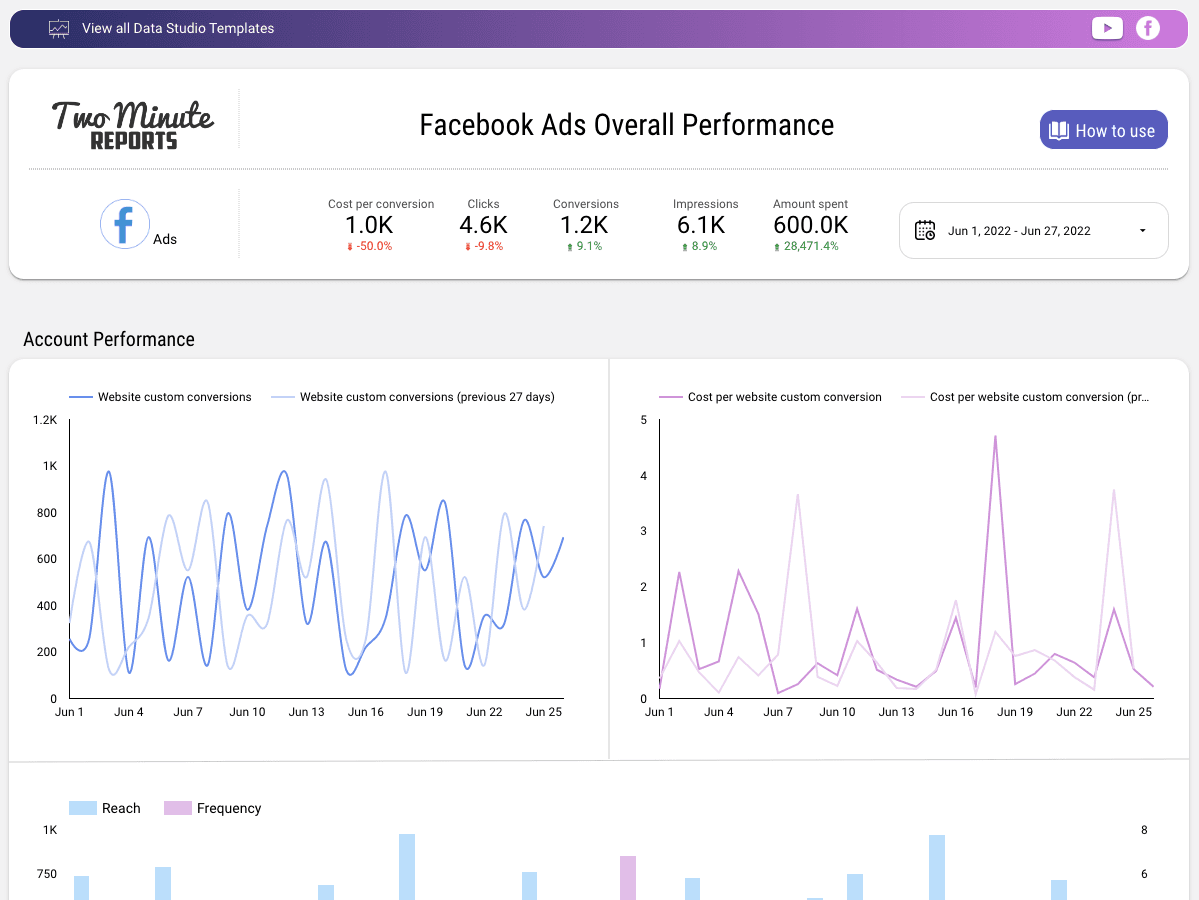
2. Facebook Ads overall Performance
Why connect Facebook Ads to Looker Studio?
Google Looker Studio (formerly Google Data Studio) is a popular, open-source, tool for report creation and data analysis. The interactive dashboards and the easy-to-use interface enable business owners, analysts, and marketers to stay ahead of multiple sources.
Ease of Use:
Looker Studio’s user-friendly interface requires minimal technical expertise. With just a few drags and drops, this coding-free tool helps make complex data manipulation and visualization simpler.
Data Connectivity:
With a connector like Two Minute Reports, one can integrate over 75 popular platforms, right from web analytics, to social media platforms. Creating a Looker Studio dashboard with TMR eliminates manual data imports and ensures that your data is up-to-date.
Visualization Variety:
With Looker Studio’s robust array of graphs, charts and other visual aides, you can effectively communicate and visualize data for all functions. You can create bar charts, line graphs, pie charts, maps, and much more to match your preferences.
Comprehensive Analysis:
Insightful Metrics and Collaborative Accessibility are key benefits when using Looker Studio to manage your website/app’s performance. You can dissect and analyze data, compare them, and create custom metrics that align with your business goals.
Collaborative Access:
Building a Looker Studio Dashboard also allows for seamless collaboration between functions in your organization. The ease of accessibility allows teams to work together with real-time data, fostering a highly collaborative environment.
Customization and Flexibility:
Importing Facebook Ads data into Looker Studio allows you to customize your reports according to your specific needs. Looker Studio also enables proper representation of the metrics and dimensions that are most relevant to your business goals. Looker Studio also allows scheduling reports to be delivered to your email automatically. This ensures constant real-time data, and avoids frequent check-ins.
Workflow Efficiency:
Setting up automated workflows to channel data from Facebook Ads to Looker Studio, effectively streamlines the data journey from source to analysis. This process ensures seamless synchronization enabling consistent workflow management.
Marketing Strategy Enhancement:
When you export Facebook Ads data into Looker Studio, you can conduct multi-channel analyses to simultaneously evaluate performance across multiple channels. This approach enables you to make data-driven decisions that enhance marketing performance.
Top used KPIs of Facebook Ads in Looker Studio
To ensure the most ROI from your Facebook Ad campaigns, it’s absolutely necessary to incorporate a strong strategy- strategy which arises from data, and market trends. Embrace this powerful synergy between Facebook Ads and Google Looker Studio to make data-driven decisions that propel your marketing strategy to new heights!
Below are the top metrics that could determine the success of your marketing efforts!
Cost
When managing Facebook Ads, it's crucial to focus on various cost metrics. Keep a close eye on your ad spend, ensuring efficiency by monitoring metrics like:
- CPM and CPC (Cost per Click) for all link clicks.
- CPP (Cost per Purchase)
- Cost for Unique Link Clicks.
- Cost per Conversion
- Cost per Action
Performance
Elevate your Facebook Ads performance analysis by tracking key metrics like:
- Impressions
- Reach
- Clicks
- Conversions and Conversion Values
- Actions
- Quality Ranking (relevance and effectiveness of ads)
You can also assess the ROI from your ads by evaluating the Purchase ROAS (Return on Ad Spend).
Clicks (More)
Gain a deeper understanding of ad engagement through Facebook's Clicks metrics like:
- Link clicks
- Unique Clicks
- CTR (Click-through Rate)
- Outbound Clicks
Action / Engagement
These metrics to track actions and engagement on your content, to gain insights on your page’s social media performance, product pages effectiveness, and overall marketing strategy.
- FB Lead Ads Data
- Comments
- Shares
- Reactions
- Added-to-Cart
- Checkouts Initiated
Website Conversions (Facebook Pixel)
Utilize Facebook Pixel to track key website conversion metrics to gain a deeper understanding of campaign effectiveness and to improve operations. Track metrics like:
- Landing Page Views
- Website Purchases
- Leads
- Add to Cart
- Checkouts Initiated
- Completed Registrations
TMR also allows you to monitor Website Purchase ROAS to understand the value generated by your ads.
Campaign Details
Use these Facebook Ads Data points to explore campaign specifics, to craft comprehensive reports. With the following metrics, you can track and optimize your budget and reach your target audience effectively.
- Name
- Objective
- ID
- Status
- Budget Details (Daily/Lifetime)
- Start/End Dates
Action / Engagement Cost
Evaluate how efficient your Ad Spends and refine your campaigns using the following metrics:
- Cost Per Lead
- Add to Carts
- Checkout (across various channels)
- Cost implications of
- Link Clicks
- Post Engagements
- Registrations
Instagram Ads
Incorporate Instagram Ads data into your analysis for a holistic view of your social media advertising efforts. Assess the cost-effectiveness of
- Leads
- Purchases
- Key actions across Instagram and other platforms
Facebook Leads
Maximize lead generation, optimize ad spend, and enhance targeting strategies by adding the following metrics to your Looker Studio integration:
- Lead Source
- Demographics
- Interests
With these metrics, you can also adjust
- Campaign Settings
- Creative elements
- Follow-up strategies
This Looker Studio - Facebook Ads integration doesn’t just streamline data analysis; a strong report-making connector ensures that every Facebook Advertising aspect is meticulously monitored and optimized.
Get Google Analytics 4 data in Google Sheets too!

Two Minute Reports is also available as a Google Sheets add-on. This add-on is designed to simplify complex data analysis and visualization, making the best use of Google Sheets’ tools and features.
This add-on allows the creation of detailed reports and dashboards using insights from Facebook Ads without the complexity of manual data entry. TMR for Google Sheets also enables users to develop custom formulae in a user-friendly interface.
With a seamless Facebook Ads to Looker Studio integration, comprehensive analytical capabilities, and automated workflows, strategic business intelligence has just become quicker and more accessible.
Connect other Platform Data Sources with Google Sheets
Google Ads
Advertising platform for displaying ads on Google's search results pages.
Linkedin Ads
Professional social media platform's advertising data source.
Snapchat Ads
Social media advertising platform for Snapchat users.
Tiktok Ads
Advertisement data on the TikTok social media platform.
FAQs
What are data sources?
The Data source of a report is where you grab data for analysis, comparison, and decision-making. Determining and adding a data source is the first step for report creation.
What are Dimensions?
Dimensions are additional attributes of your website which provide information about it. For example, the “Date” dimension tells the date a visitor visited your website.
How do I connect Facebook Ads to Looker studio?
You can use connectors like Two Minute Reports to create reports, visualize data, and compare data from other platforms.
What data to pull from Facebook ads?
The best data to pull from Facebook Ads varies to your business needs and types. Ensure that your data informs you about your user’s behaviors, your website/app’s performance and User Experience.
What are “Teams” in Two Minute Reports?
To ensure the management of workflows, reports, and collaborative projects within an organization, Two Minute Reports has the “Teams” Feature. This feature allows your organization to create separate groups within the product to enable collaboration.
What is Two Minute Reports?
It is a connector for Looker Studio, which helps you integrate data from sources like Facebook Ads or Google Analytics to Looker studio, create reports, and analyze data effectively and seamlessly.
How to create custom Looker Studio Reports?
Make use of Looker Studio’s robust tools and features to create custom reports. You can also use connectors like Two Minute Reports to utilize their function-based templates.