Connect Google Ads to Looker Studio: Tutorial & Free Templates (2024)

Connecting with Google Ads Account to Looker Studio and Automate It
We will discover all the steps to pull Google Analytics from your Google Ads account and add it to your Data Studio. Our state-of-the-art solution will not only help you automate, extract, and explore Google Ads Looker Studio but also help you save time. Our holistic Google Ads Looker Studio reports will analyze all aspects of your Google Ads account performance, visualize ads data, add to your Google Ads Data Studio, and create reports, so you don't have to write any code. Here's how our Google ads connector works.
- Use the Two Minute Reports Google Ads Connector for Looker Studio.
- Then connect Google Ads account to Google Data Studio and complete building Google Ads reports.
This can be done in two ways.
Method 1: Use Two Minute Reports for Google Ads Data Studio
OR
Method 2: Choose from our thoughtfully designed built-in Templates to create a report.
Method 1: Use Two Minute Reports to connect to Google Ads Looker Studio
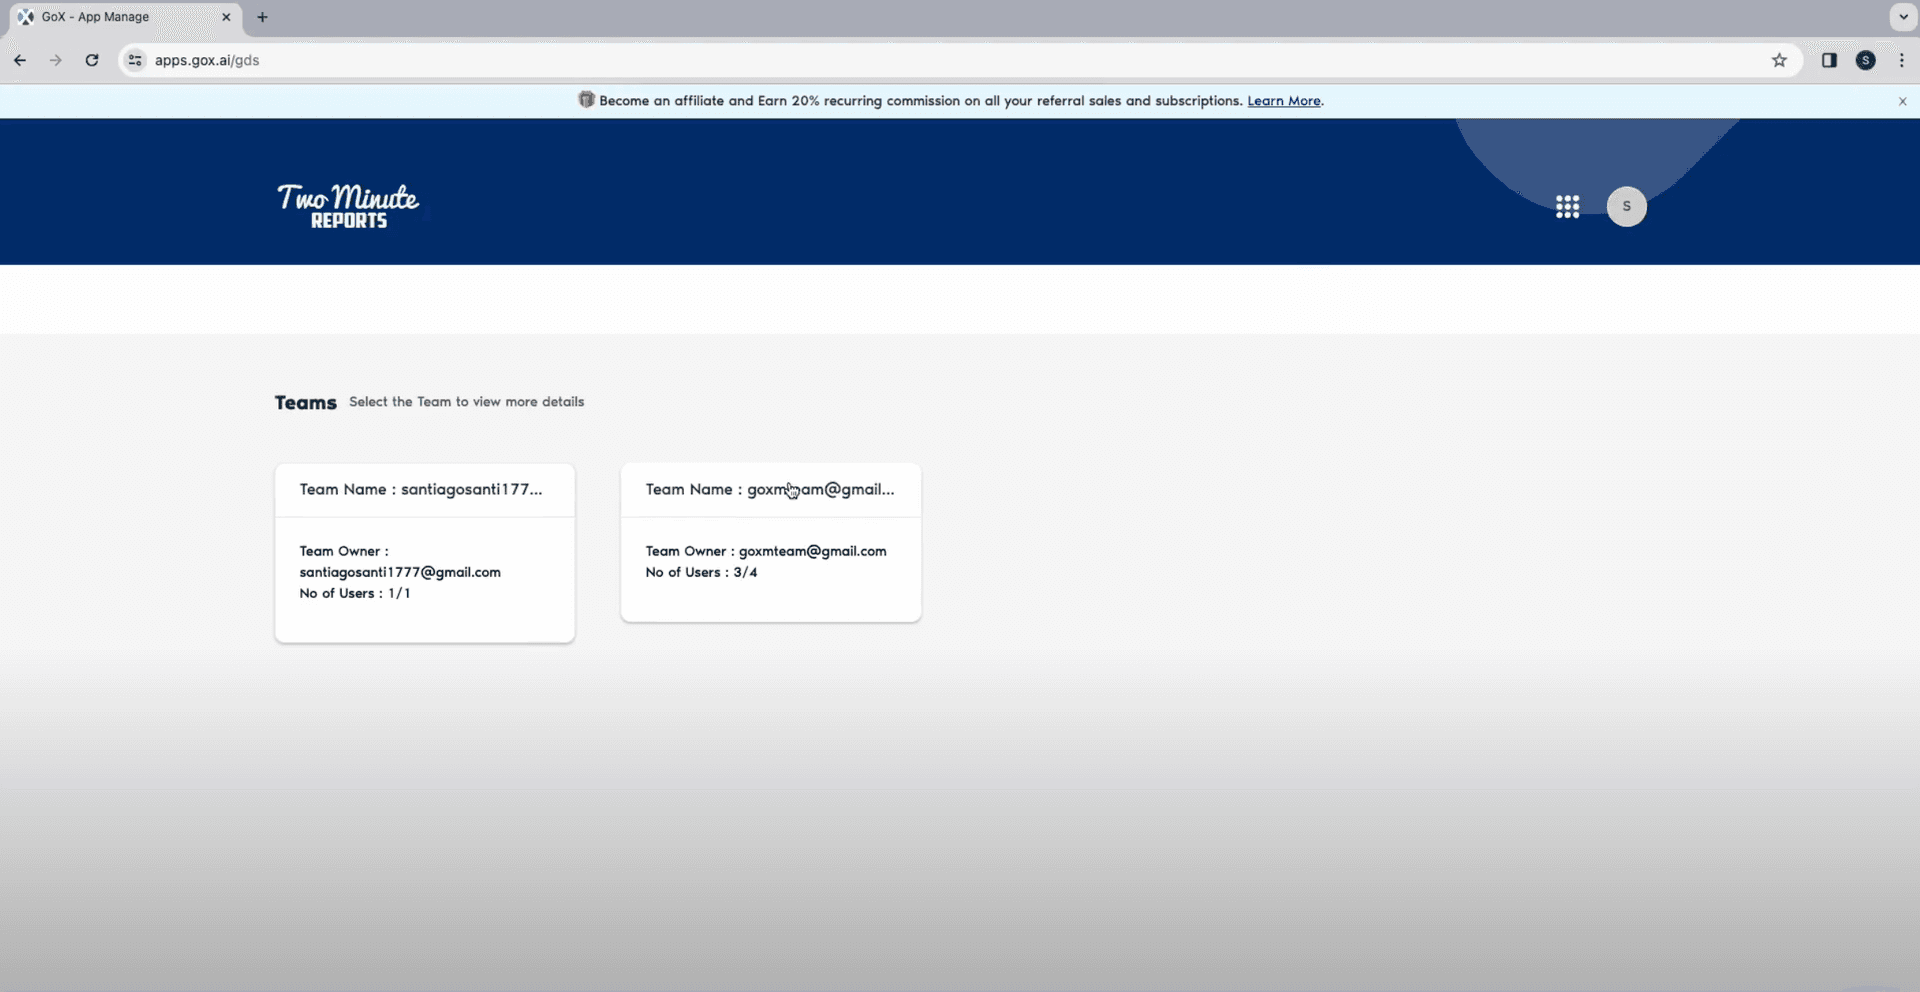
 Click on Products -> Two Minute Reports for Looker Studio. It will redirect you to the Two Minute Reports page. Now select the Accounts option.
 - The next window will show you the list of teams you are connected to. Choose the one you want to collaborate with.
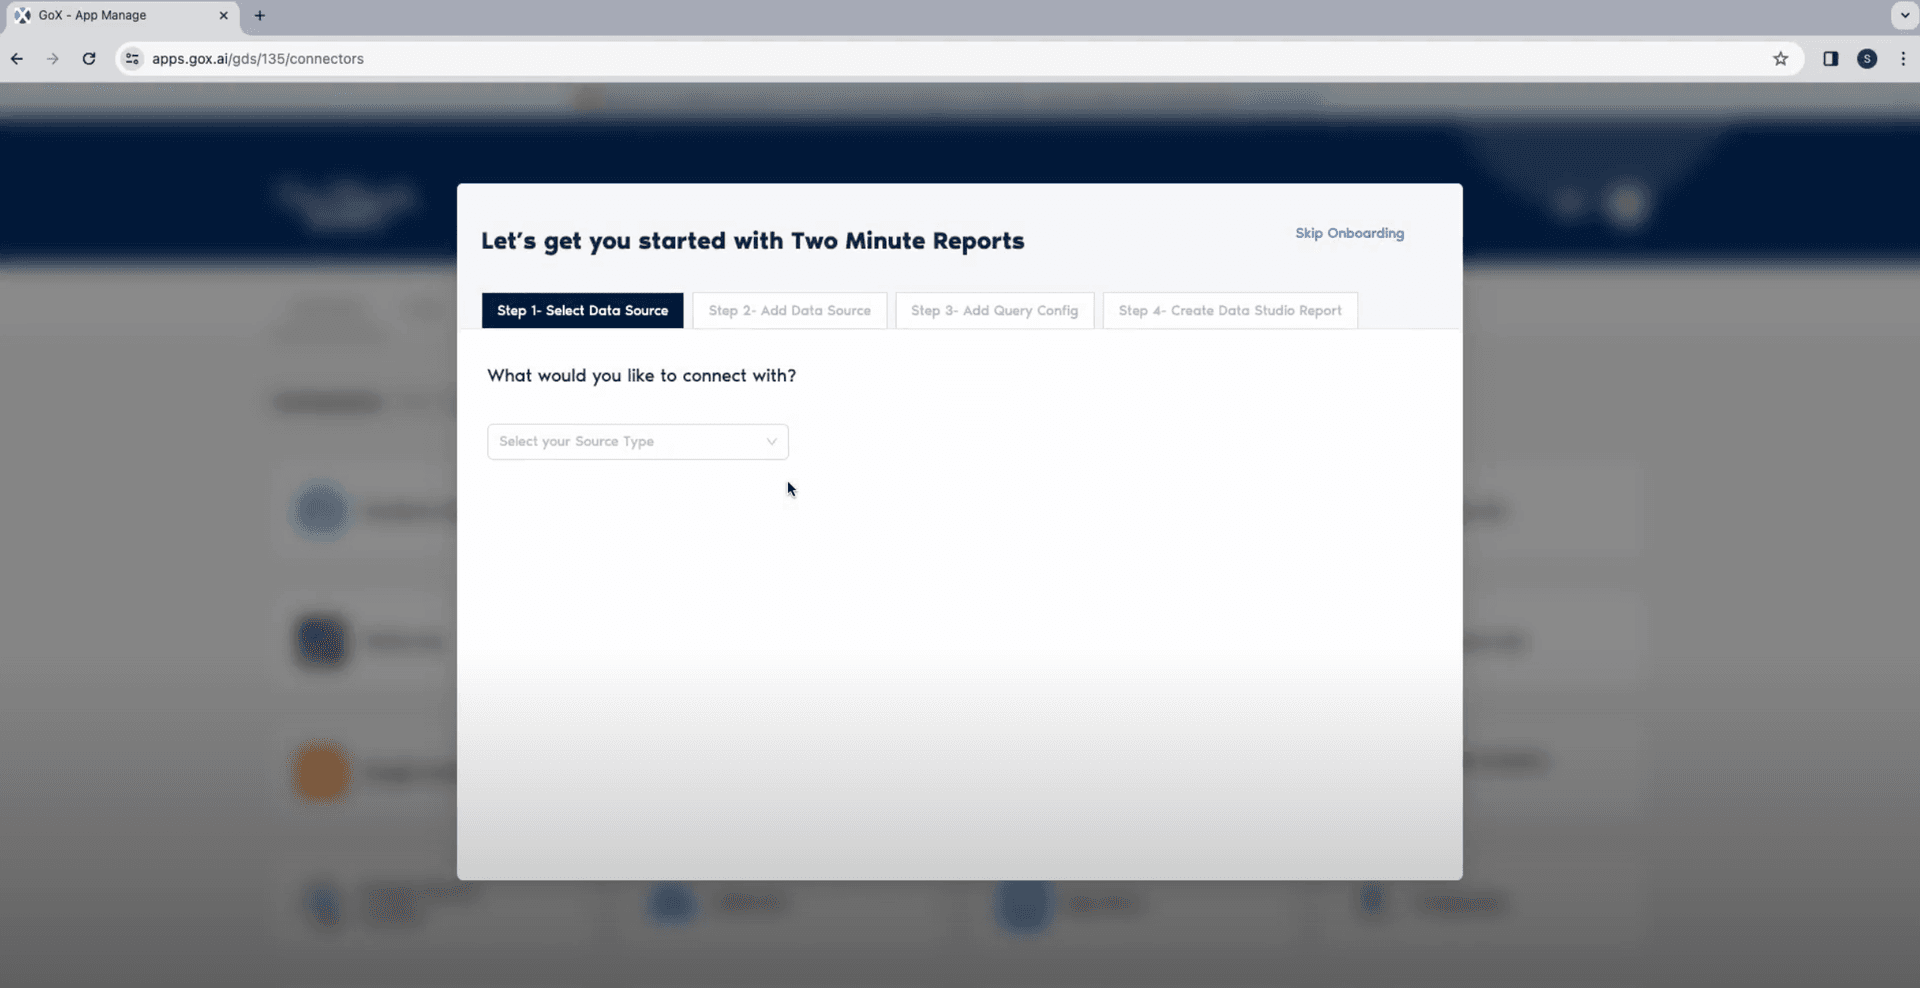
- You will now be redirected to the Connecters page. It will first ask you if you want a quick tour of using TMR for Google Data Studio. If you already know how to use it, you can click on skip onboarding.
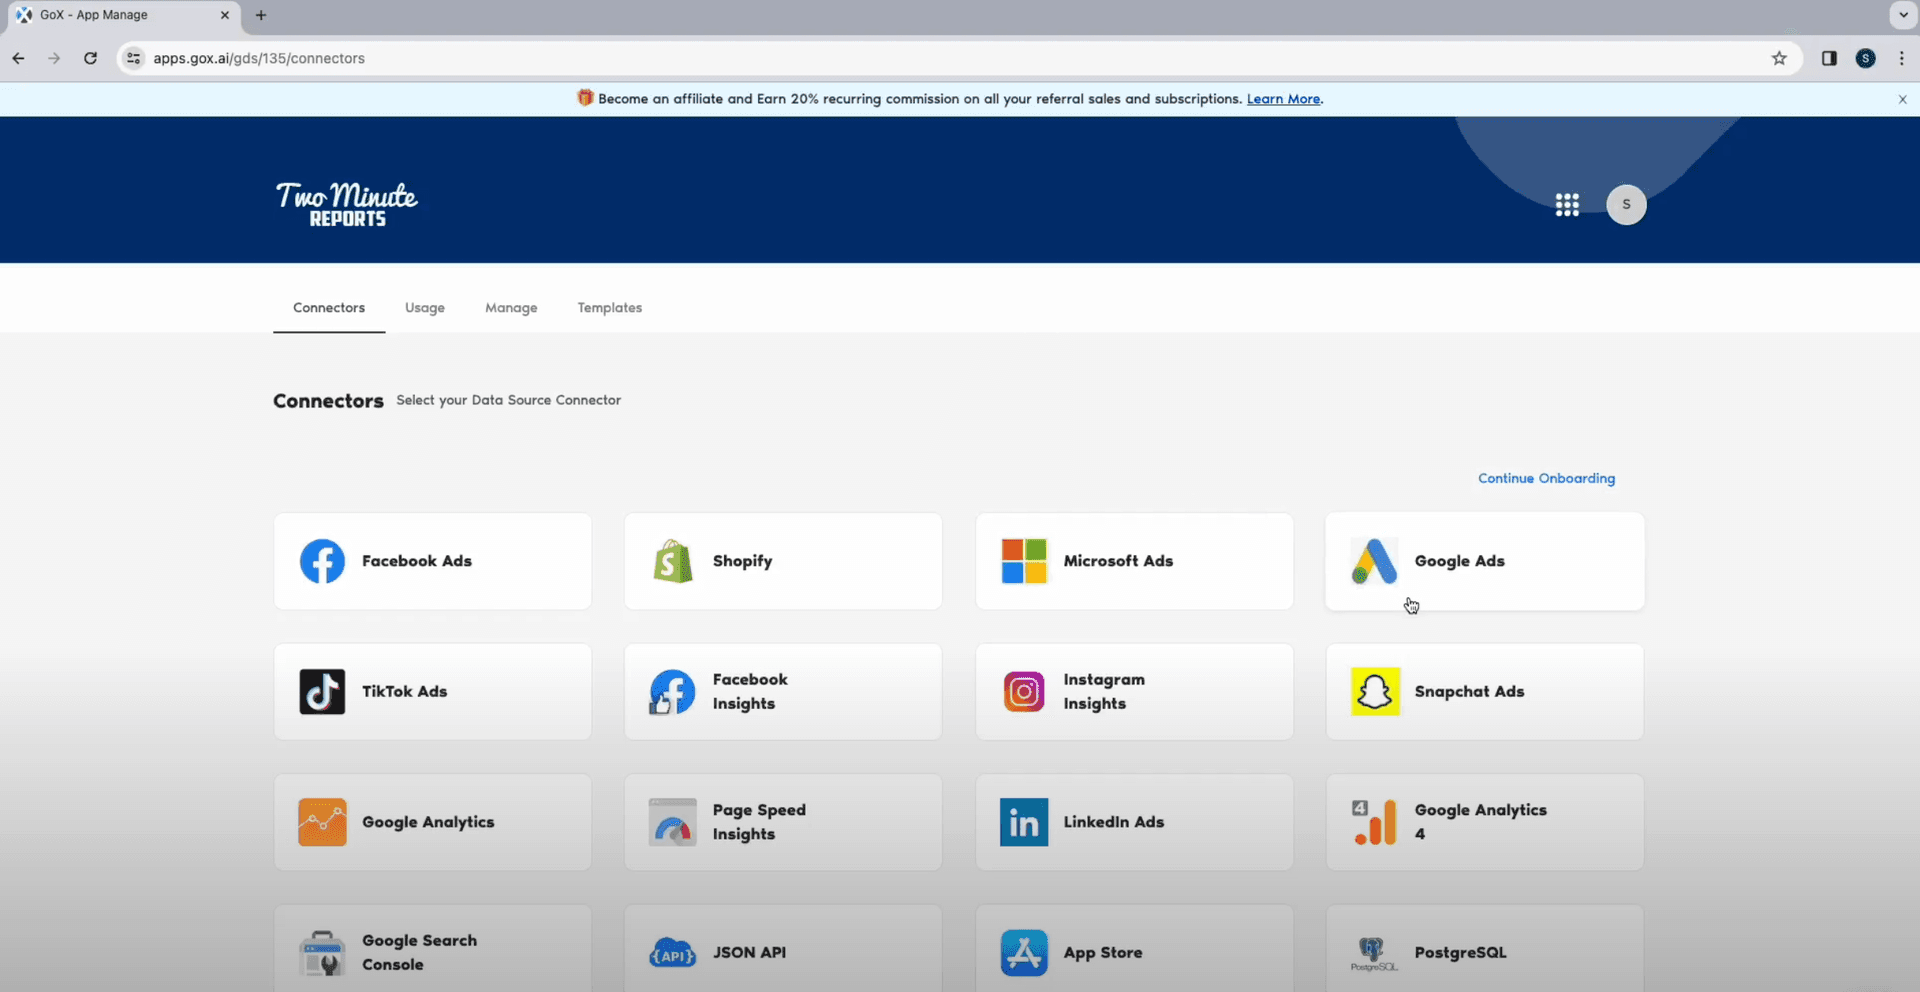
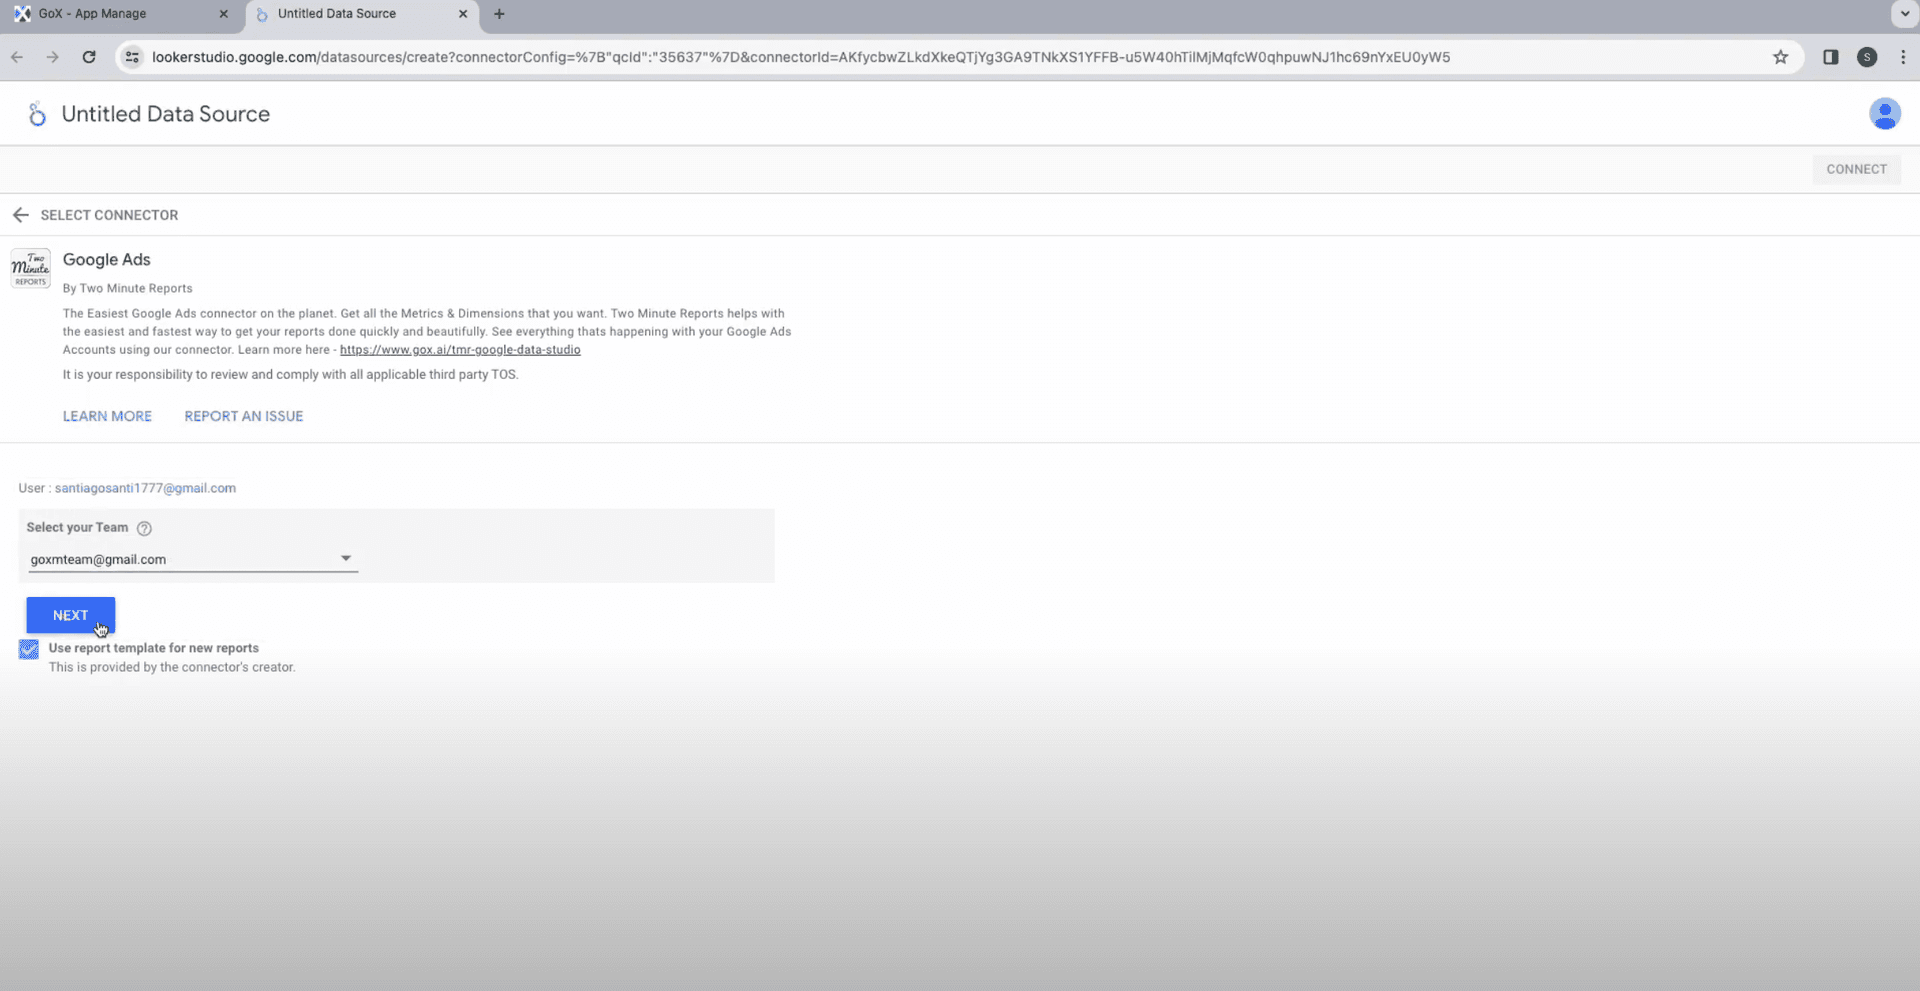
- Now, you will find data connectors for various channels and platform. Select the Google ads connector from the list.
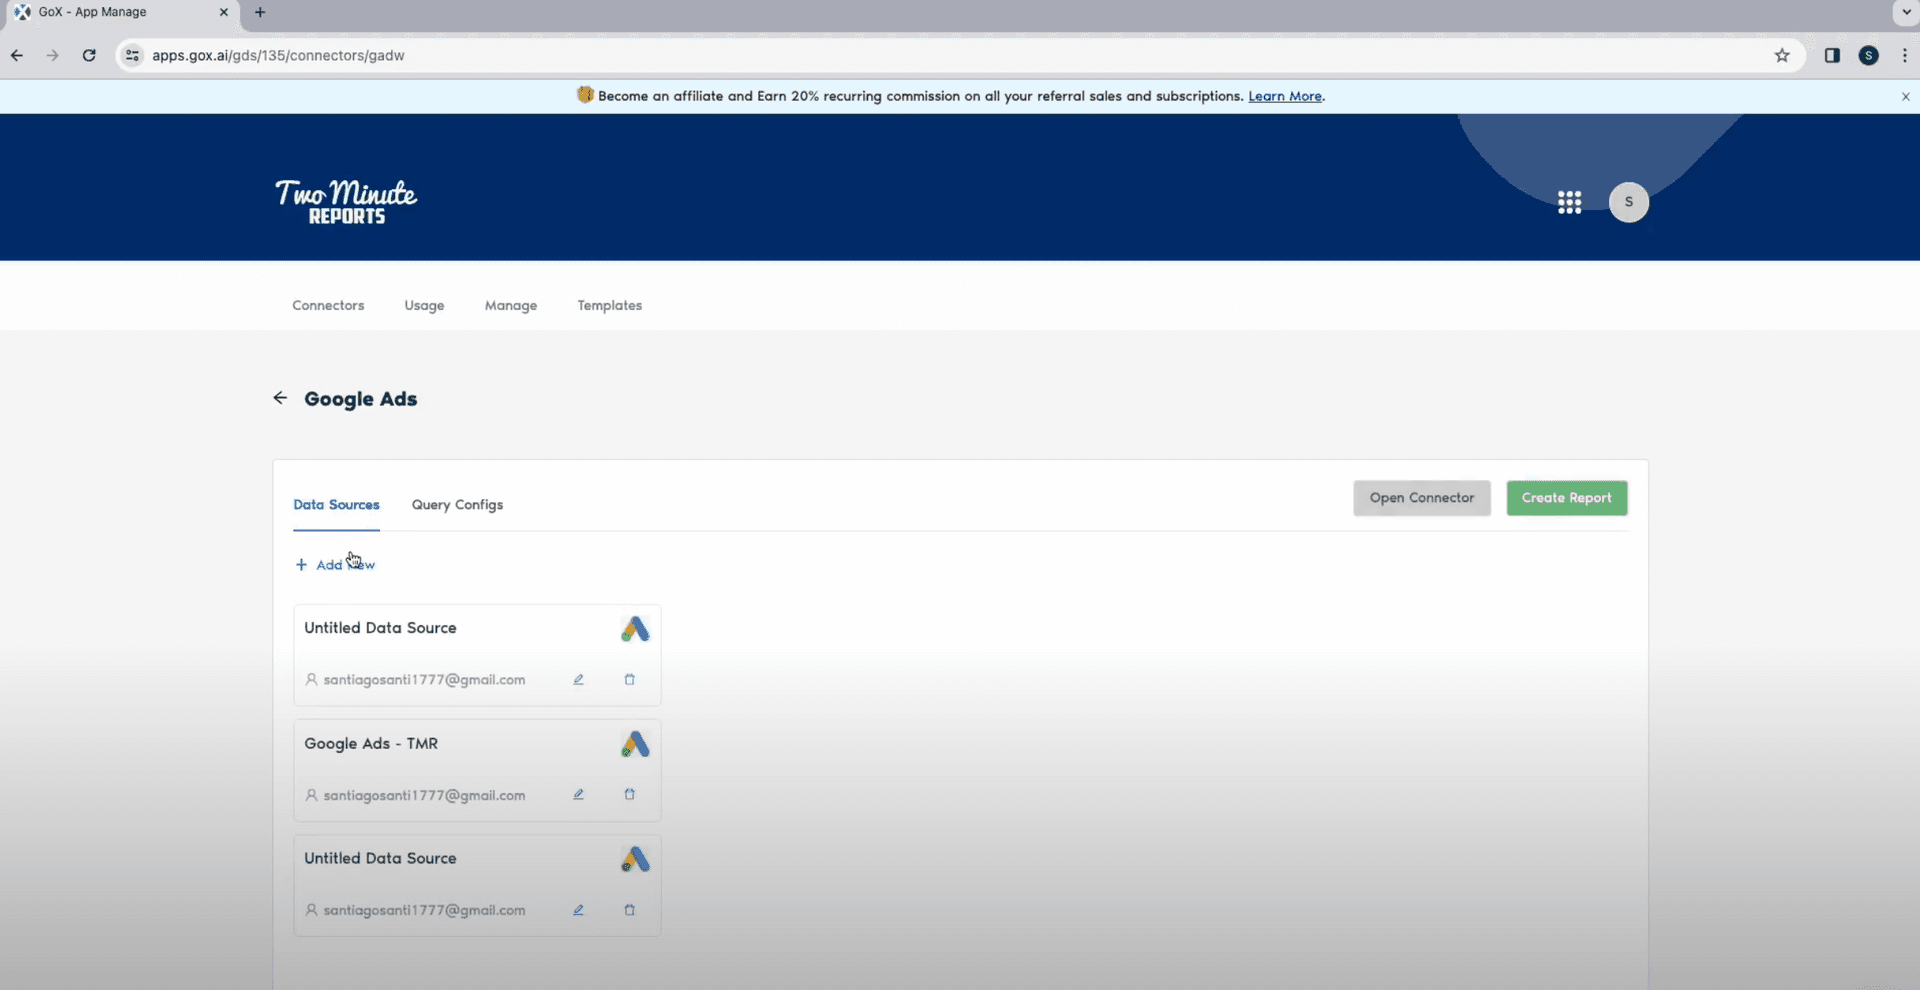
- Inside the dashboard, select Add New to add your Data Source.
In the next window, give a name to your data source and select Sign in with Google. 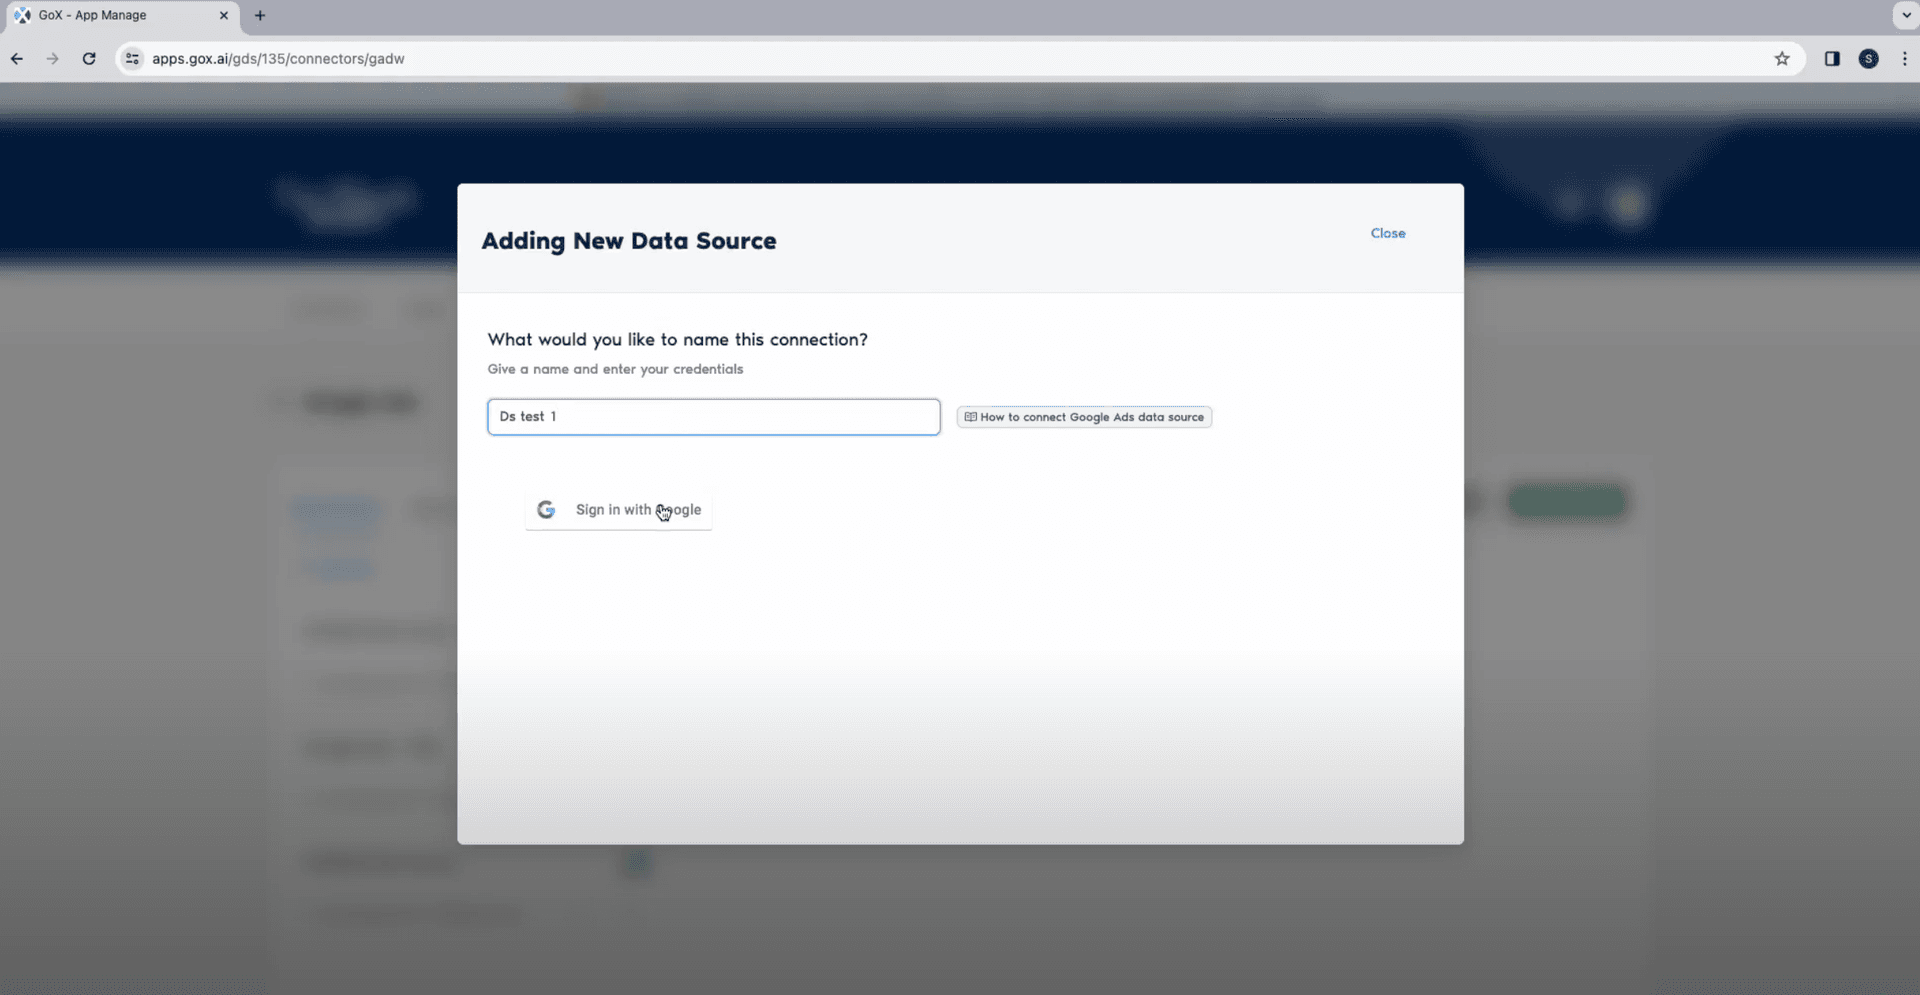
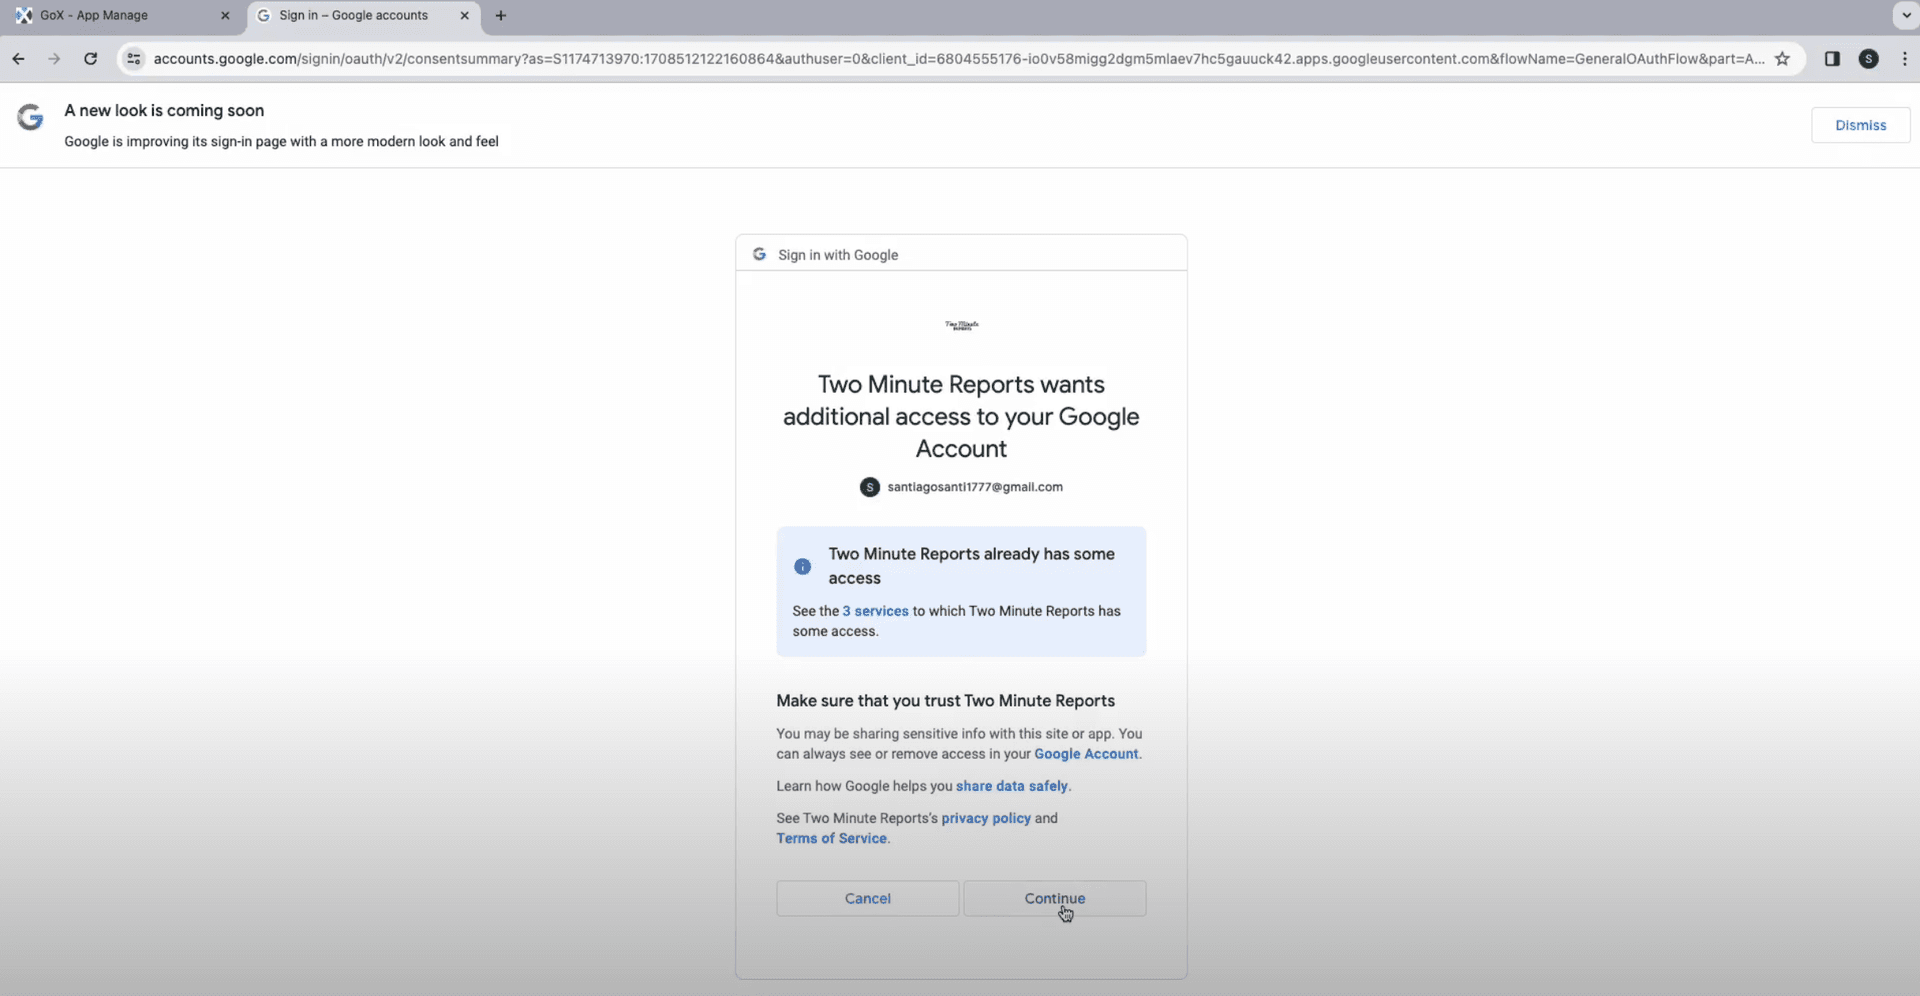
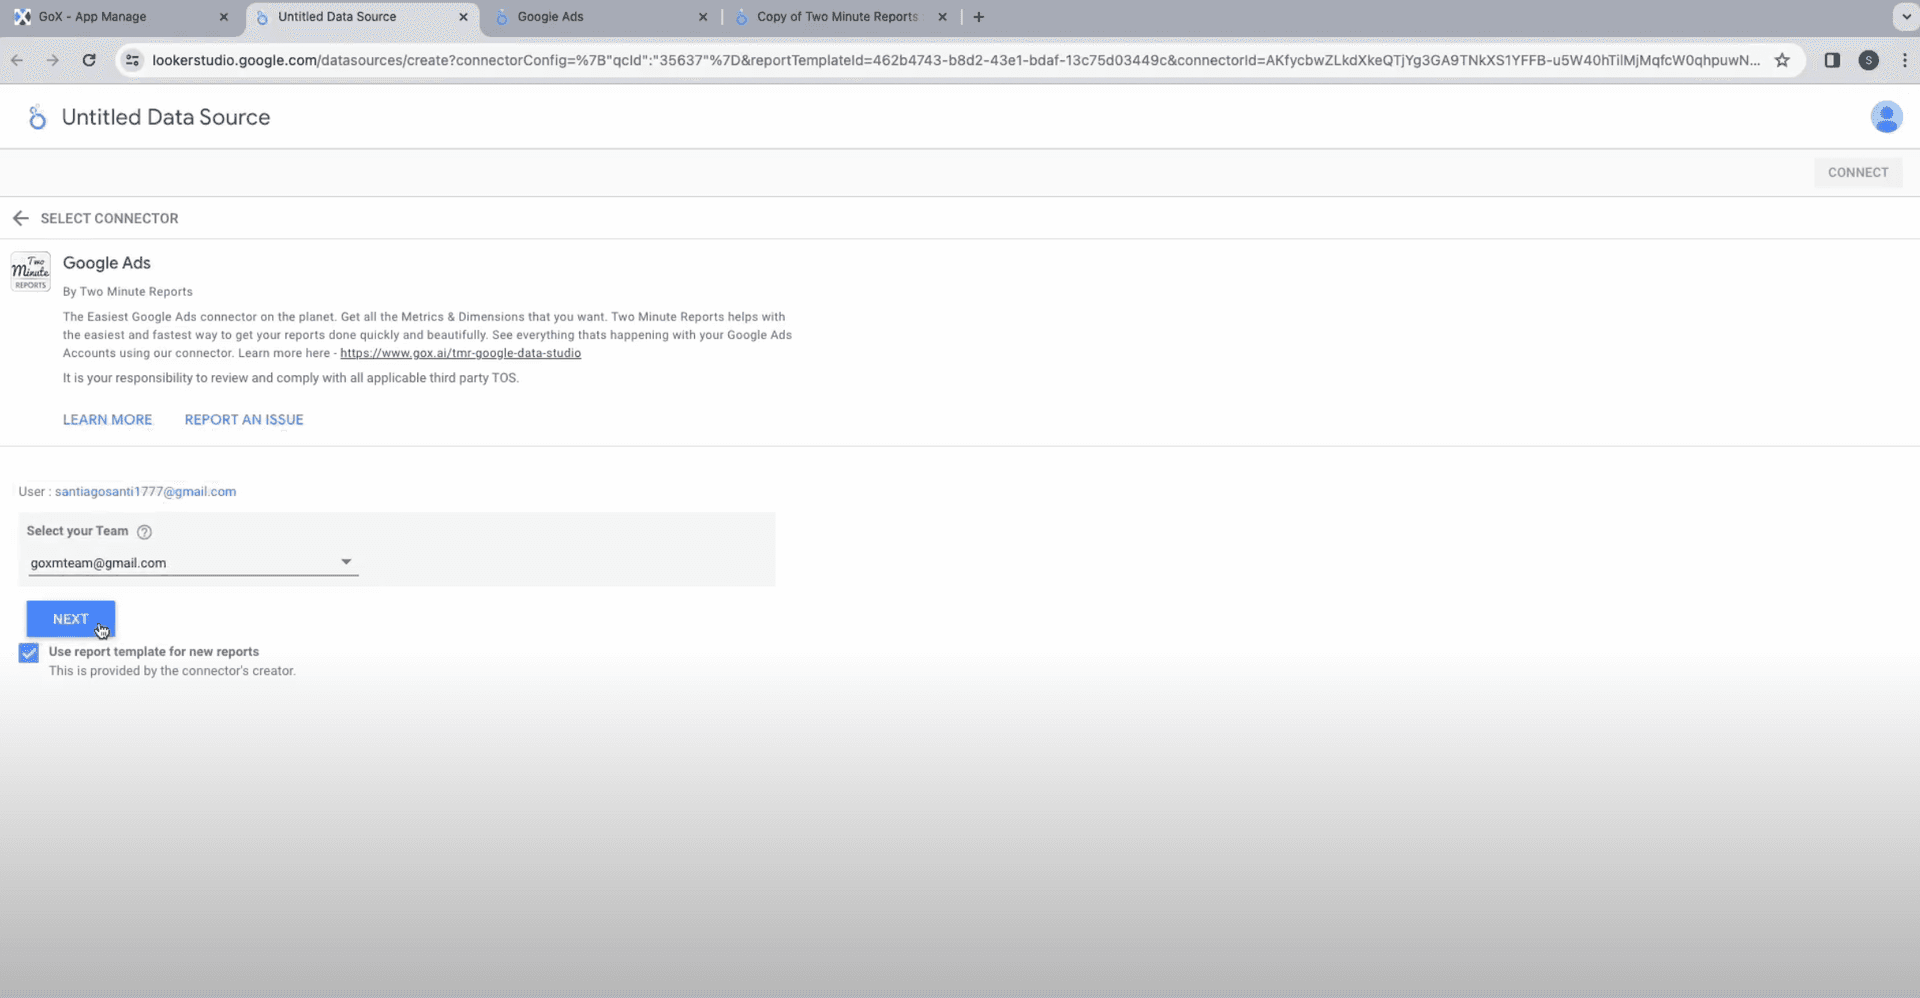
- select the account for your Google ads. Authorize your sign in with TMR by clicking on Continue.
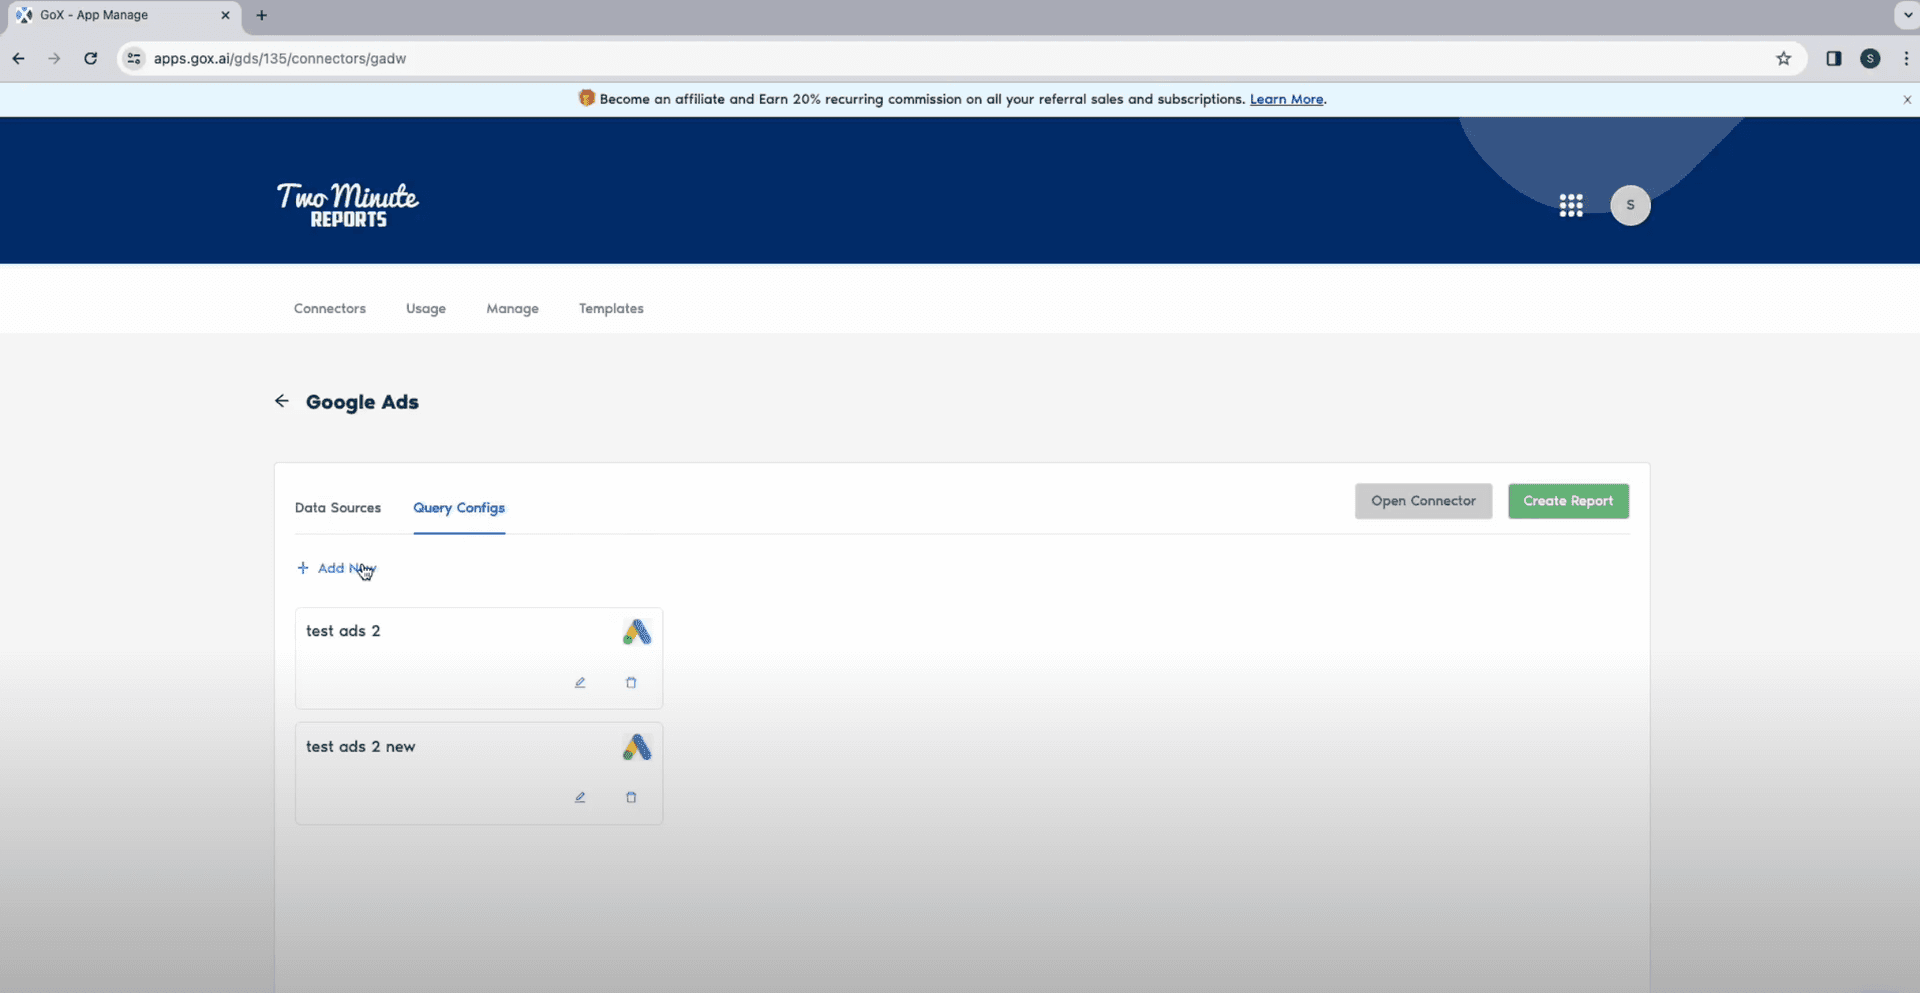
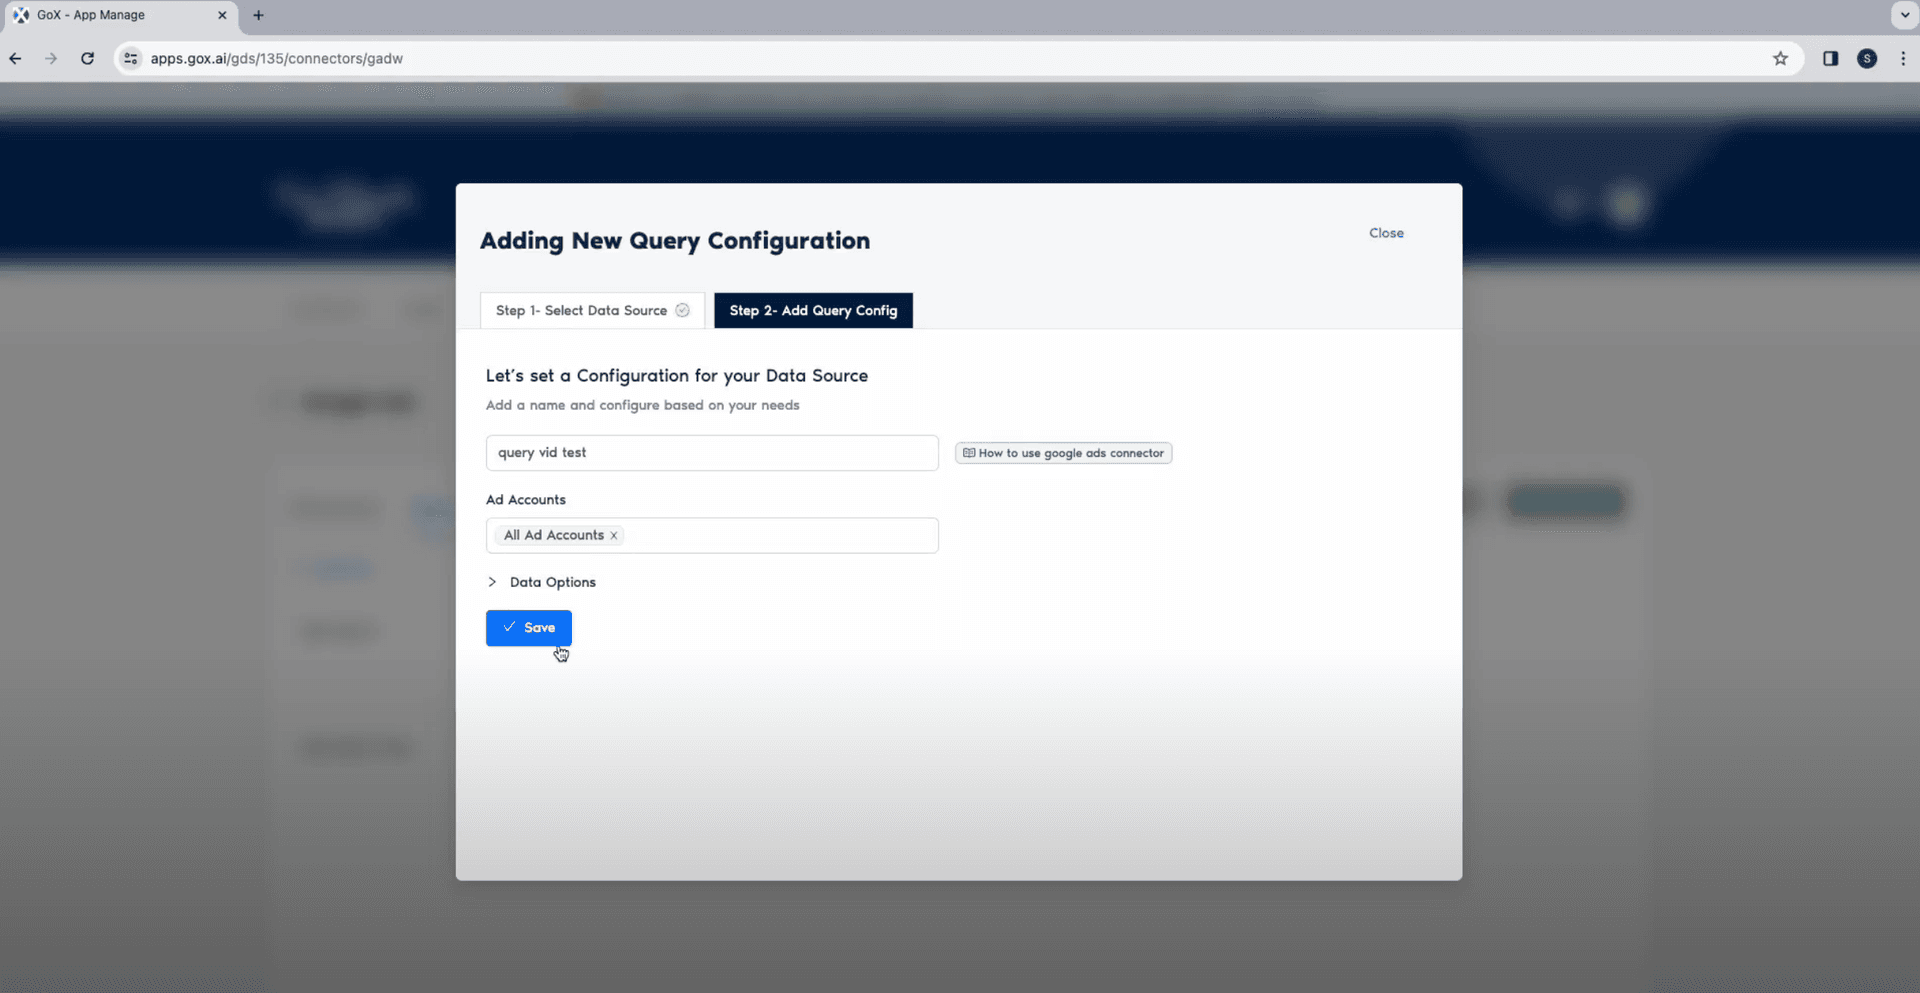
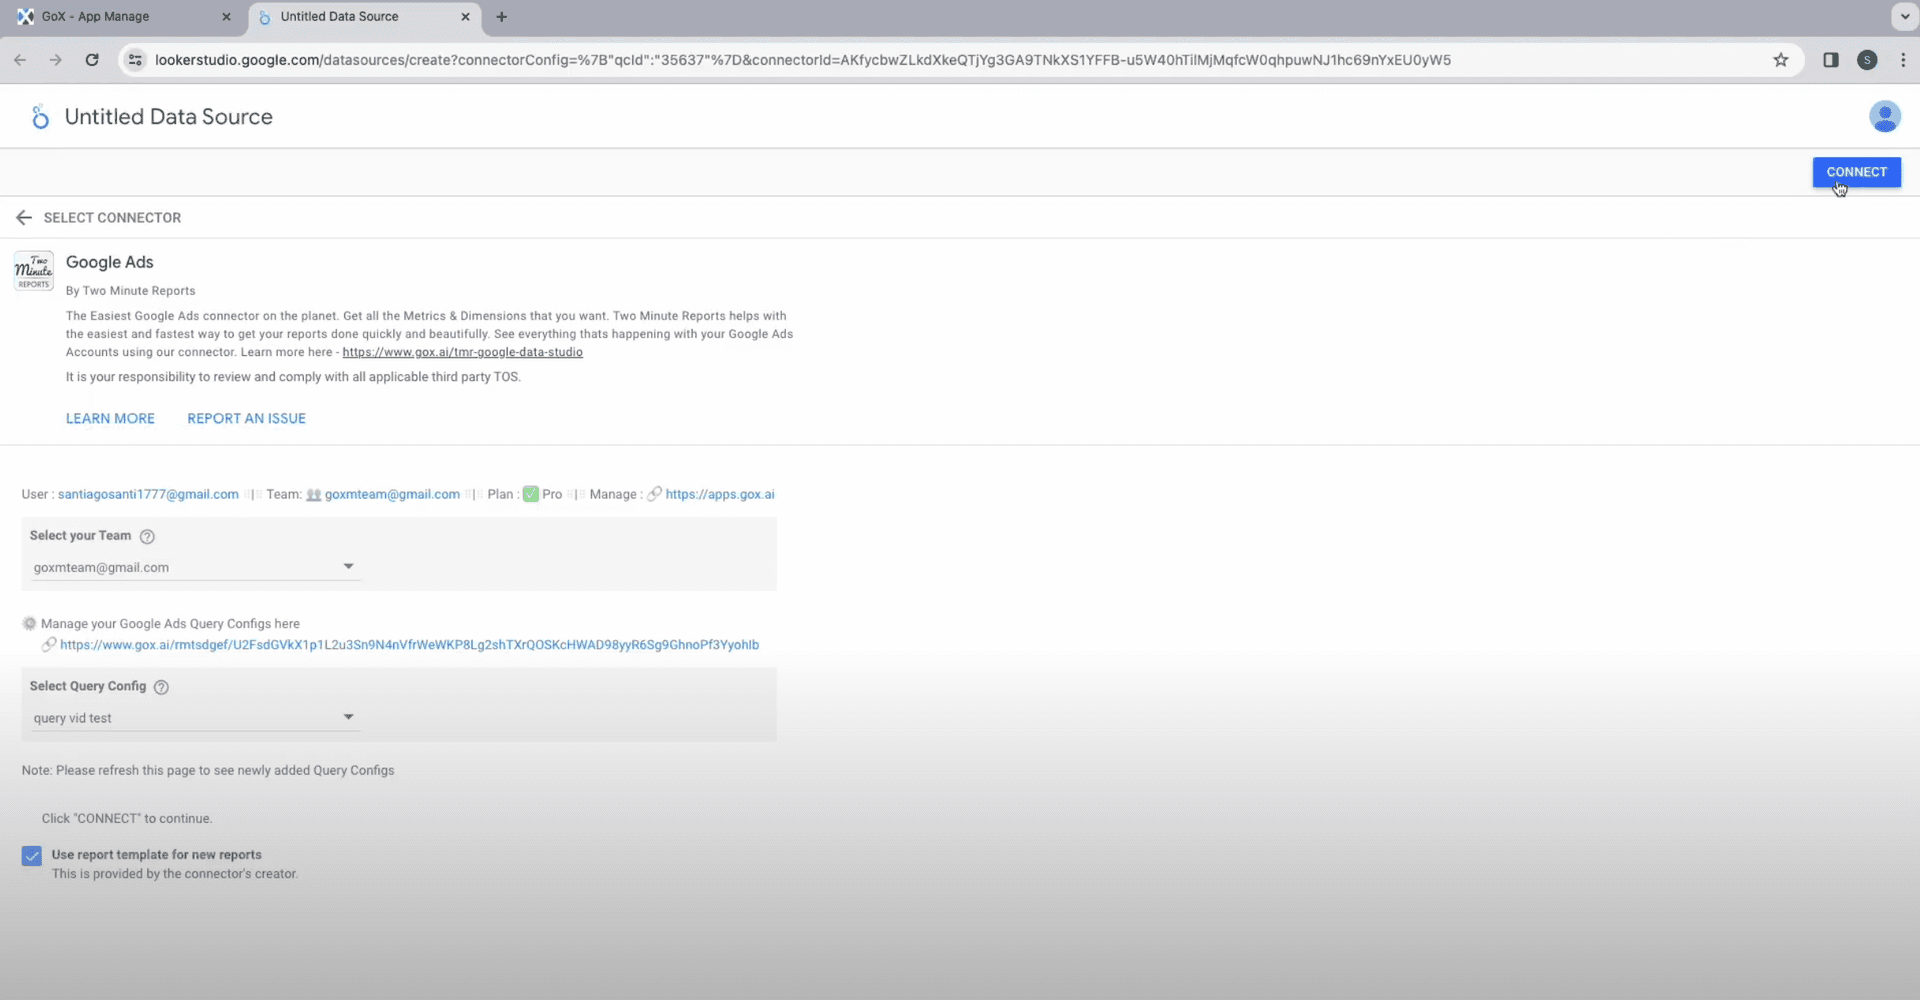
- Once you are successfully logged in, click on Query configs > Add New to add your data source configurations.
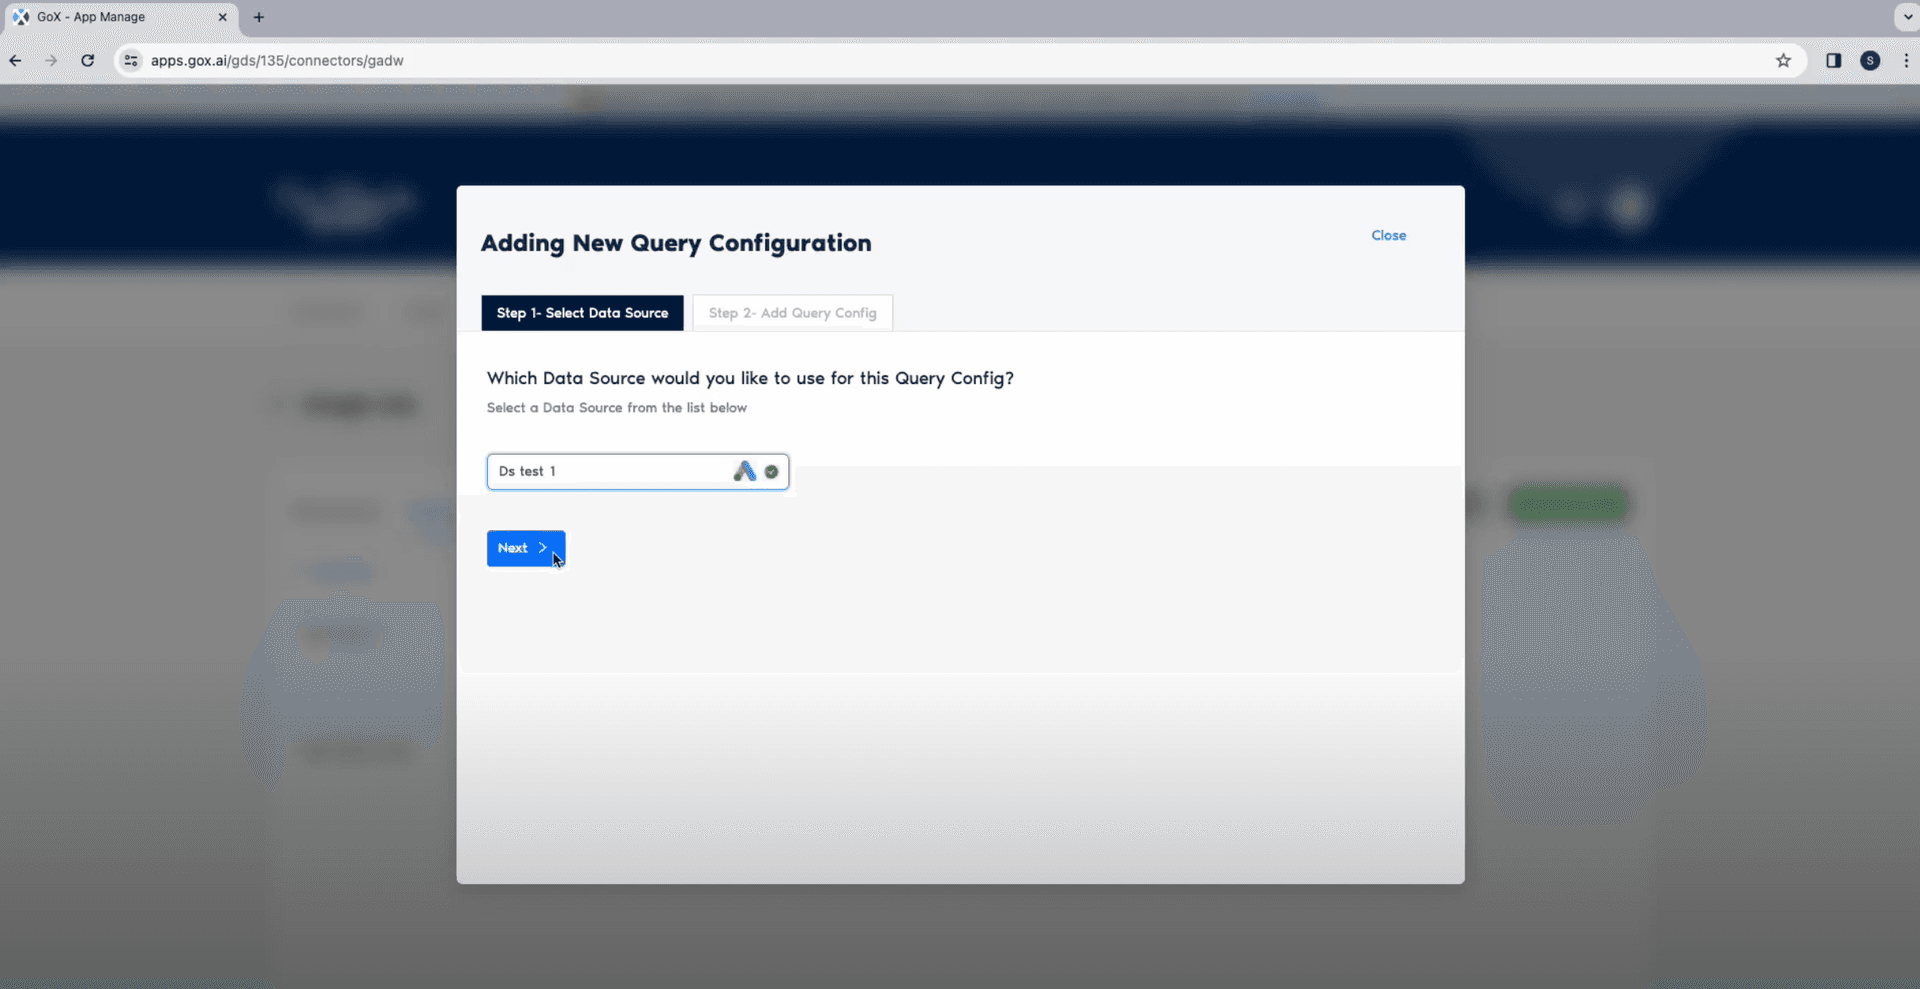
- Now choose your required Data Source that you have already created. select Next.
- In the next window, set a configuration, select your Google ads account, and select Save.
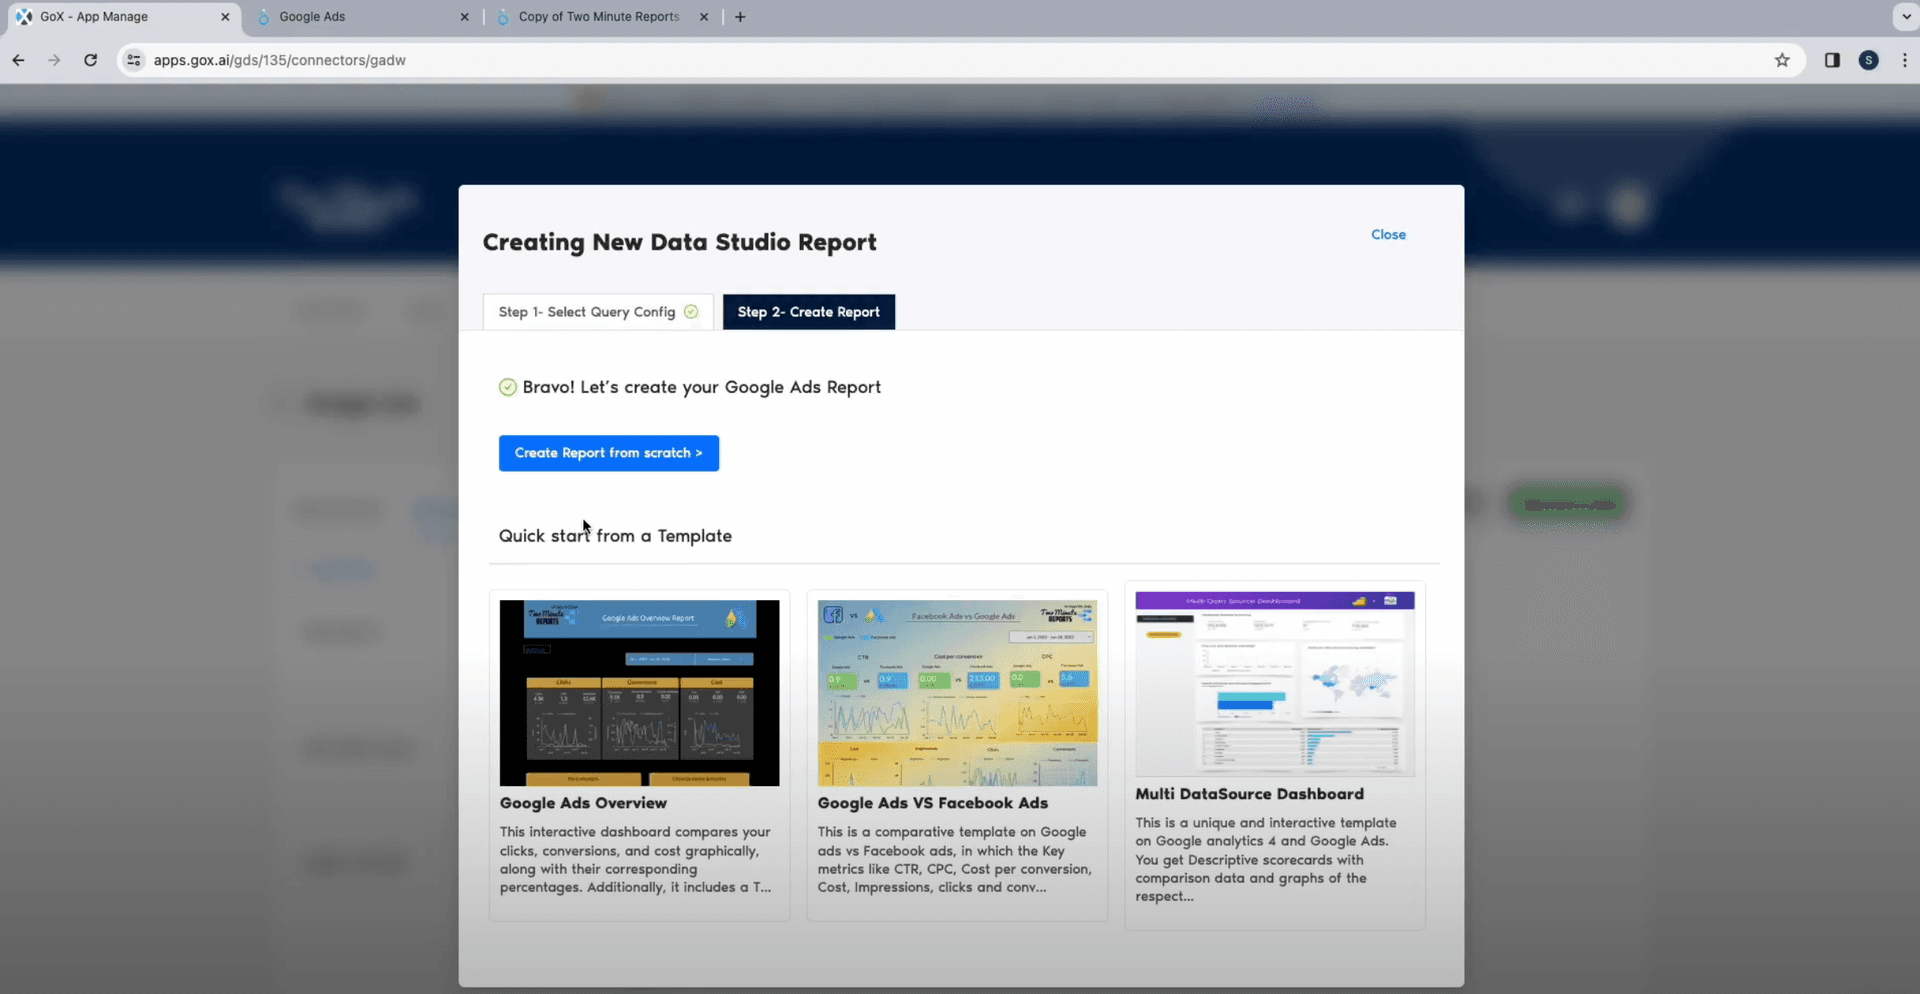
- Now click on Create a Report at the top right corner to open the “Creating New Data Studio Report window.
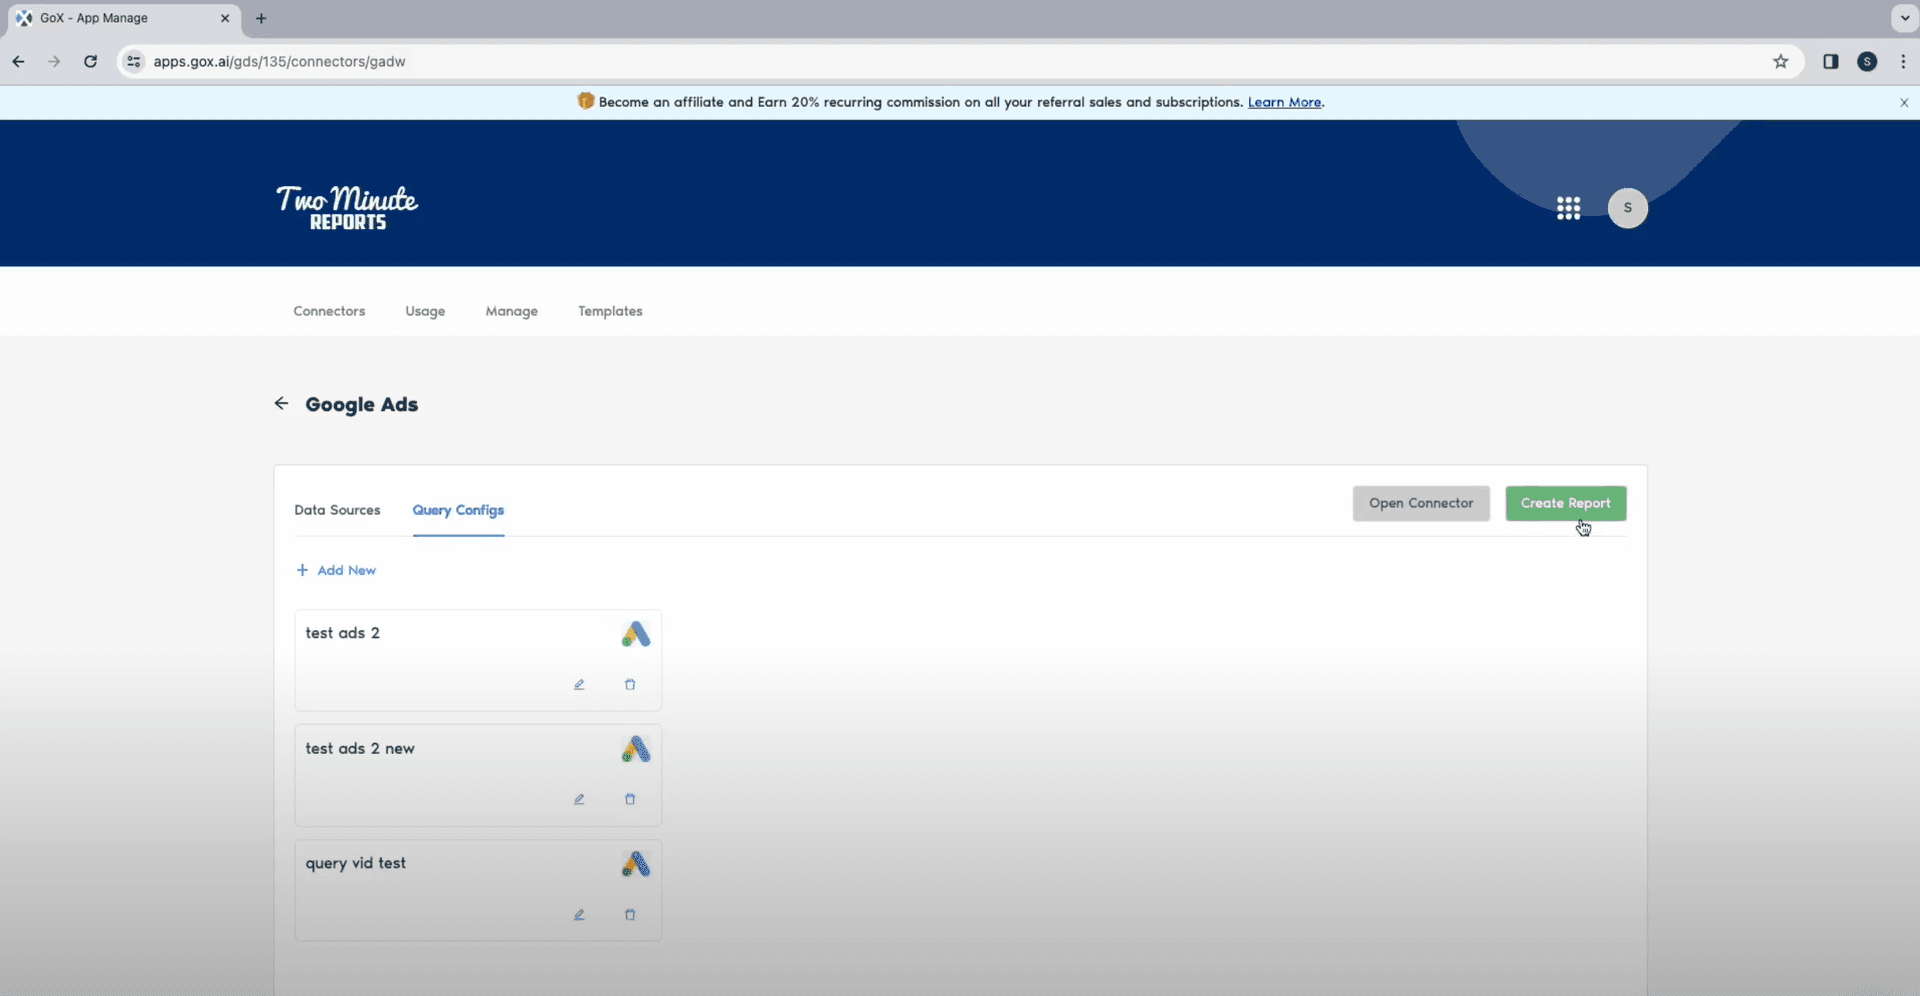
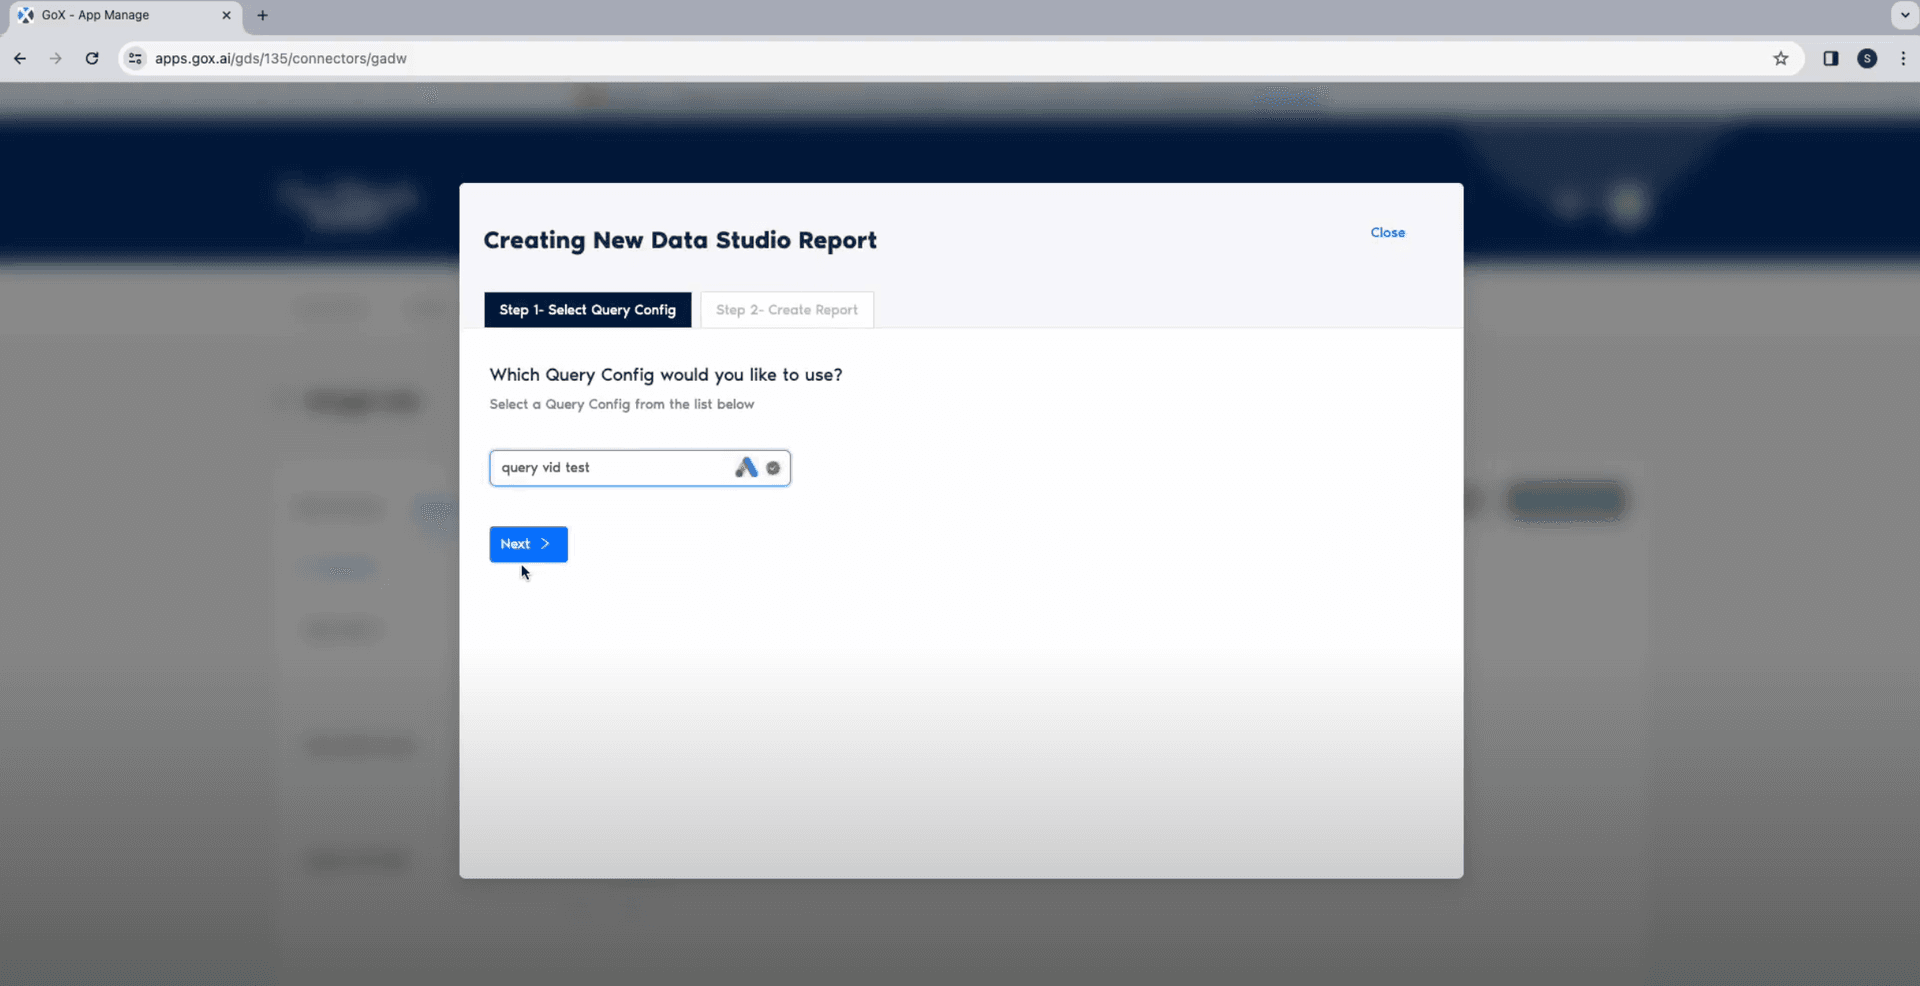
- Select the Query Configuration you would like to use and click on Next.
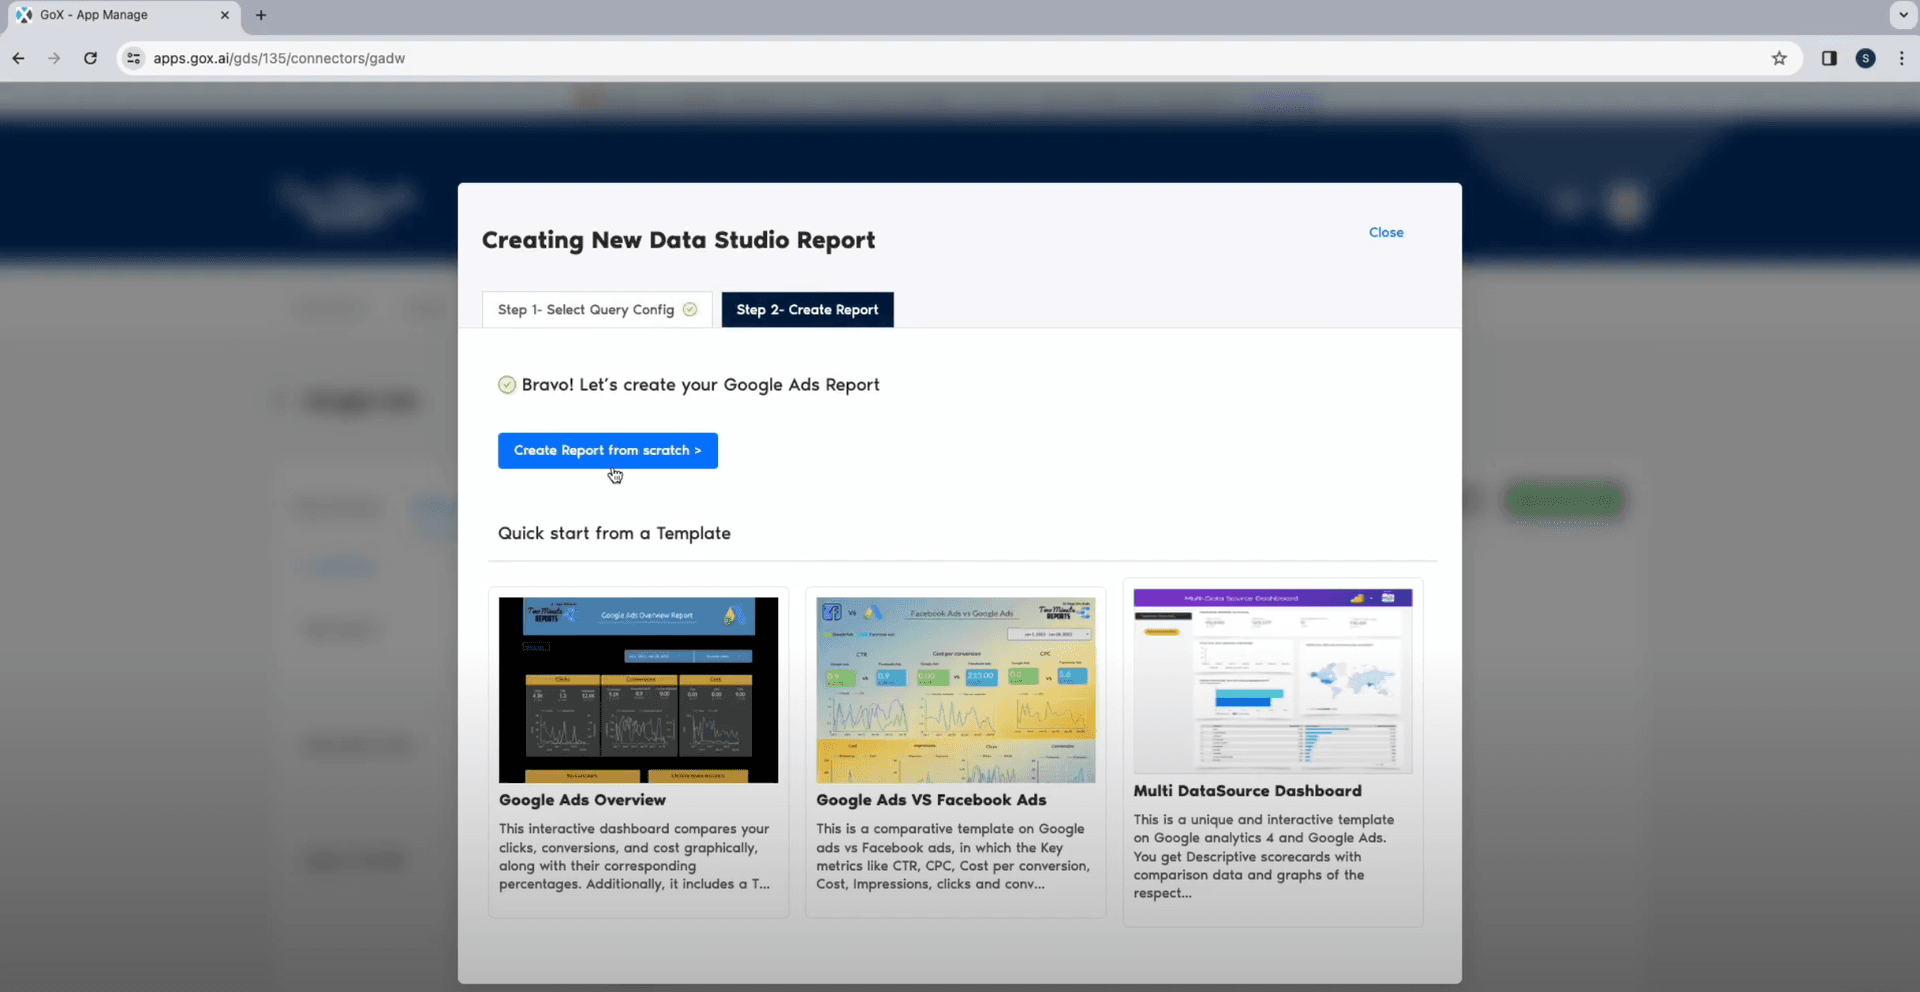
- Once you are done setting your Data Sources and configurations for queries, click on Create Report From Scratch.
- Select the team and click on next.
- Verify your configurations and click on Connect.
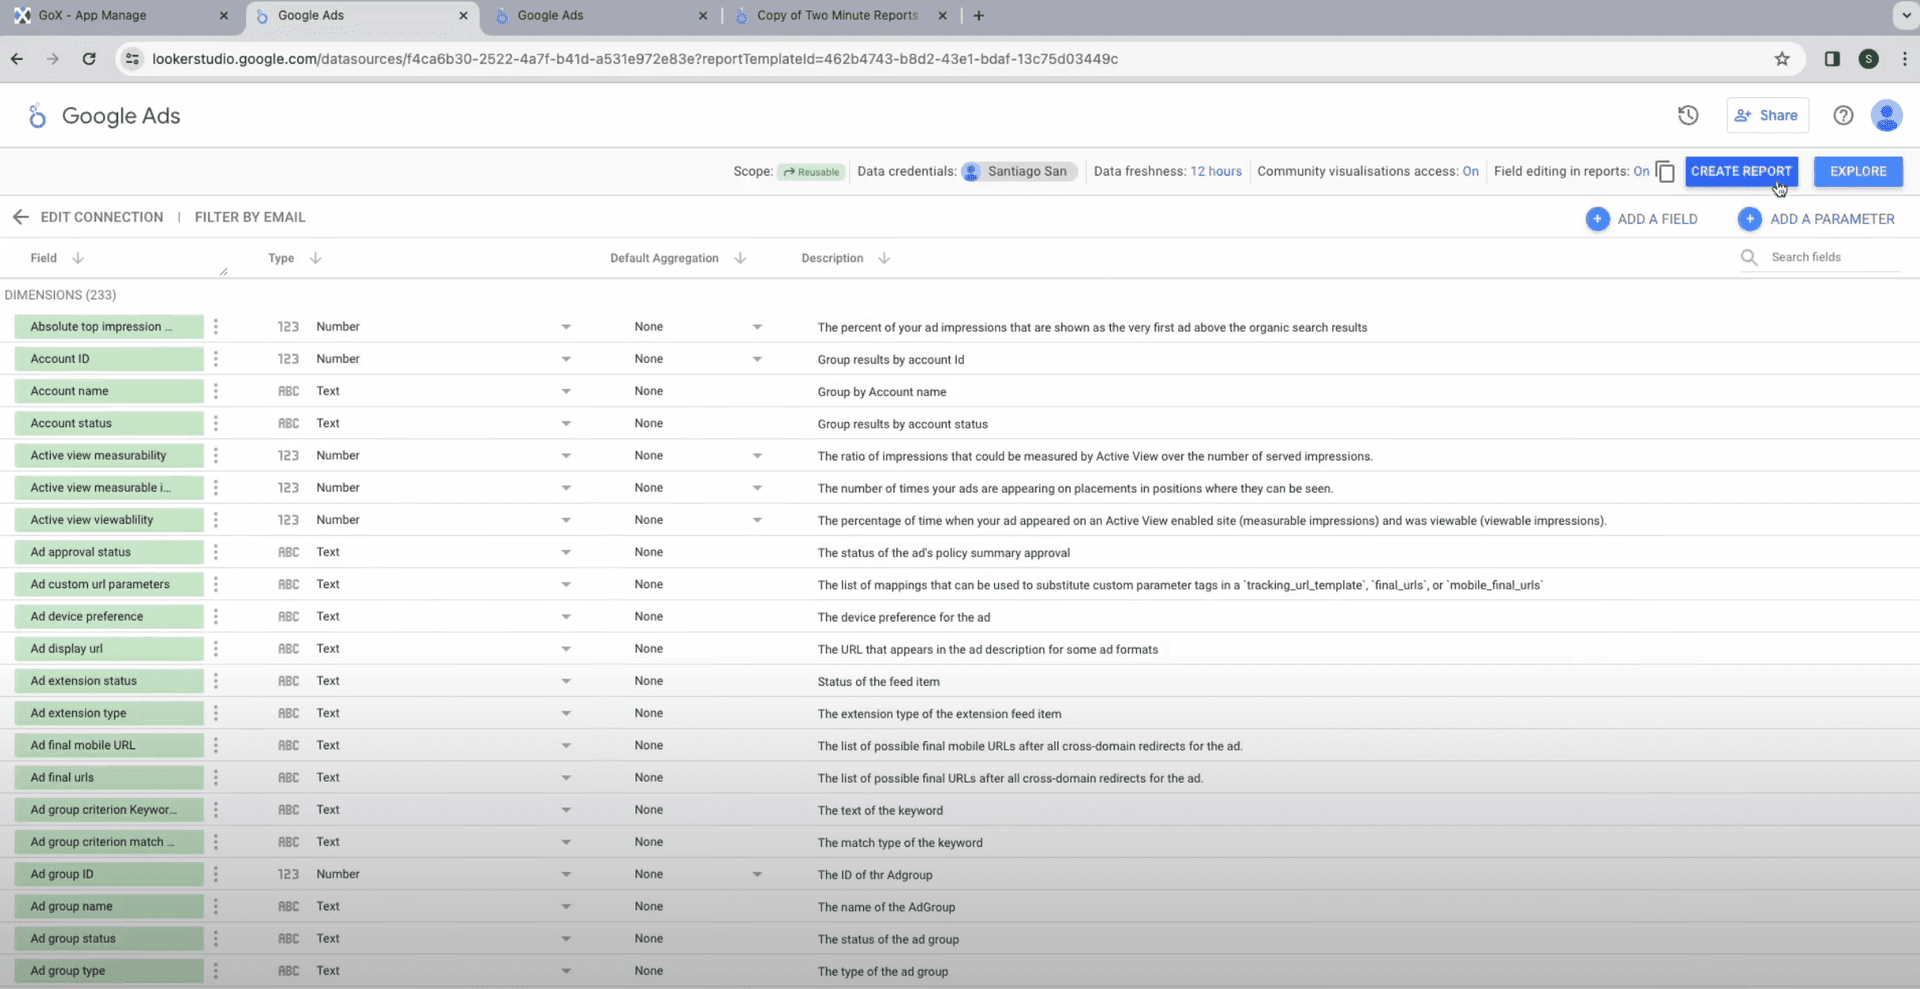
The next window will show you all the fields and parameters for your Google ads Data Studio report. You can add or eliminate parameters like numbers, text, currency, URL for any field based on your requirement. Once done, click on Create Report on the top right corner and authorize your action.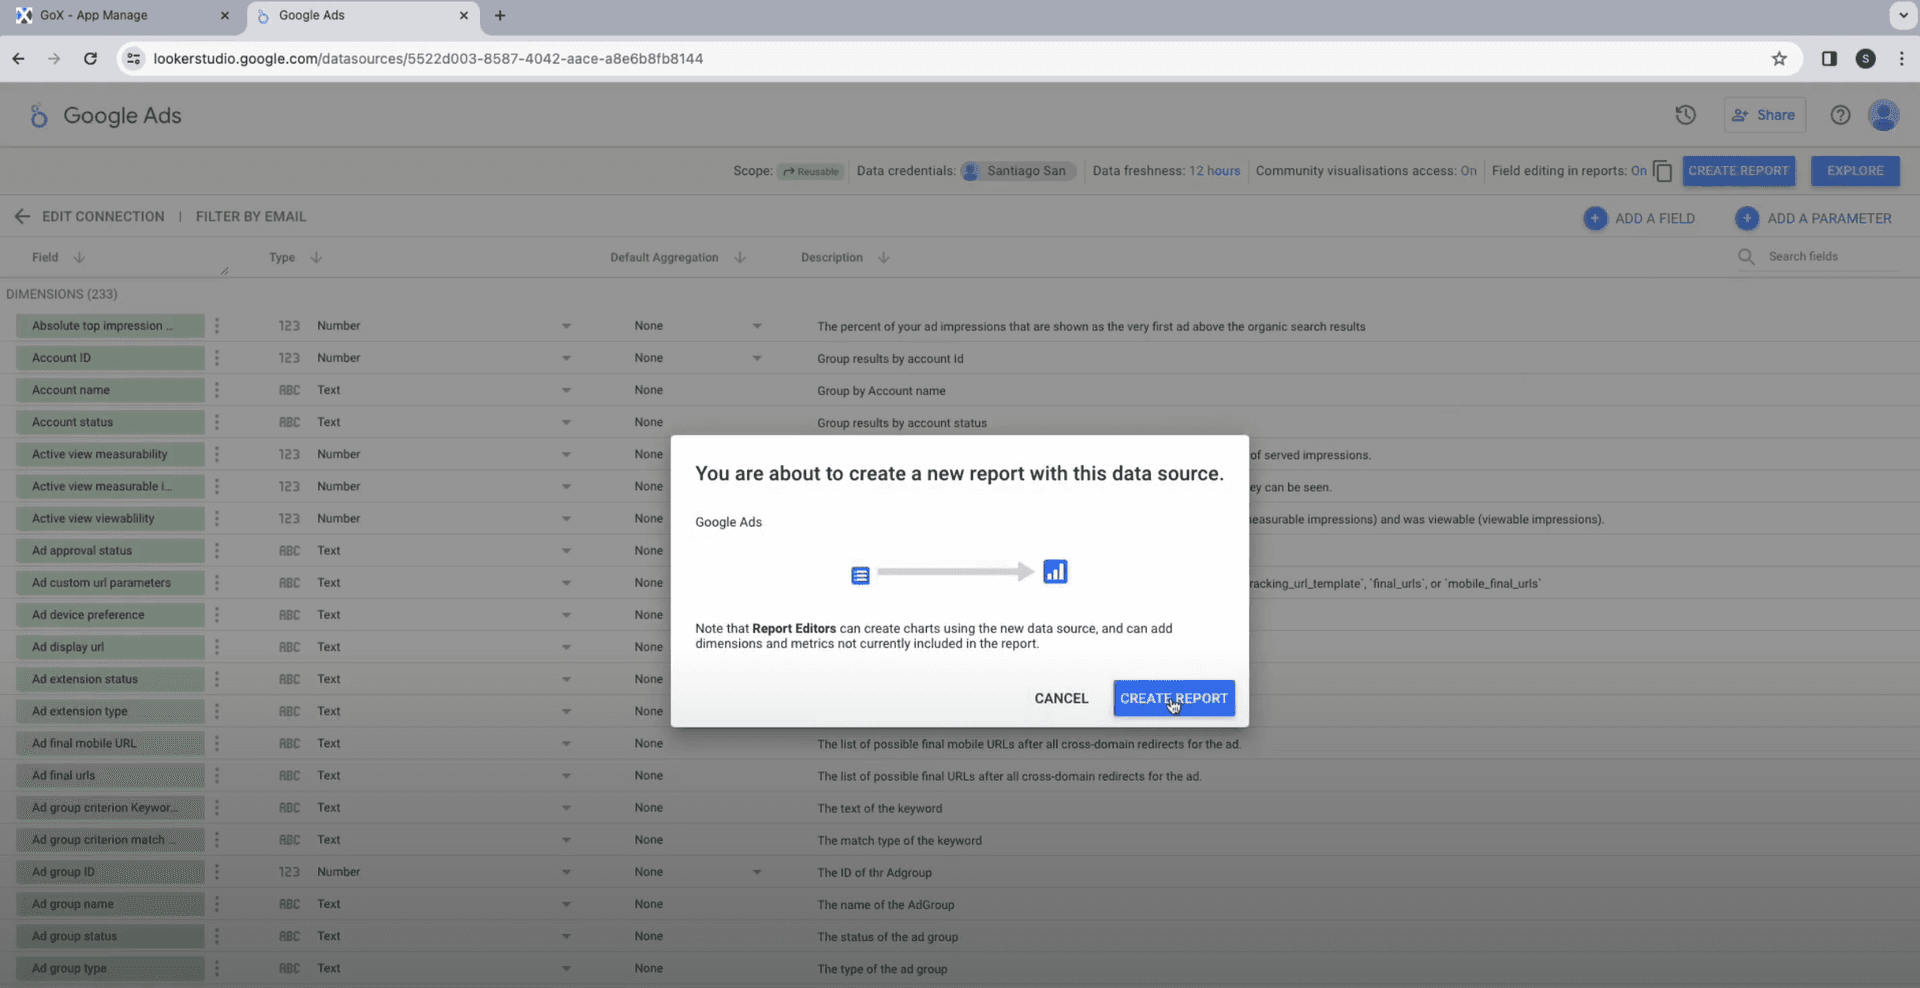
- Now your TMR is connected to Google Data Studio. You now have all the metrics and dimensions available on the sidebar and a table showing insights explored from Google Analytics.
- Now it’s time to add Metrics to the report. You will find numerous metrics like impressions, account ID, clicks, account name, user engagement, account status, etc. Select the required metrics from the drop down.
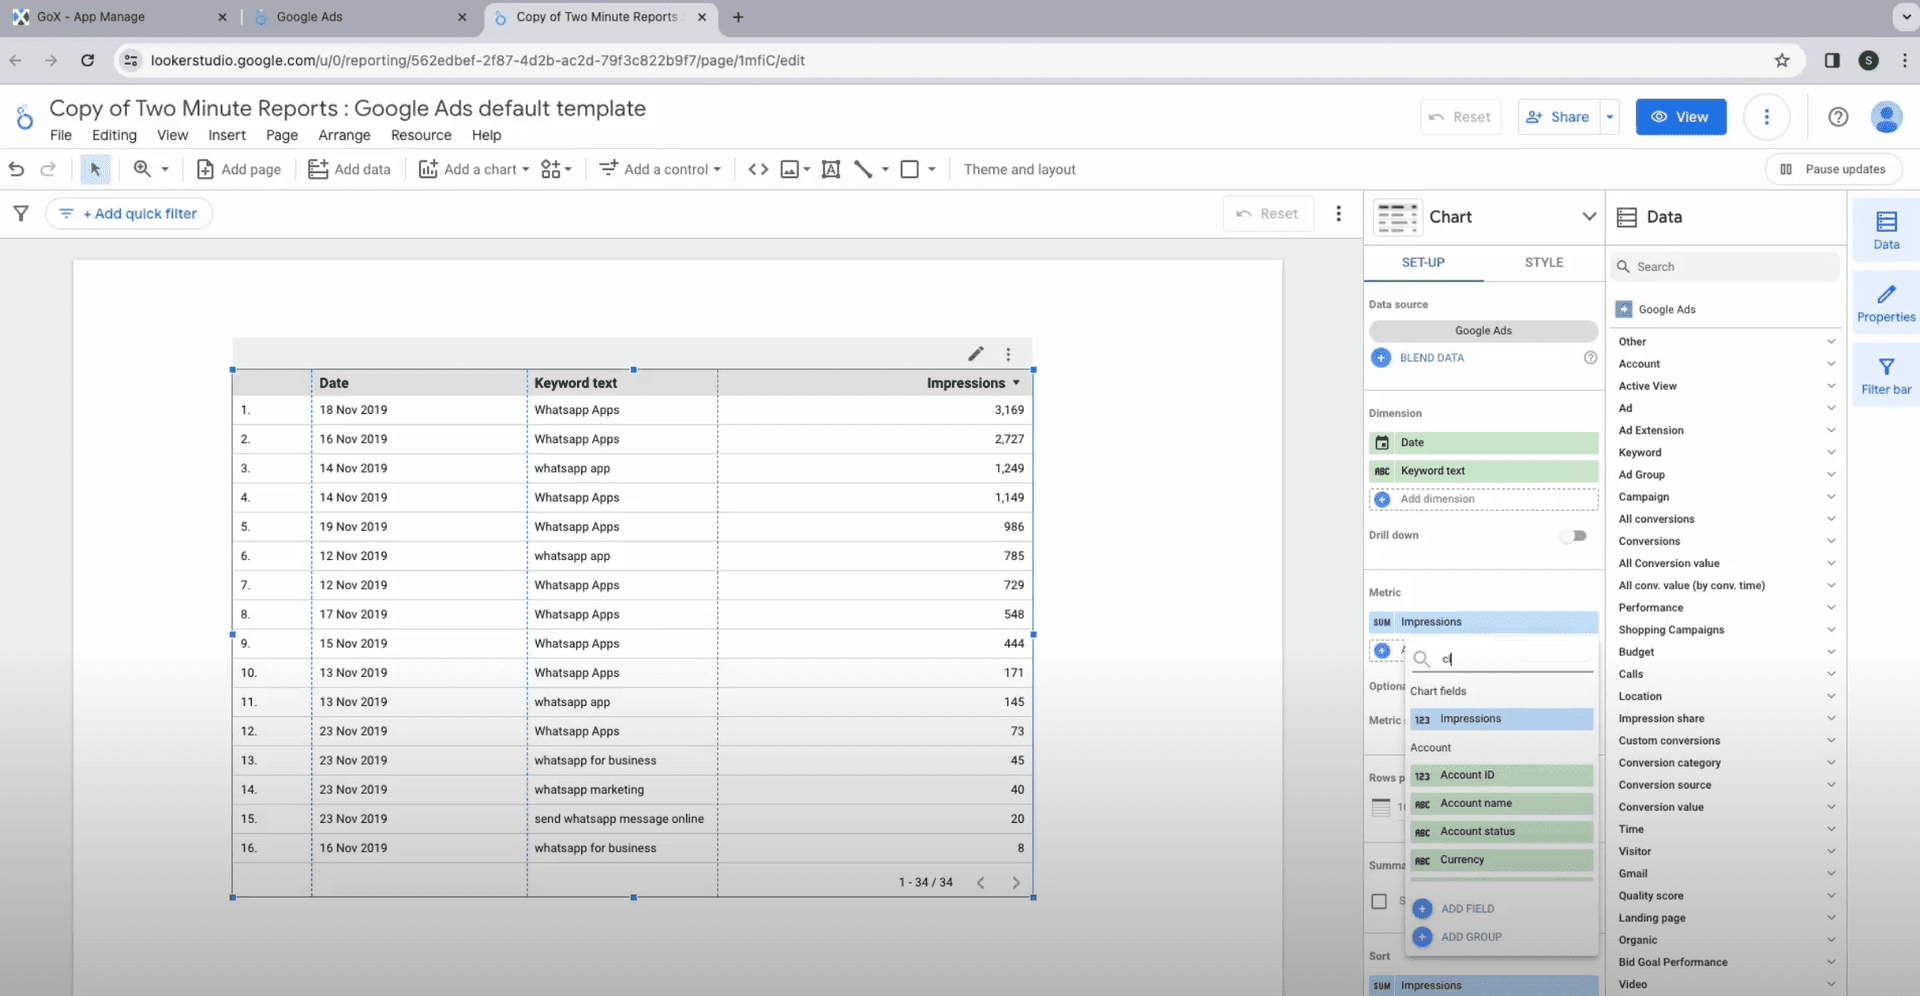
- Similarly for Dimensions, you can explore options like date, keyword, text, campaign name, campaign ID, keyword text, users’ visit, campaign start and end date, URL, and all other campaigns related insights. Choose one from the drop down.
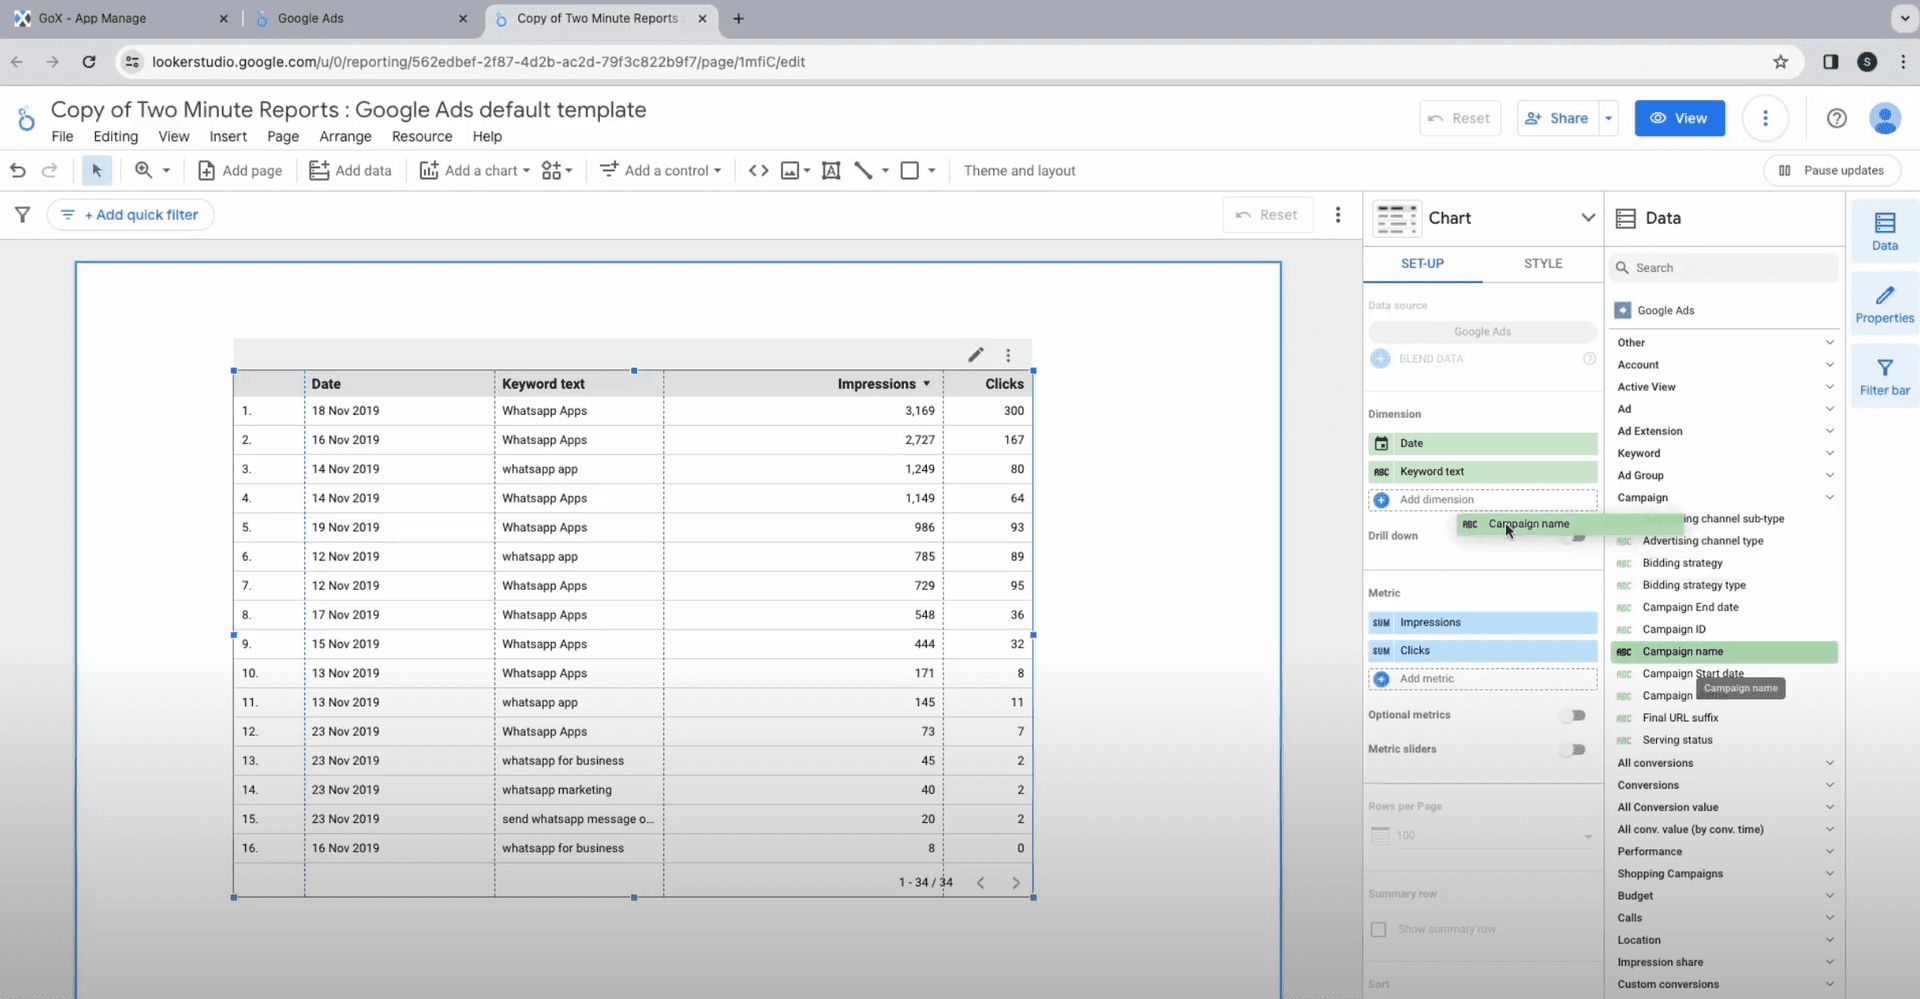
- Note that you can also pick fields and parameters for Dimensions and Metrics from the data sidebar and drag and drop under Chart sidebar.
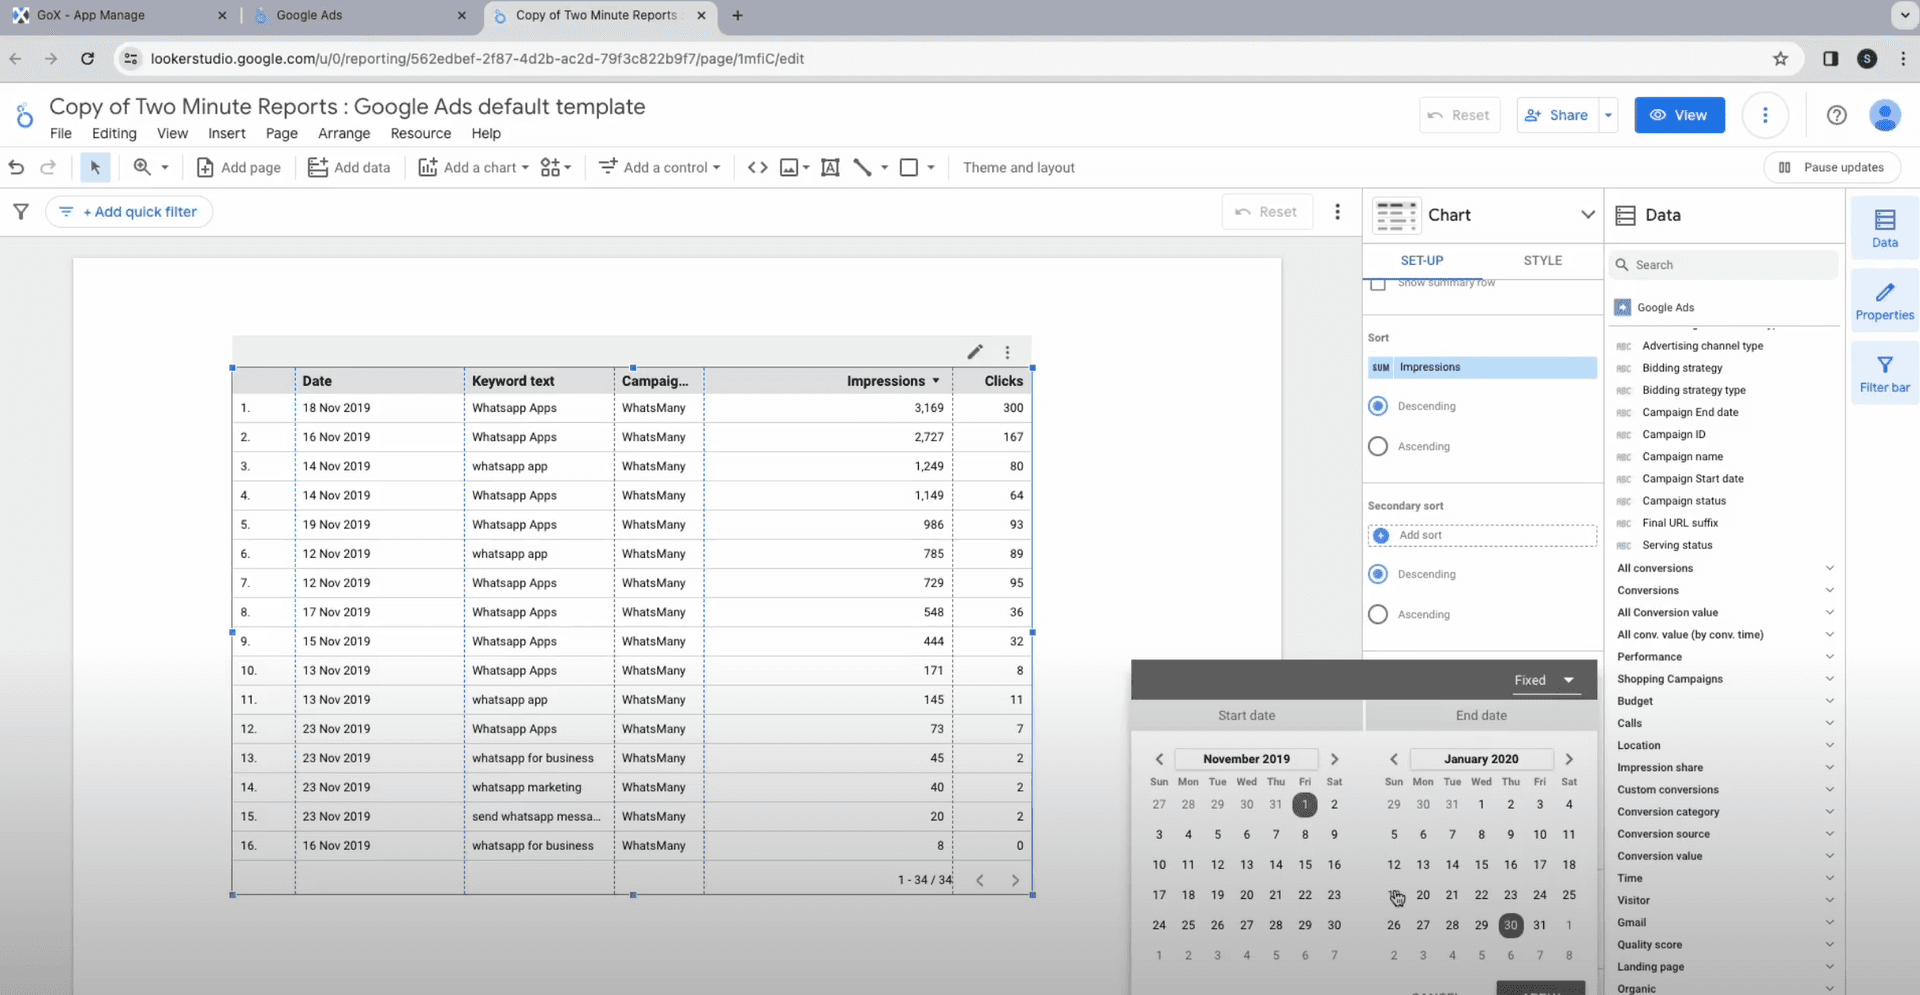
- Now select Date range control under the Date filter. Choose a range or click on the duration in the drop-down menu.
Now just sit back and wait for Looker Studio Google Ads to visualize Google ads data and create a performance report for you in great detail.
Method 2: Use Templates to connect to Google Ads Looker Studio
Repeat the first few steps, select data source. Then, click on “Create Report”.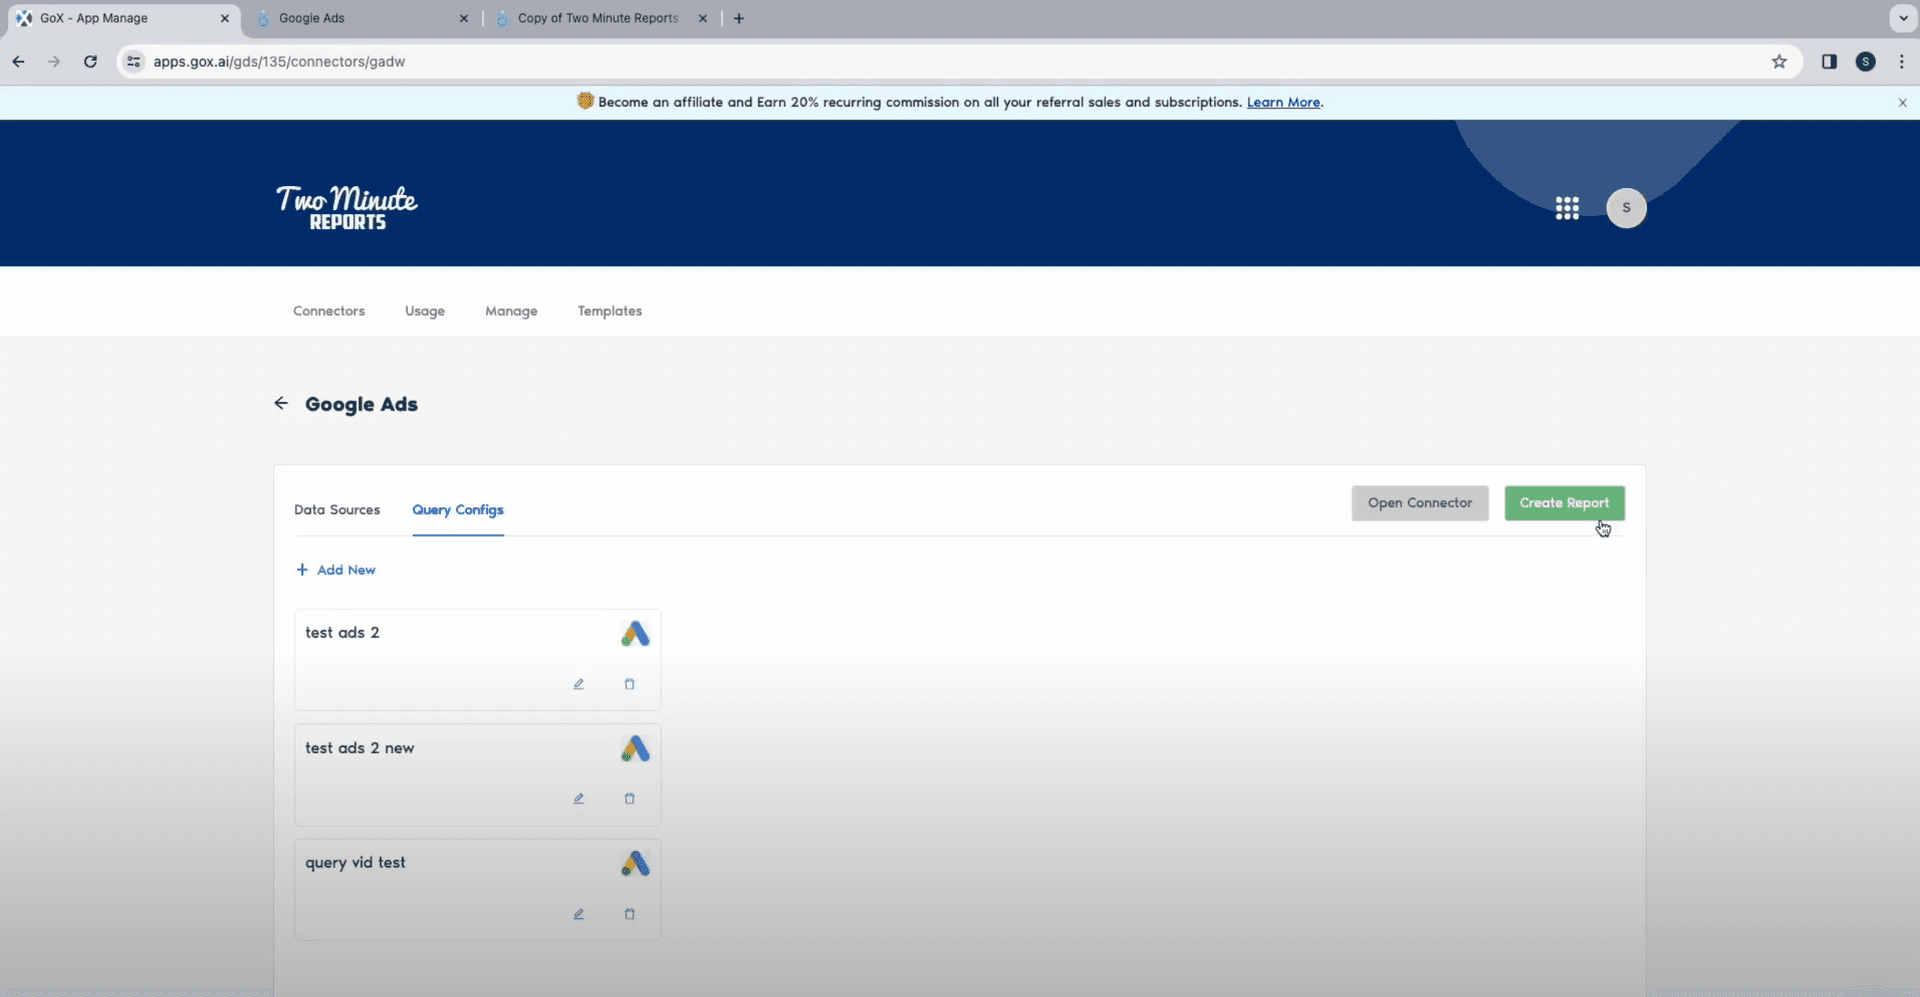
- Set your configurations for data queries and click on Next. You will now see all the Google Ads Google Data Studio built-in templates for Google Ads overview, Google Ads vs Facebook Ads, Multi Data Source Dashboard, Google Ads Monitoring report, Google Ads Visibility overview, and so on. Click on the one that best fits your needs.
- Select the team you want to collaborate with and click on Next.
Pick your configurations for data source and click on Connect at the top right corner. 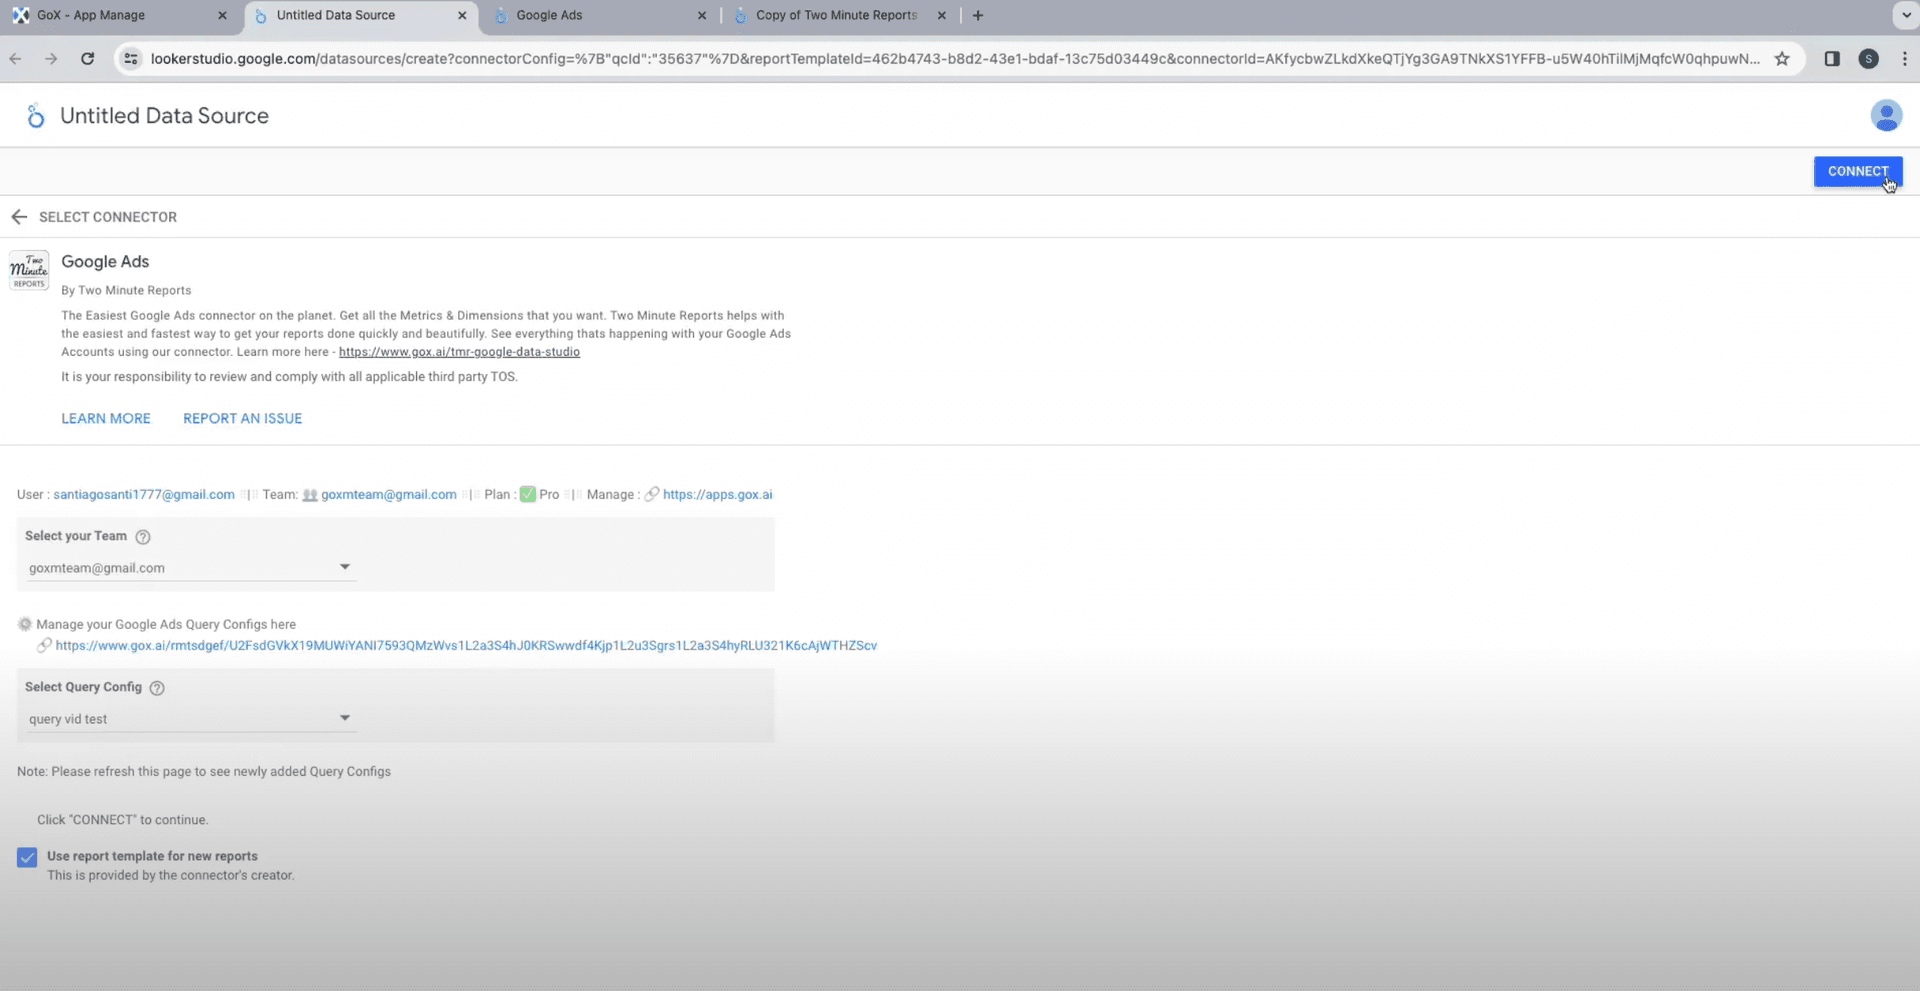
- You will see the customization window for parameters and fields for your Ads performance reporting. Eliminate or add fields and parameters as per your need and click on Create Report.
- Next, authorize the data export activity and complete creating the report with tables, graphs, charts, and other visualization tools.
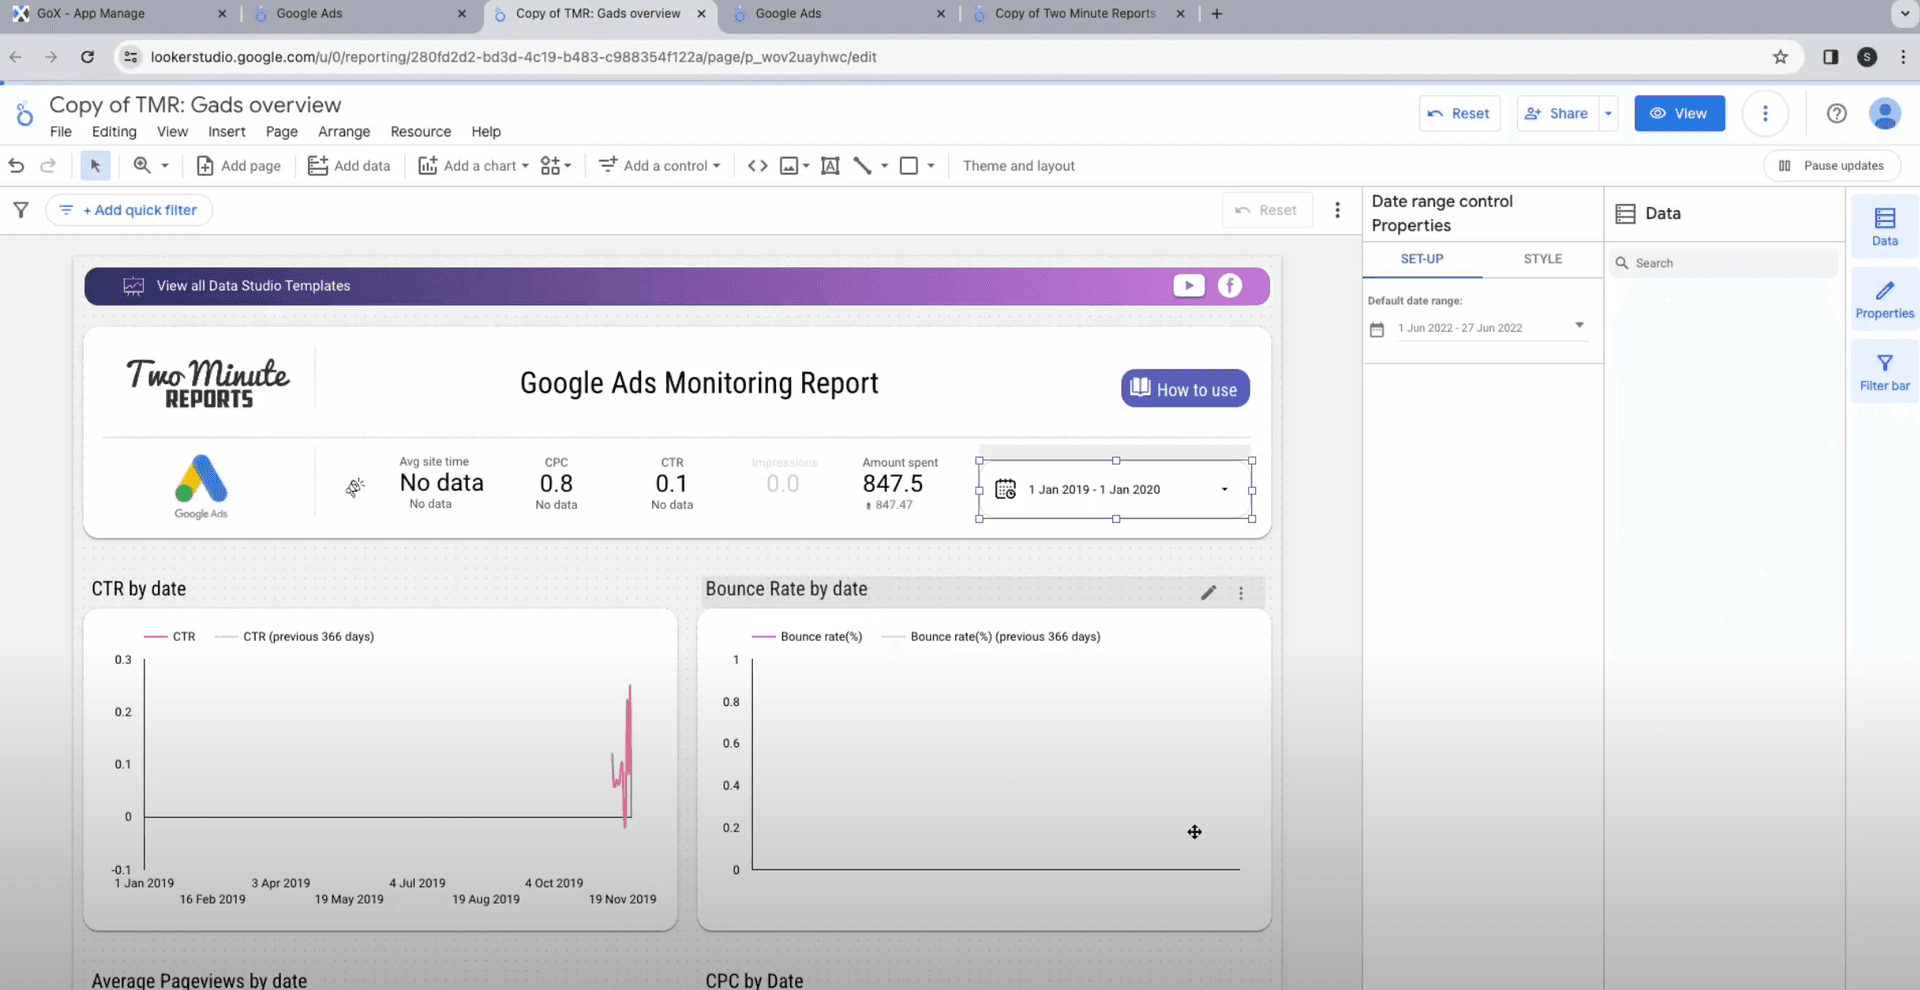
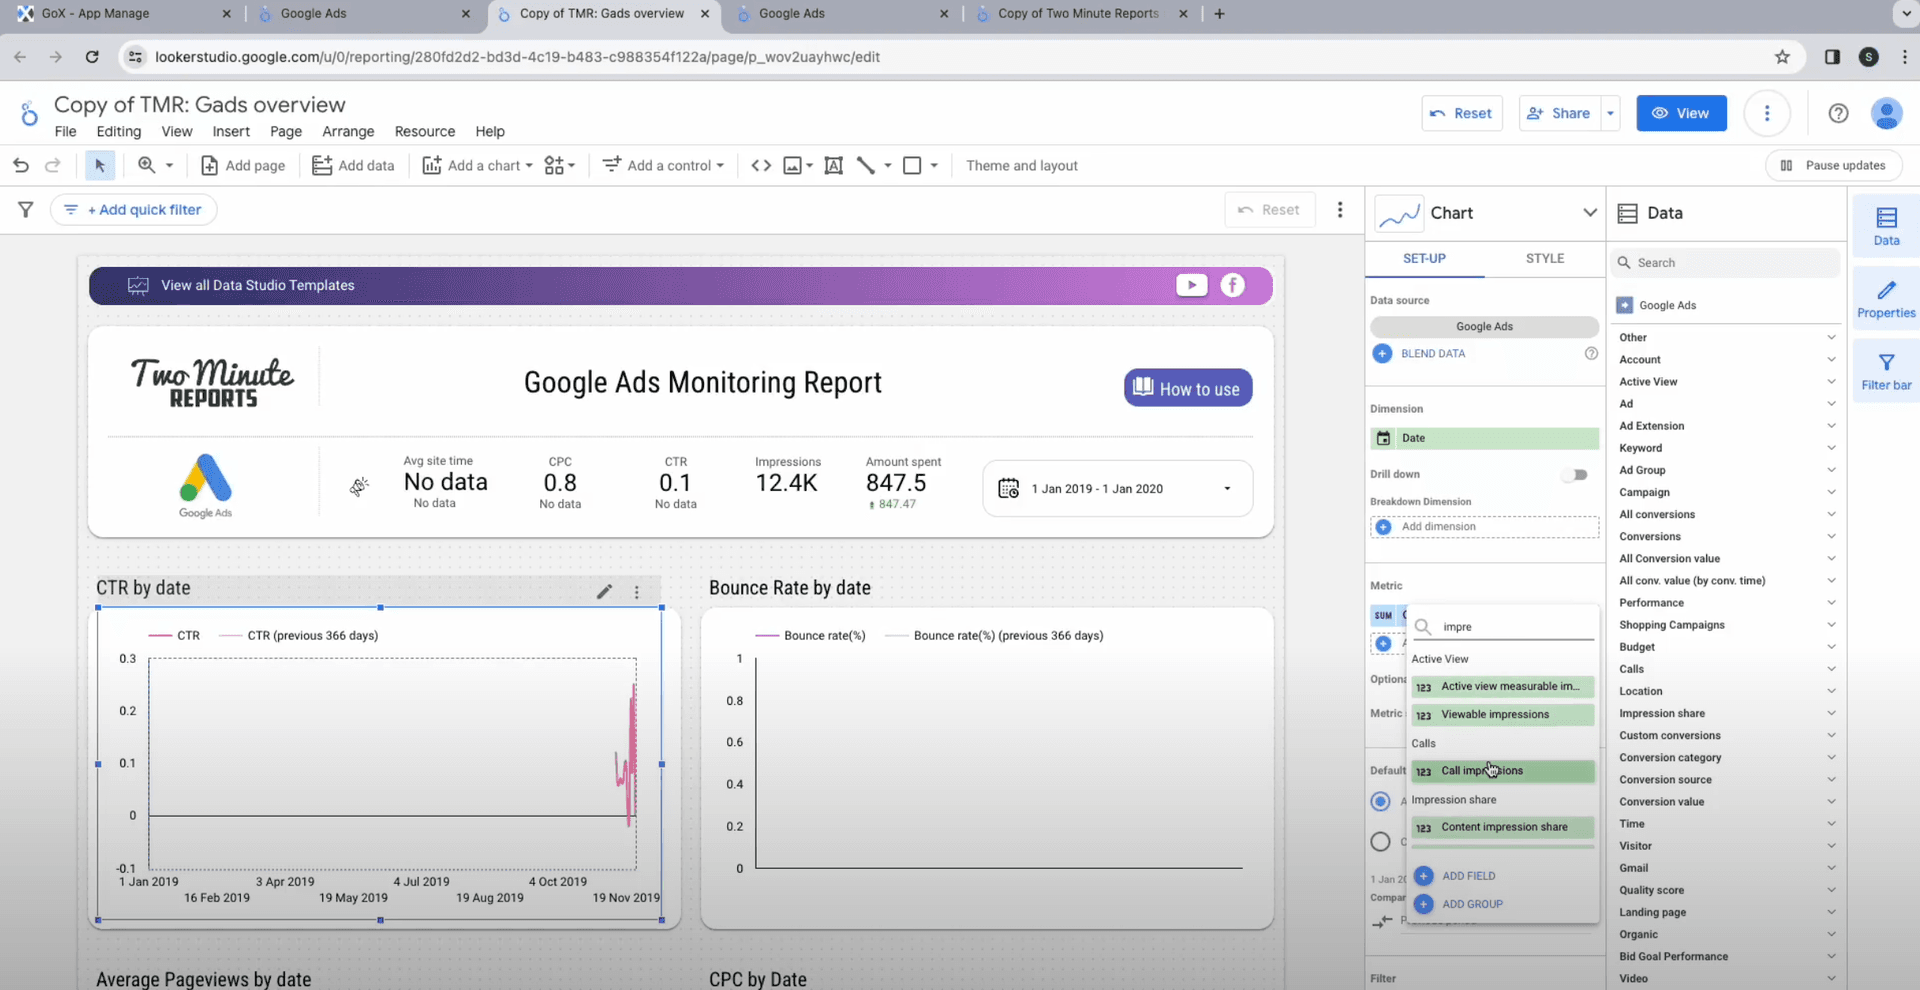
- You can enhance your charts by adding metrics like CTRs, active views, timezone, impressions, shares, views, etc. Choose one from the drop down. Similarly, you can add Dimensions for your performance report. As mentioned before, you can choose to drag and drop from the data sidebar.
Now let Ads Looker Studio arrange all details and create a comprehensive Google Ads performance report for you.
Start using these quick templates for looker studio now
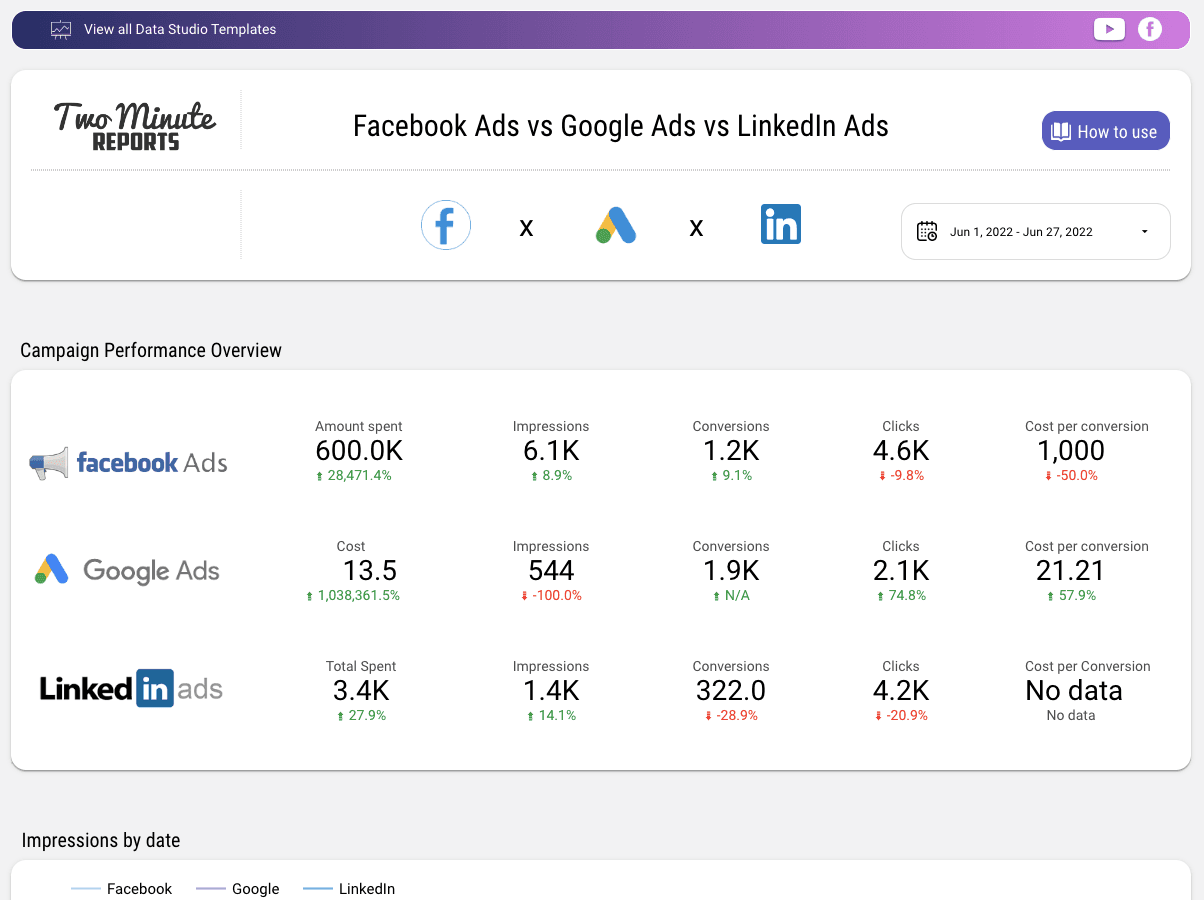
1. Facebook Ads vs Google Ads vs LinkedIn Ads
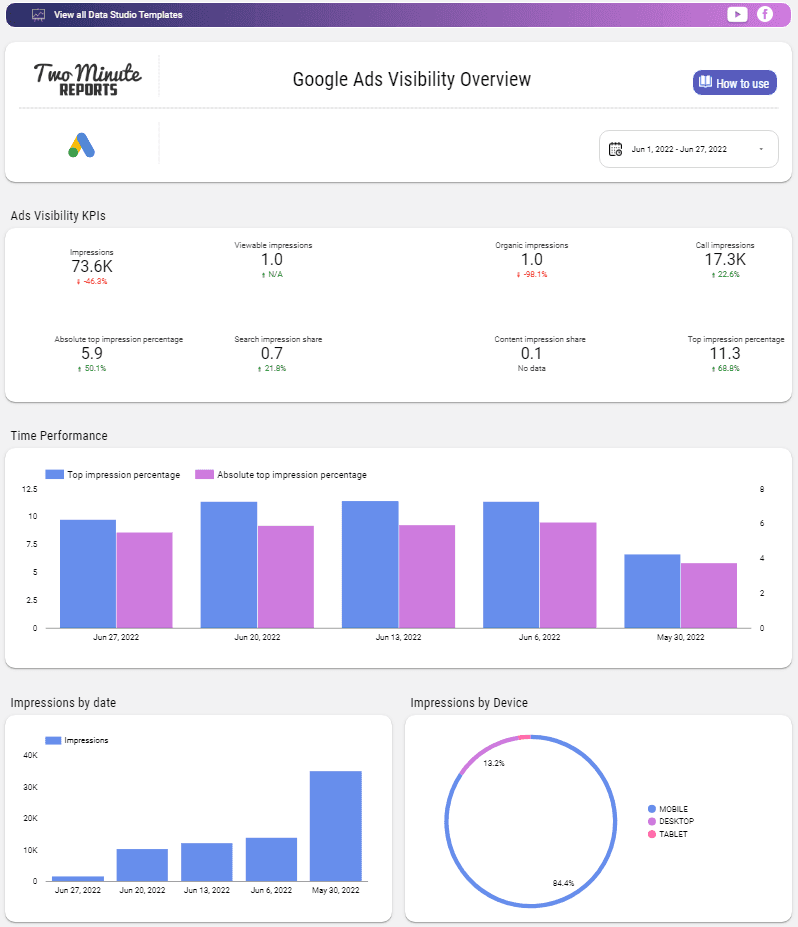
2. Google Ads Visibility Overview
Why Connect to Google Ads Looker Studio?
While standard marketing tools give you straightforward performance analytics, you won’t get in-depth understanding unless you apply customized filters and evaluate performance from a 360-degree perspective. Here’s how connecting to Data Studio Google Ads with TMR helps.
Generate comprehensive and dynamic Ads report
Use Looker Studio to connect to Ads and create reports with real-time data. Analyze ad performance, including clicks, impressions, and conversions, to enhance your advertising ROI.
Automate monthly and weekly reporting process
Simplify report creation with Looker Studio. Automate weekly or monthly updates, easily share reports with your team and stay informed on campaign performance, growth metrics, and KPIs. Save time with automated report generation for consistently updated information.
Increased data accessibility and collaboration
Unlock the capabilities of Google Data Studio for interactive dashboards and reports. Customize visual representations without changing the original data, fostering collaboration. Enable your team to access crucial insights for enhanced campaign planning and strategy.
Top KPIs of GA4 to be used in Looker Studio
Thoughtful use of ads on Looker Studio will not only help you get a holistic view of ads but will give you access to detailed performance analysis. Here are a few things you can explore while analyzing the Ads on Looker Studio.
Videos
Assess ad performance for videos with Ads metrics like views, view rate, and watch rate. Improve campaigns with engaging content and targeted strategies. Optimize thumbnail impressions for better view rates and create attention-grabbing videos for improved watch rates.
| Title | Description |
| Video views | The number of times your video ads were viewed |
| Video view rate (%) | The number of views your TrueView video ad receives divided by its number of impressions, including thumbnail impressions for TrueView in-display ads |
| Watch 50% rate | Percentage of impressions where the viewer watched 50% of your video |
| Watch 100% rate | Percentage of impressions where the viewer watched 100% of your video |
Conversions
Assess Cost per Conversion, Conversion Rate Percentage, and Value per Conversion to gauge campaigns' effectiveness. Analyze website and cross-device conversions with All Conversions and evaluate Display Network ads' impact on View-Through Conversions. Optimize budget and enhance ad performance with these valuable insights.
| Title | Description |
| Conversions | The number of conversions. This only includes conversion actions which include_in_conversions_metric attribute is set to true. |
| Cost per Conversion (CPC) | The cost of ad interactions divided by conversions.This only includes conversion actions which include_in_conversions_metric attribute is set to true. |
| View-through conversions | The total number of view-through conversions. These happen when a customer sees a Display network ad, then later completes a conversion on your site without interacting with (e.g. clicking on) another ad. |
| Value per Conversion | The value, on average, of a conversion |
Impression share
Track Search and Content impression share, along with Lost IS due to budget or rank. Optimize results by examining exact match impression share and top location performance.
| Title | Description |
| Search top impression share | The impressions you've received in the top location (anywhere above the organic search results) compared to the estimated number of impressions you were eligible to receive in the top location. |
| Content impression share | The impressions you've received on the Display Network divided by the estimated number of impressions you were eligible to receive |
| Lost content IS due to budget | The estimated percent of times that your ad was eligible to show on the Display Network but didn't because your budget was too low. |
| Lost content IS due to rank | The estimated percentage of impressions on the Display Network that your ads didn't receive due to poor Ad Rank |
Keyword
Track top-performing search terms and evaluate match types and quality scores in Google Sheets. Use keyword ID in Google Sheets to organize and optimize campaigns for maximum effectiveness.
| Title | Description |
| Quality score | The quality score |
| Creative quality score | The performance of the ad compared to other advertisers |
| Post-click quality score | The quality score of the landing page |
| First position CPC | The estimate of the CPC bid required for ad to be displayed in first position, at the top of the first page of search results |
Analyze keyword effectiveness, track top-performing terms using search term data, optimize match types, and ensure relevance with quality scores. Organize campaigns efficiently using keyword IDs for maximum effectiveness.
Get Google Ads in Google Sheets too!

Two Minute Reports is also available as a Google Sheets add-on. This add-on is designed to simplify complex data analysis and visualization, making the best use of Google Sheets’ tools and features.
This add-on allows the creation of detailed reports and dashboards using insights from Google Ads without the complexity of manual data entry. TMR for Google Sheets also enables users to develop custom formulae in a user-friendly interface.
With a seamless Google Ads to Looker Studio integration, comprehensive analytical capabilities, and automated workflows, strategic business intelligence has just become quicker and more accessible.
Connect other Platform Data Sources with Google Sheets
Facebook Ads
Social media ad platform for targeted audience reach.
Linkedin Ads
Professional social media platform's advertising data source.
Snapchat Ads
Social media advertising platform for Snapchat users.
Tiktok Ads
Advertisement data on the TikTok social media platform.
FAQs
How do I connect Google Ads to Data Studio?
You can use our TMR. It will analyze all ads dimensions and parameters and help you optimize marketing strategies.
How do I use Looker Studio with Google Ads?
You can use APIs or integration for Looker Studio. Else you can use our pre-built templates or TMR to connect to Looker Studio and add your Google accounts.
Is Google Looker Studio free?
Google Looker Studio is free to use for creators and report viewers. But if you wish to connect to use paid data sources, manage team access, or automate data refreshes, then you would need to subscribe to Looker Studio Pro.
How do I create a Google ad dashboard?
You can do this in two ways.
Method 1
Visit lookerstudio.google.com, click "Create," choose "Blank report," connect your account, drag metrics and dimensions onto the report, customize visuals, add elements, save with a name, and share or embed as needed.
Method 2
Use our template for a multi data source dashboard and get all your important KPIs at one place.