Connect LinkedIn Ads to Looker Studio: Tutorial & Free Templates (2024)
Connecting LinkedIn Ads to Looker Studio and Automate It
We will explore the step-by-step guide to pulling LinkedIn ads data and adding it to your Google Data Studio and how you can visualize LinkedIn ads data. Our state-of-the-art solution will help you automate and pull out all the data and add it to Looker Studio, saving you all the manual work and time. Our comprehensive LinkedIn Ad reports analyze LinkedIn campaign performance in detail, then load data to your Google Data Studio and generate reports, so you don't have to write any code. Here's how our Looker Studio integration will work when you connect LinkedIn to Looker Studio.
- Use the Two Minute Reports connector for Looker Studio.
- Connect LinkedIn Ads to Looker Studio. Create your Data Sources and Query Config using LinkedIn Ad connector. Then you would need to create a report.
Setting your Data Query and Query Configs
Check out the process to use Two Minute Reports for Looker Studio. Once you have it, you will have to
 Click on Products -> Two Minute Reports for Looker Studio. It will redirect you to the Two Minute Reports page. You will see the Accounts options. Click on it.
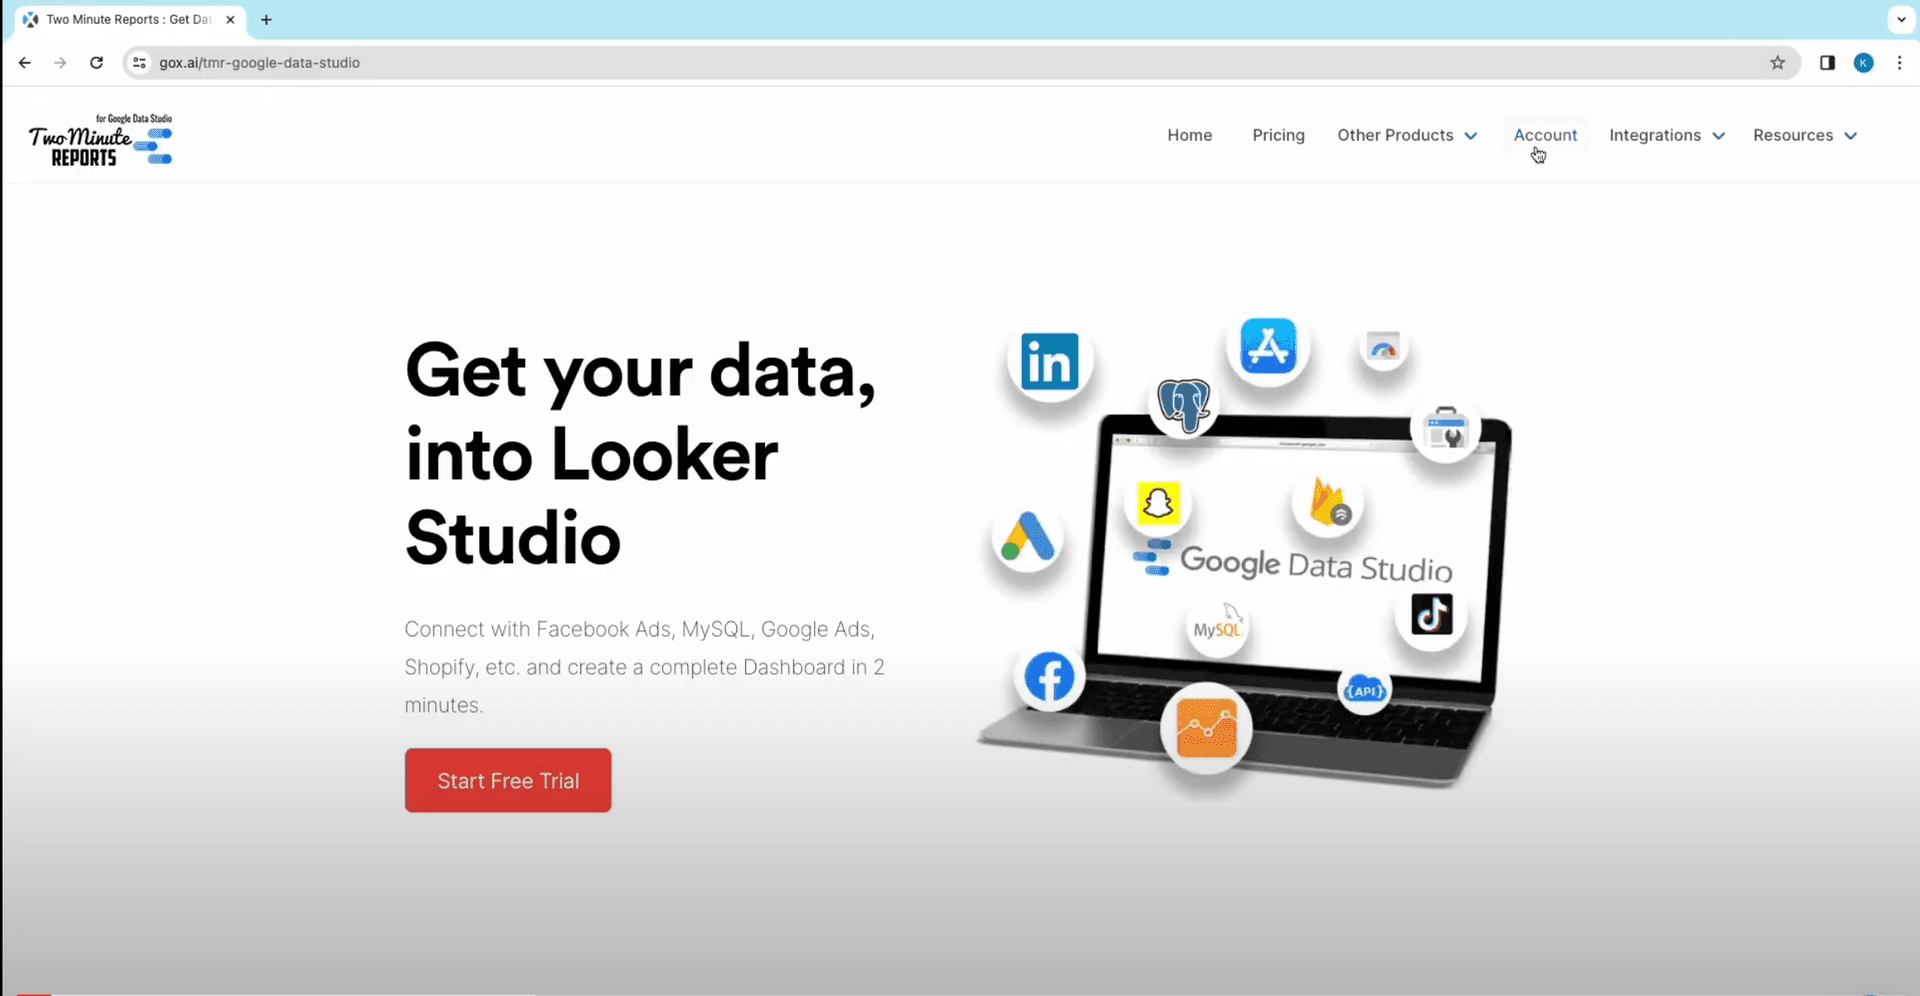
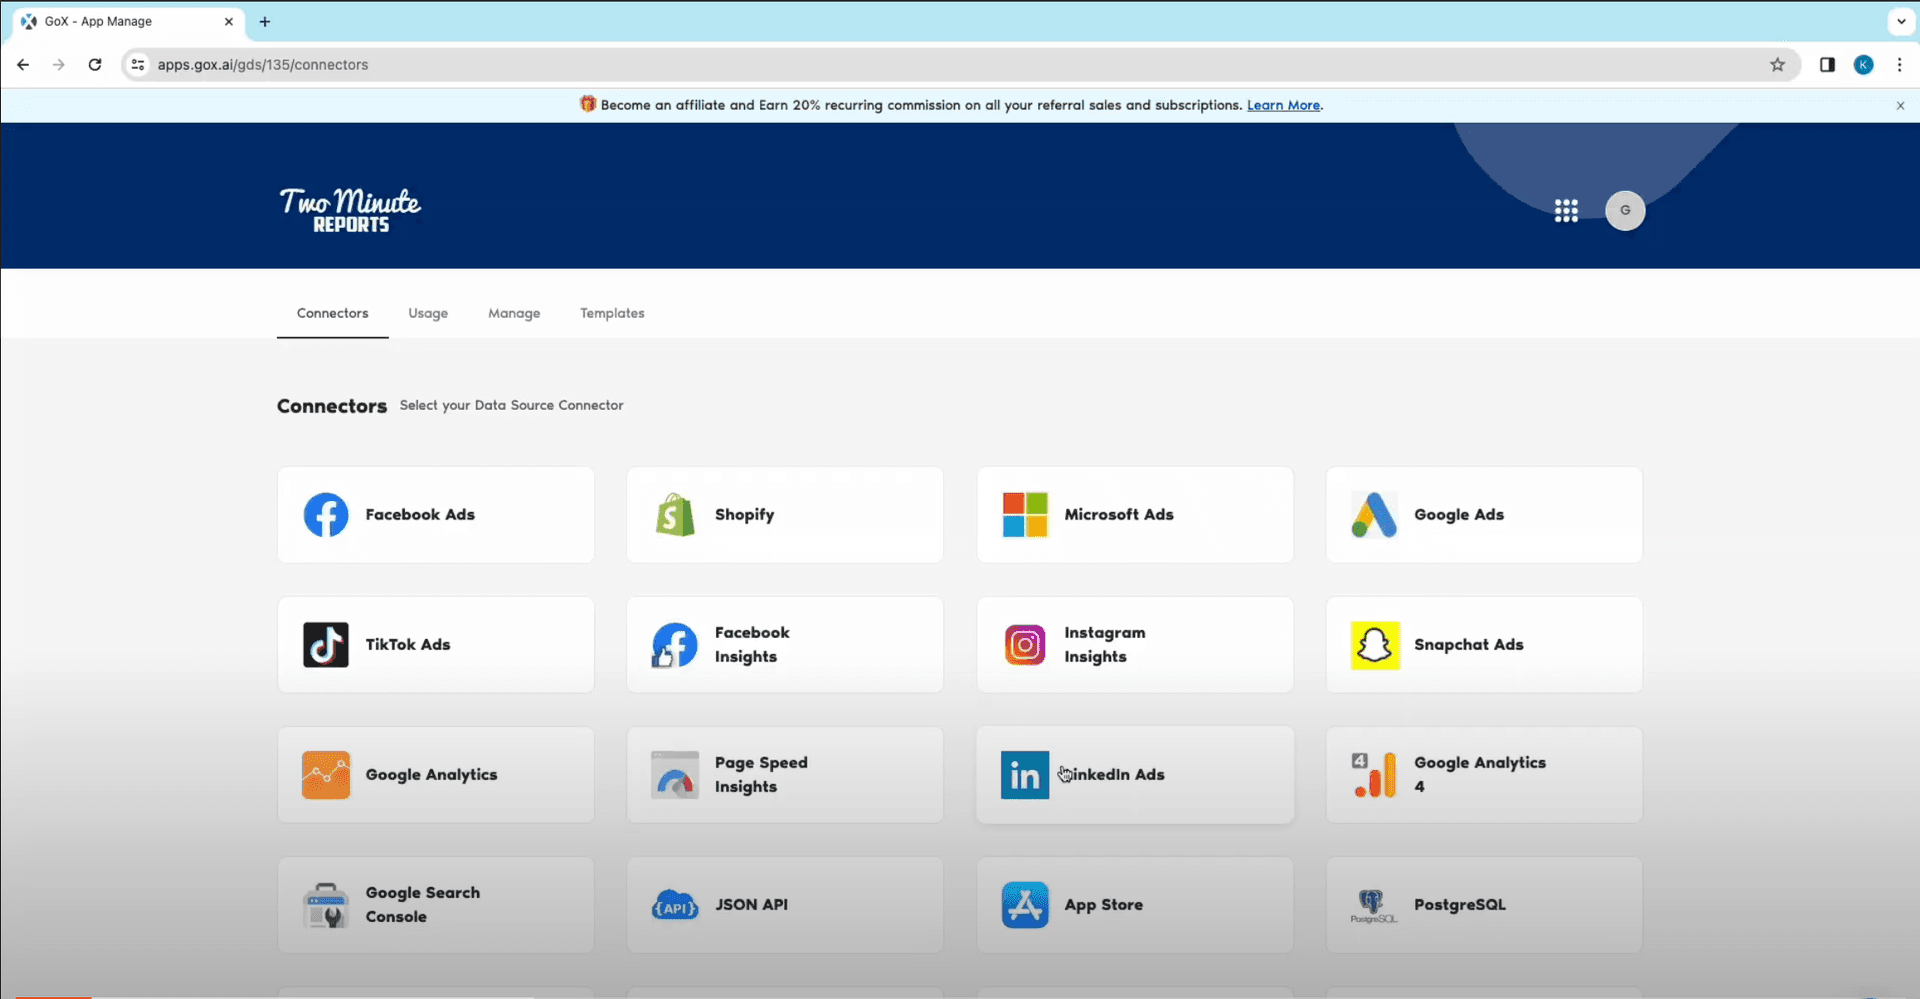
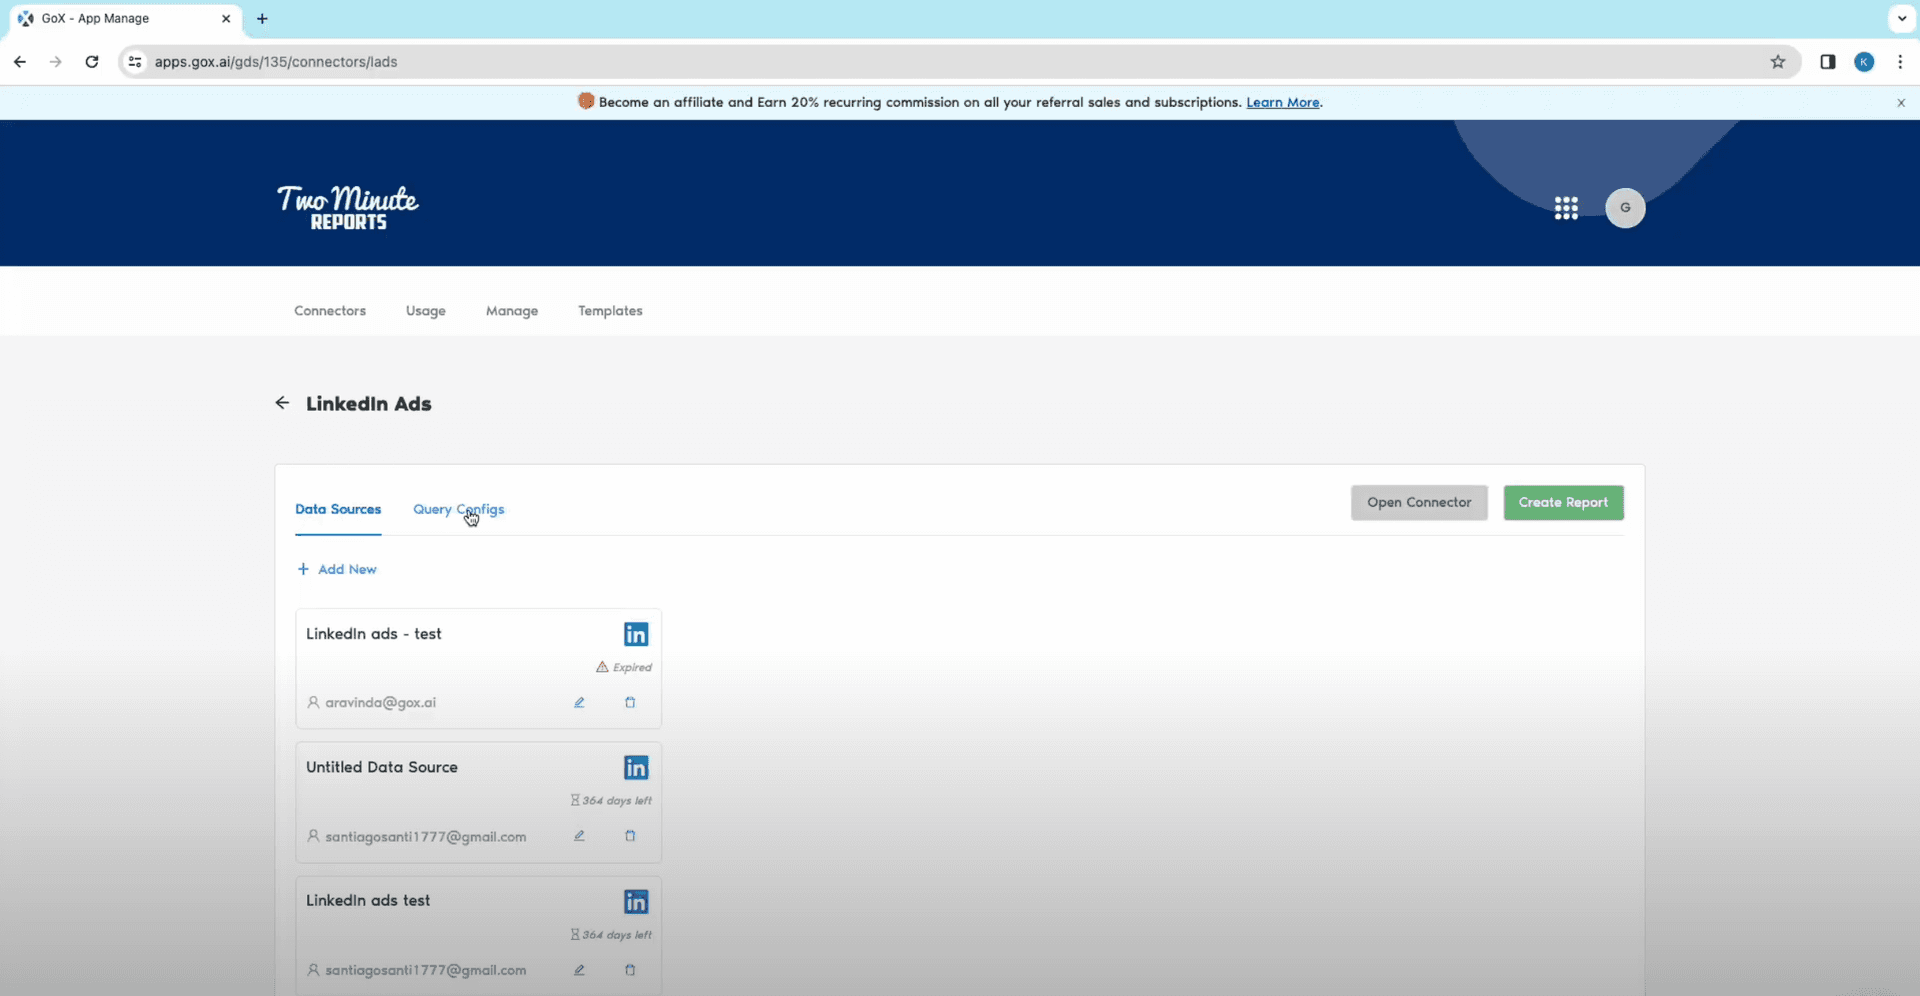
- You will see the list of teams you are part of. You can click on the team you want your report to be created. You will see Data connectors for various channels and platforms. Select LinkedIn Ads.
- You will now see options to fill in data queries. Click on Add New, name your Data Source and then click on ‘Sign in with LinkedIn’. Login to your LinkedIn ads account.
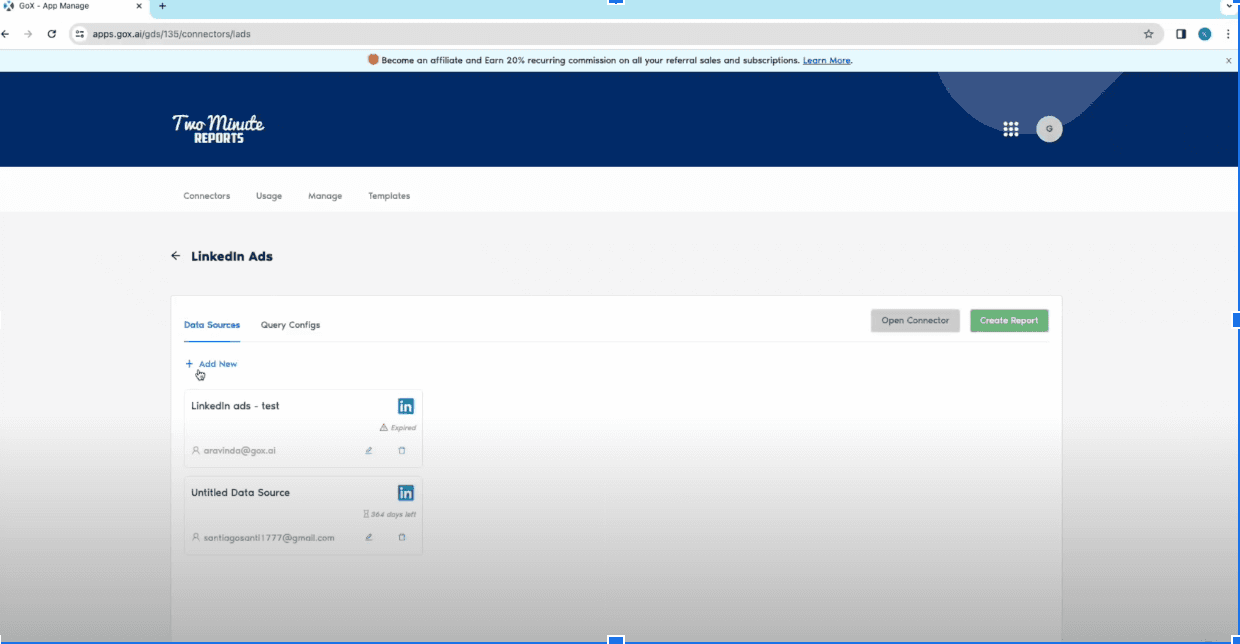
- Once you have successfully logged in, click on the Query Configs beside the data query.
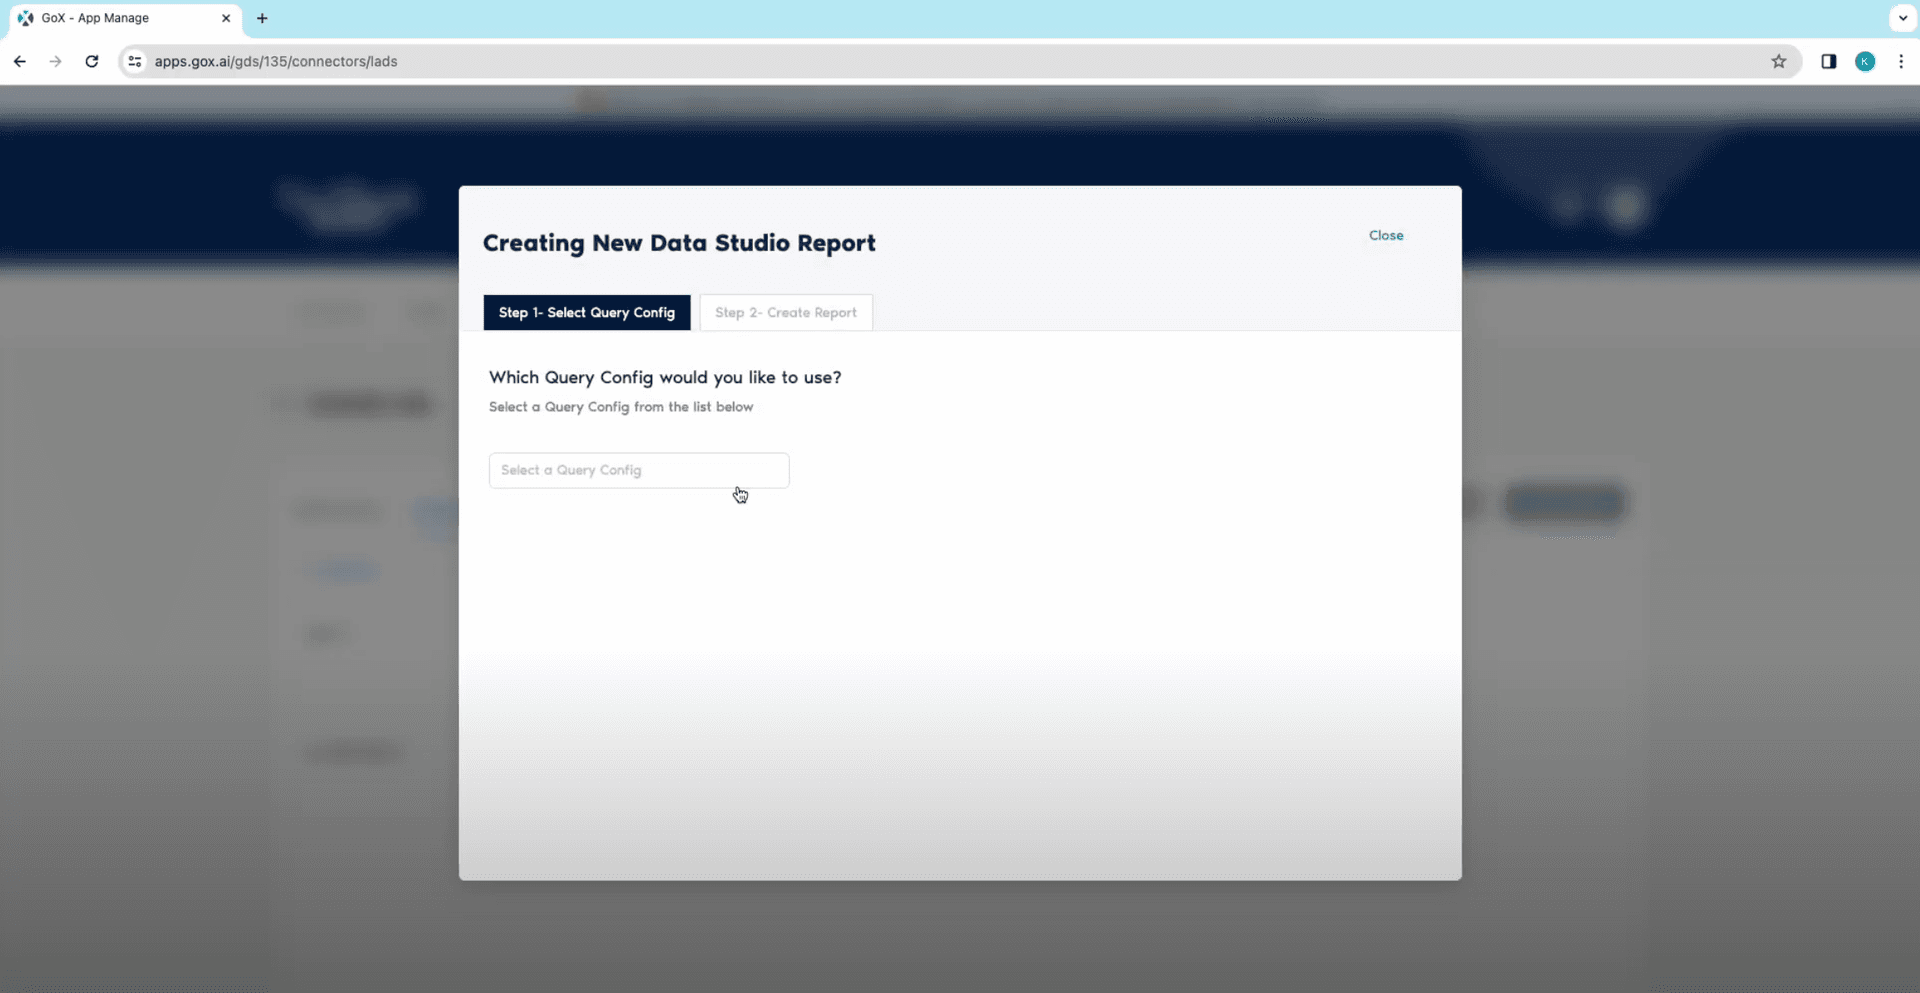
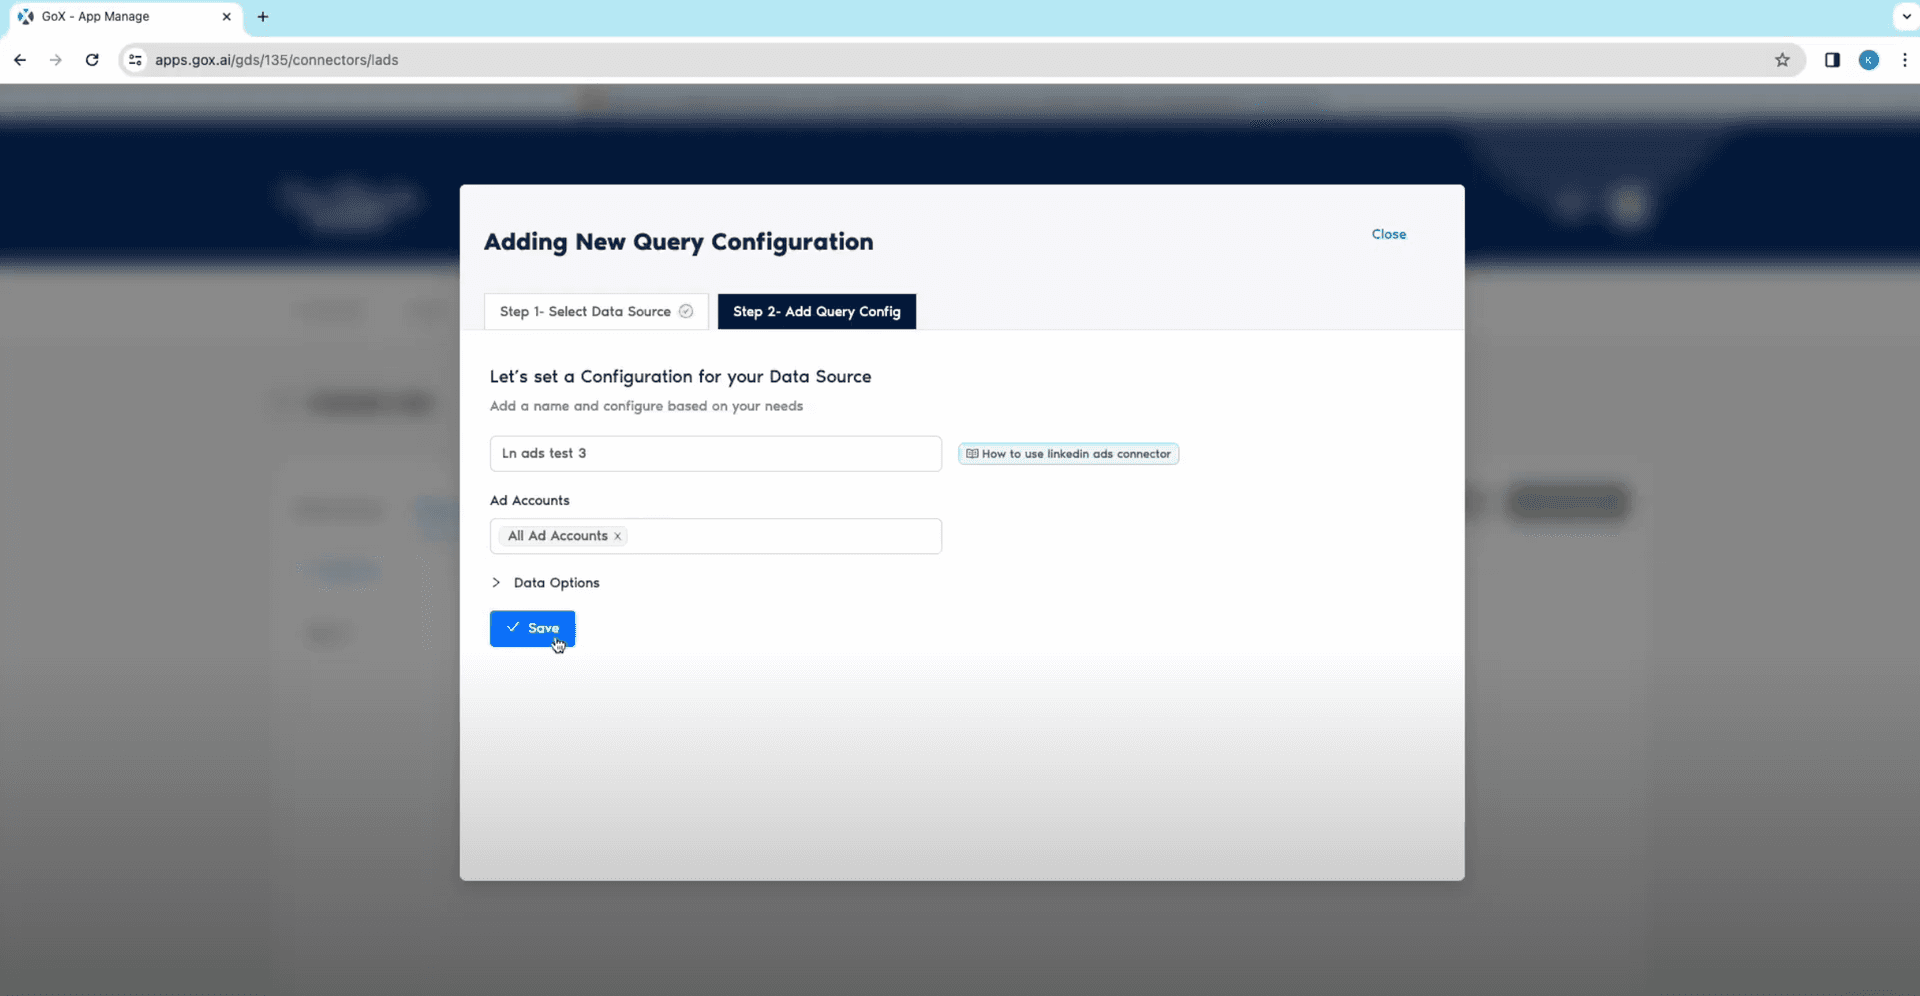
- A new dialog box will appear. Click on Add New. Add your previously added Data Query and click on Next.
- You will now be asked to set a query config for your Data Source. You can add a name for your configuration, add your LinkedIn account and save it.
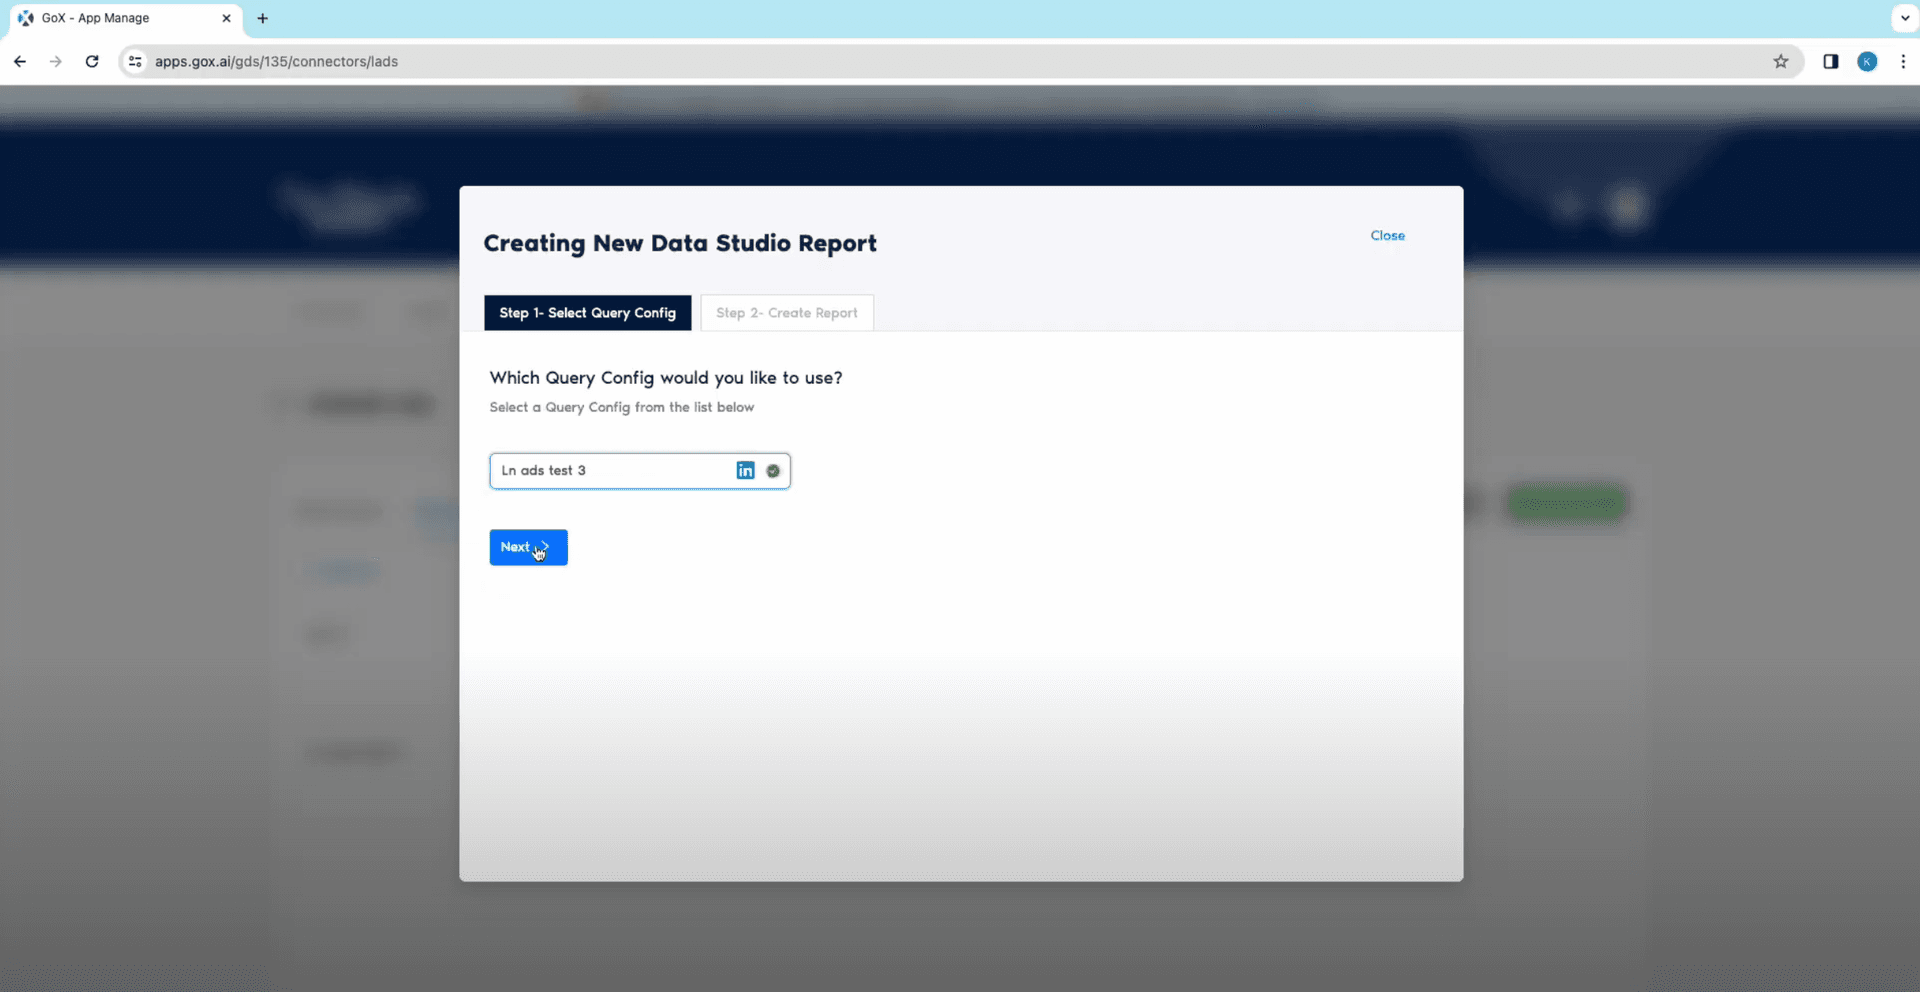
- Click on Create Report. You will be asked to pick the Query Config. Choose your required Query configuration from the drop down and click on Next.
From here you can decide whether you want to prepare a Google Data Studio Report from scratch or leverage our built-in Templates for LinkedIn ads.
Method 1: Create a Looker Studio Report from scratch
Now that you are all set with your data queries to work with, it’s time to dive into creating a report.
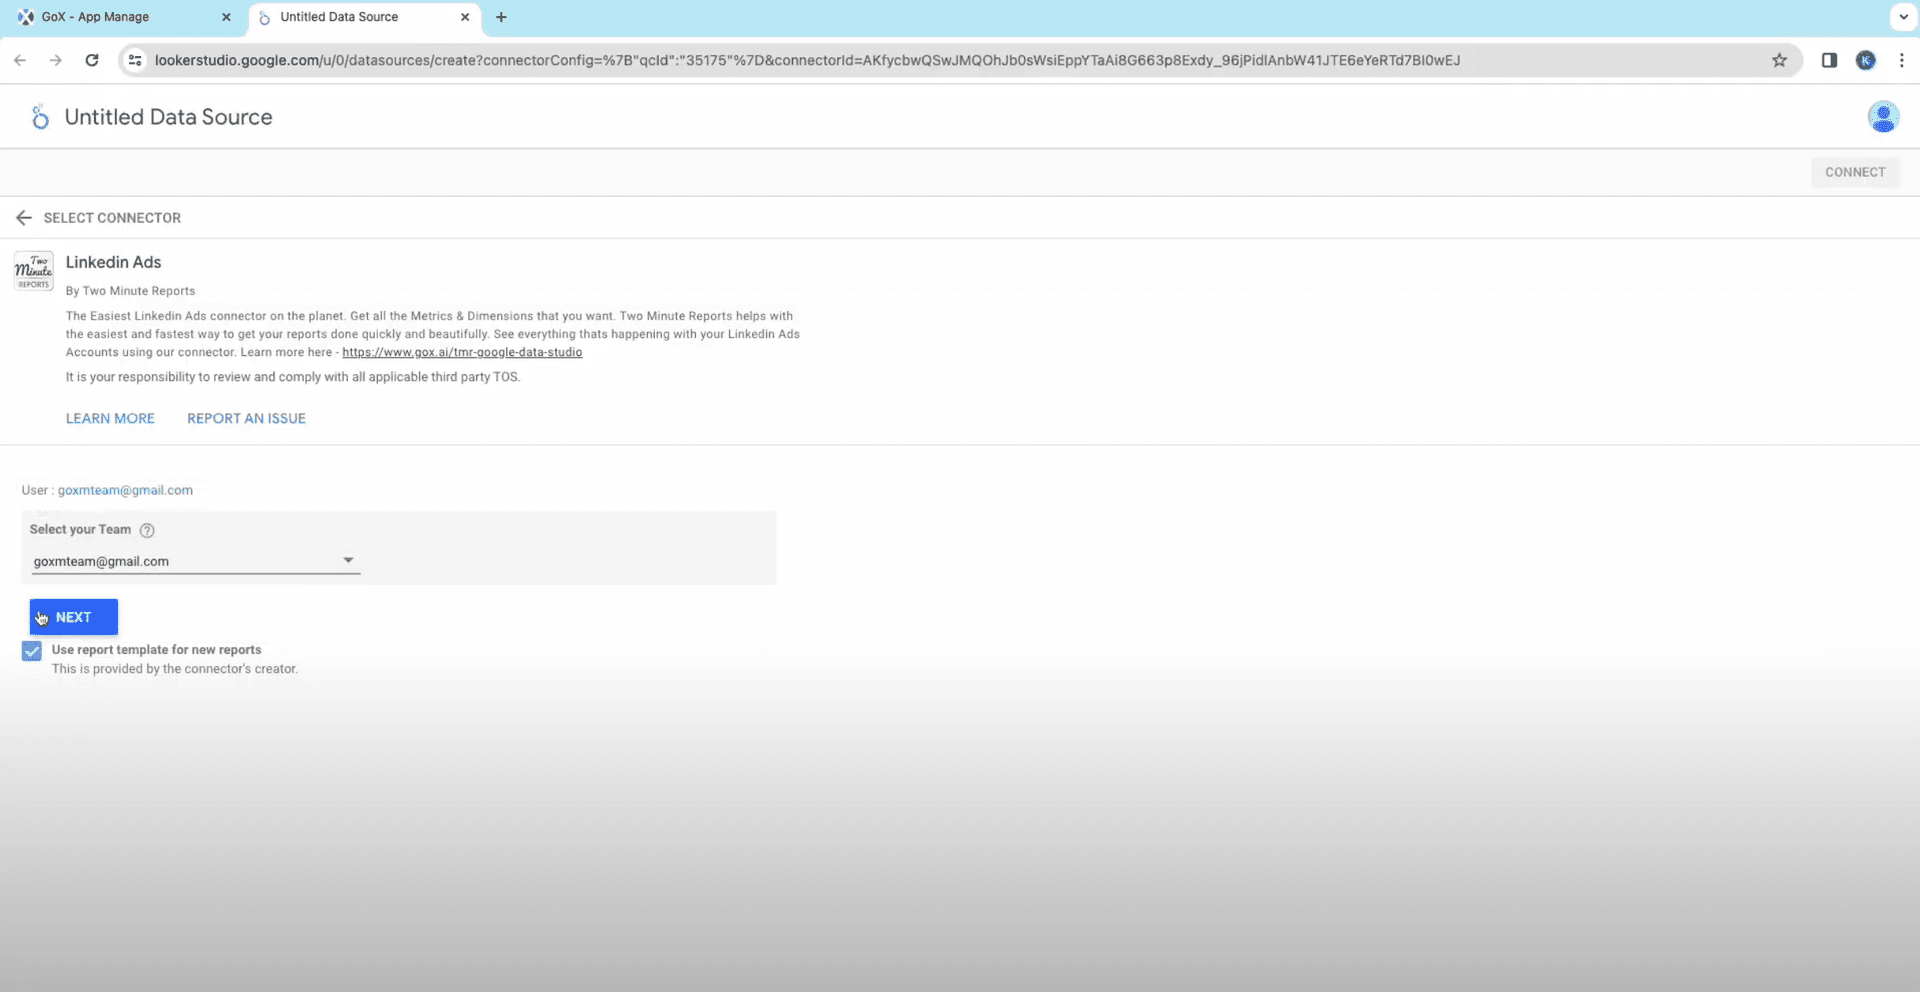
- Go to New Data Studio Report > step 2 > "Create Report from Scratch.
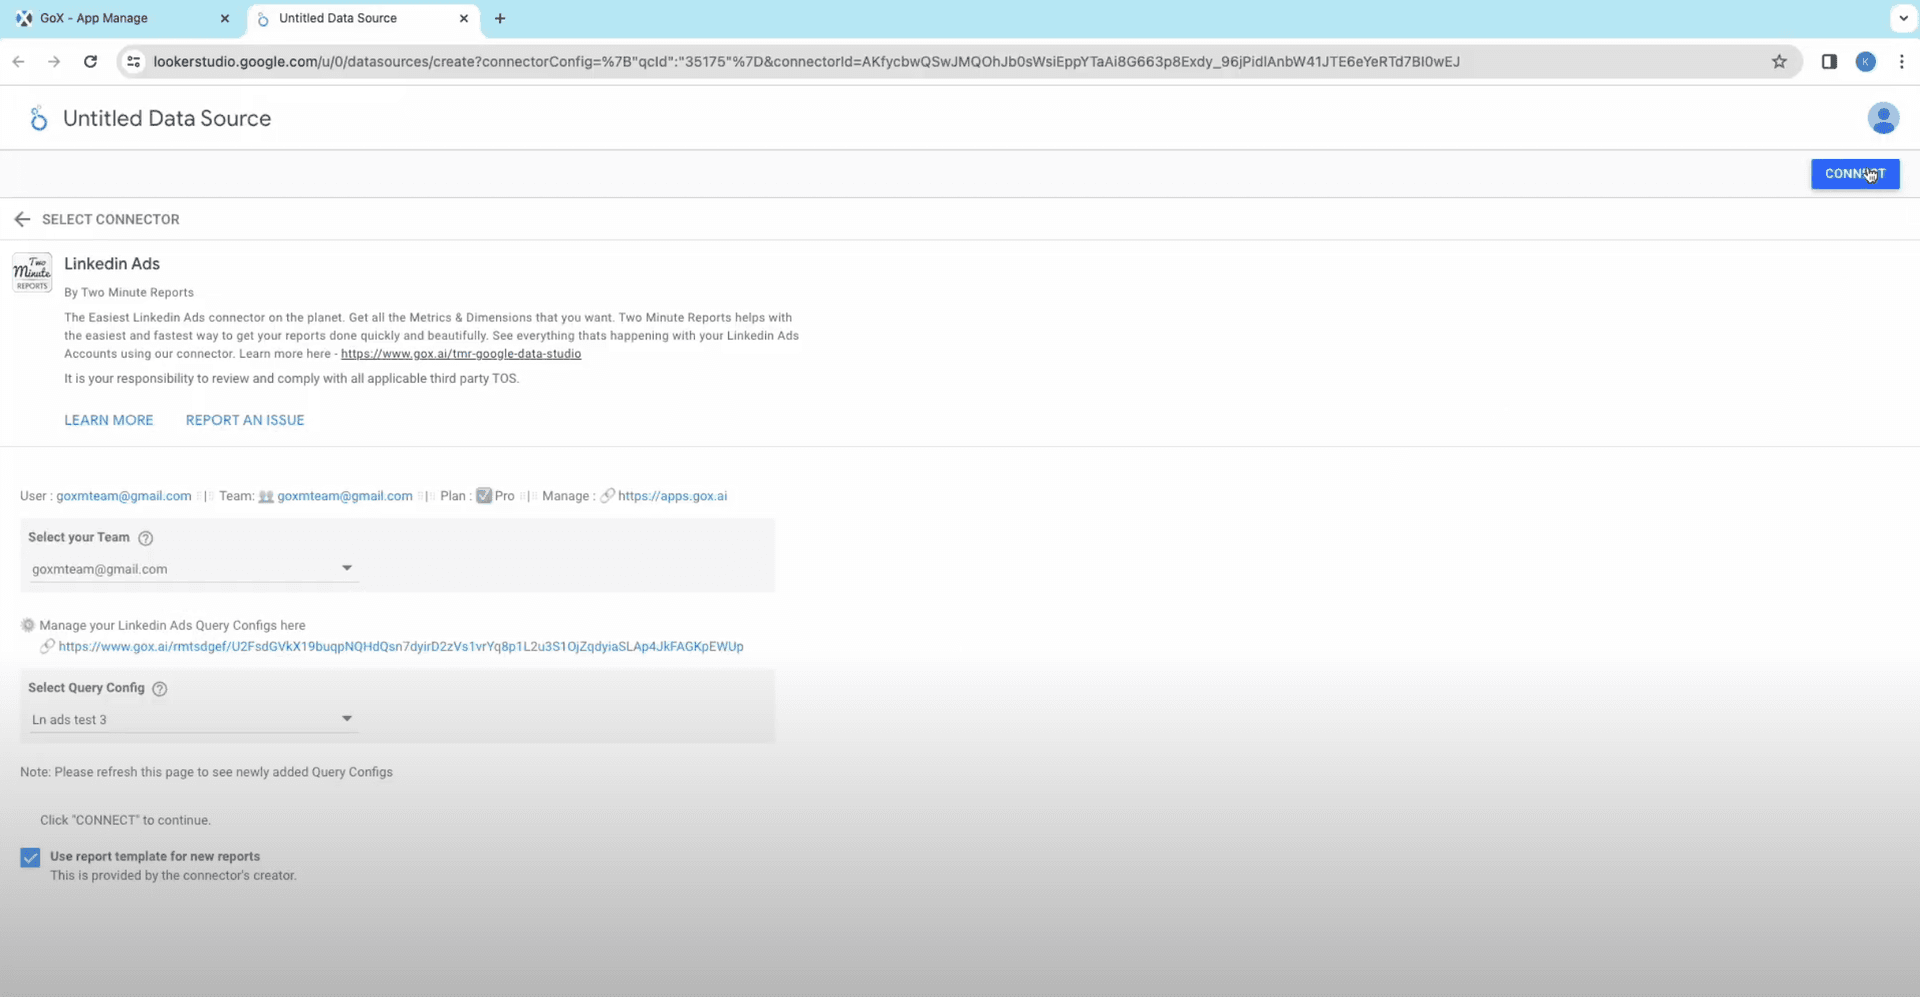
- Select your Team to add your report and click on Next. Choose your Query Config from the drop down and click on Connect.
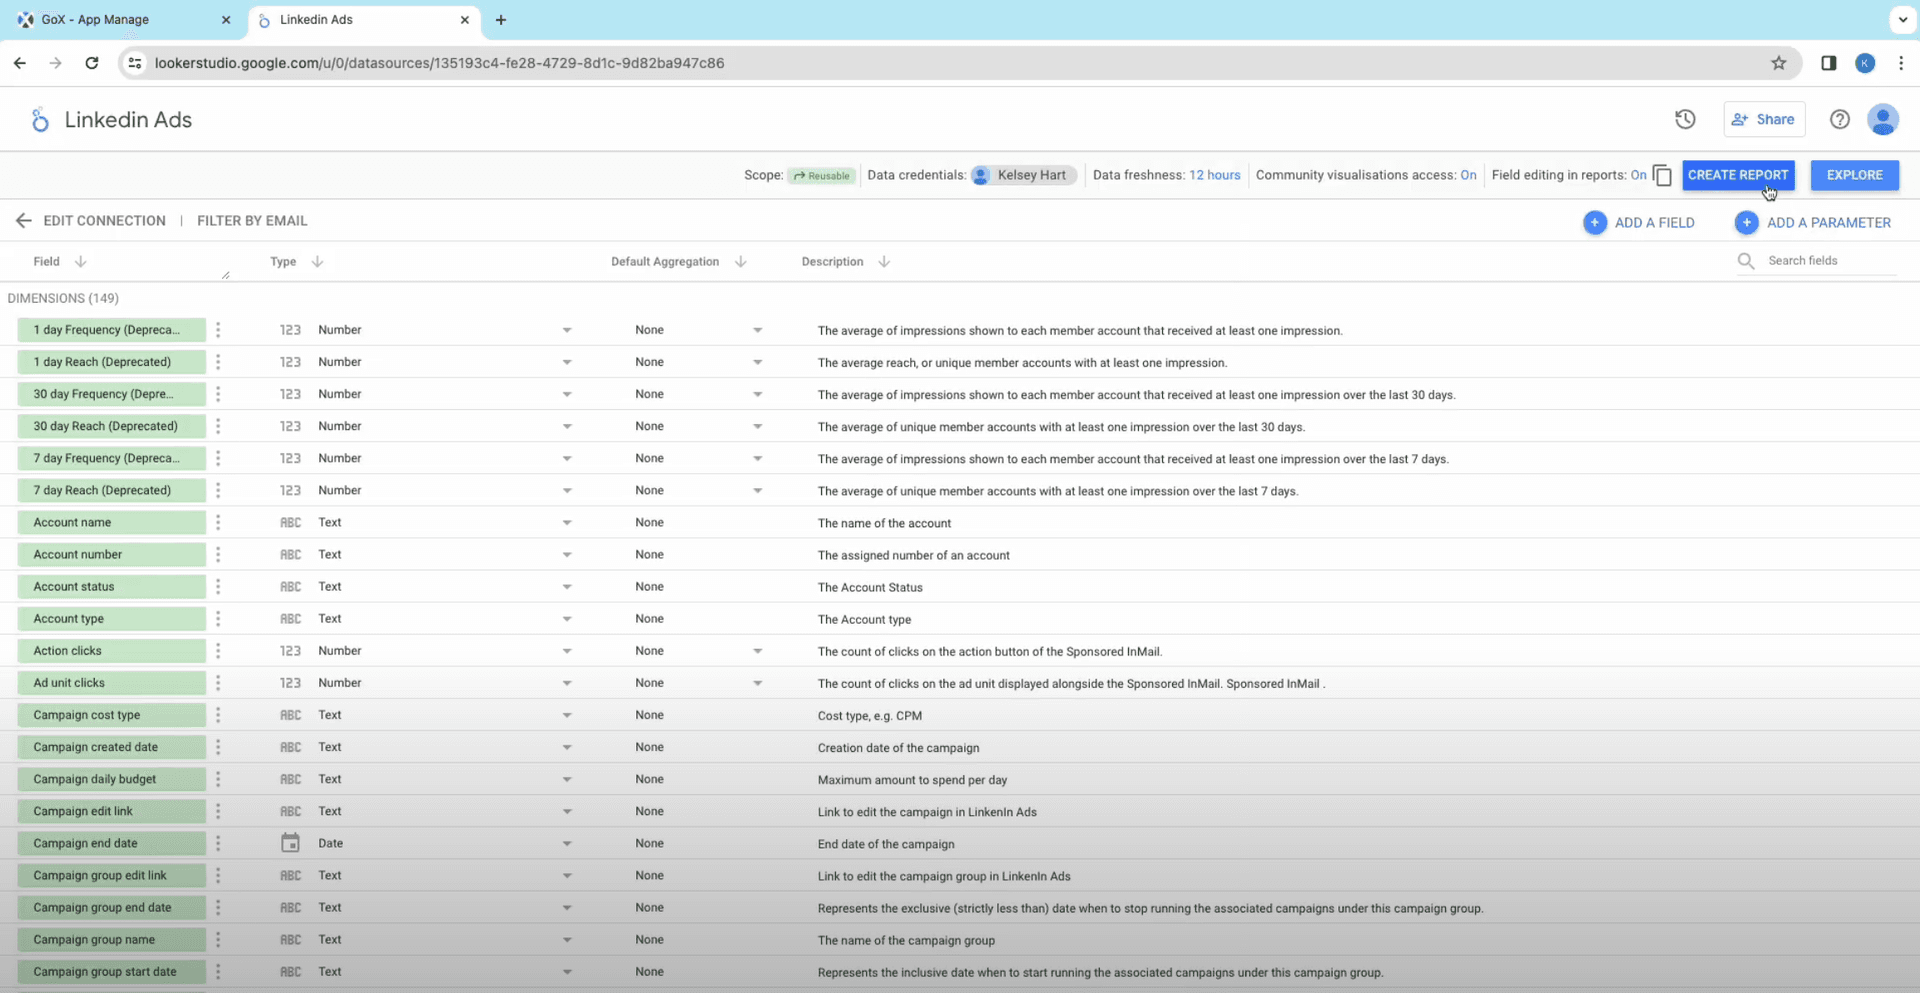
- Two Minute Reports will now extract data from LinkedIn ads. You will see numerous fields and parameters to pick from. This will mostly include impressions, engagement rates, beginning and end date of LinkedIn campaign, etc. You can add or eliminate any parameter or field you wish to. Now click on Create Report.
- A fresh Data Studio page will open up in a new tab. In the sidebar for performance metrics, click on Setup and select Metric.
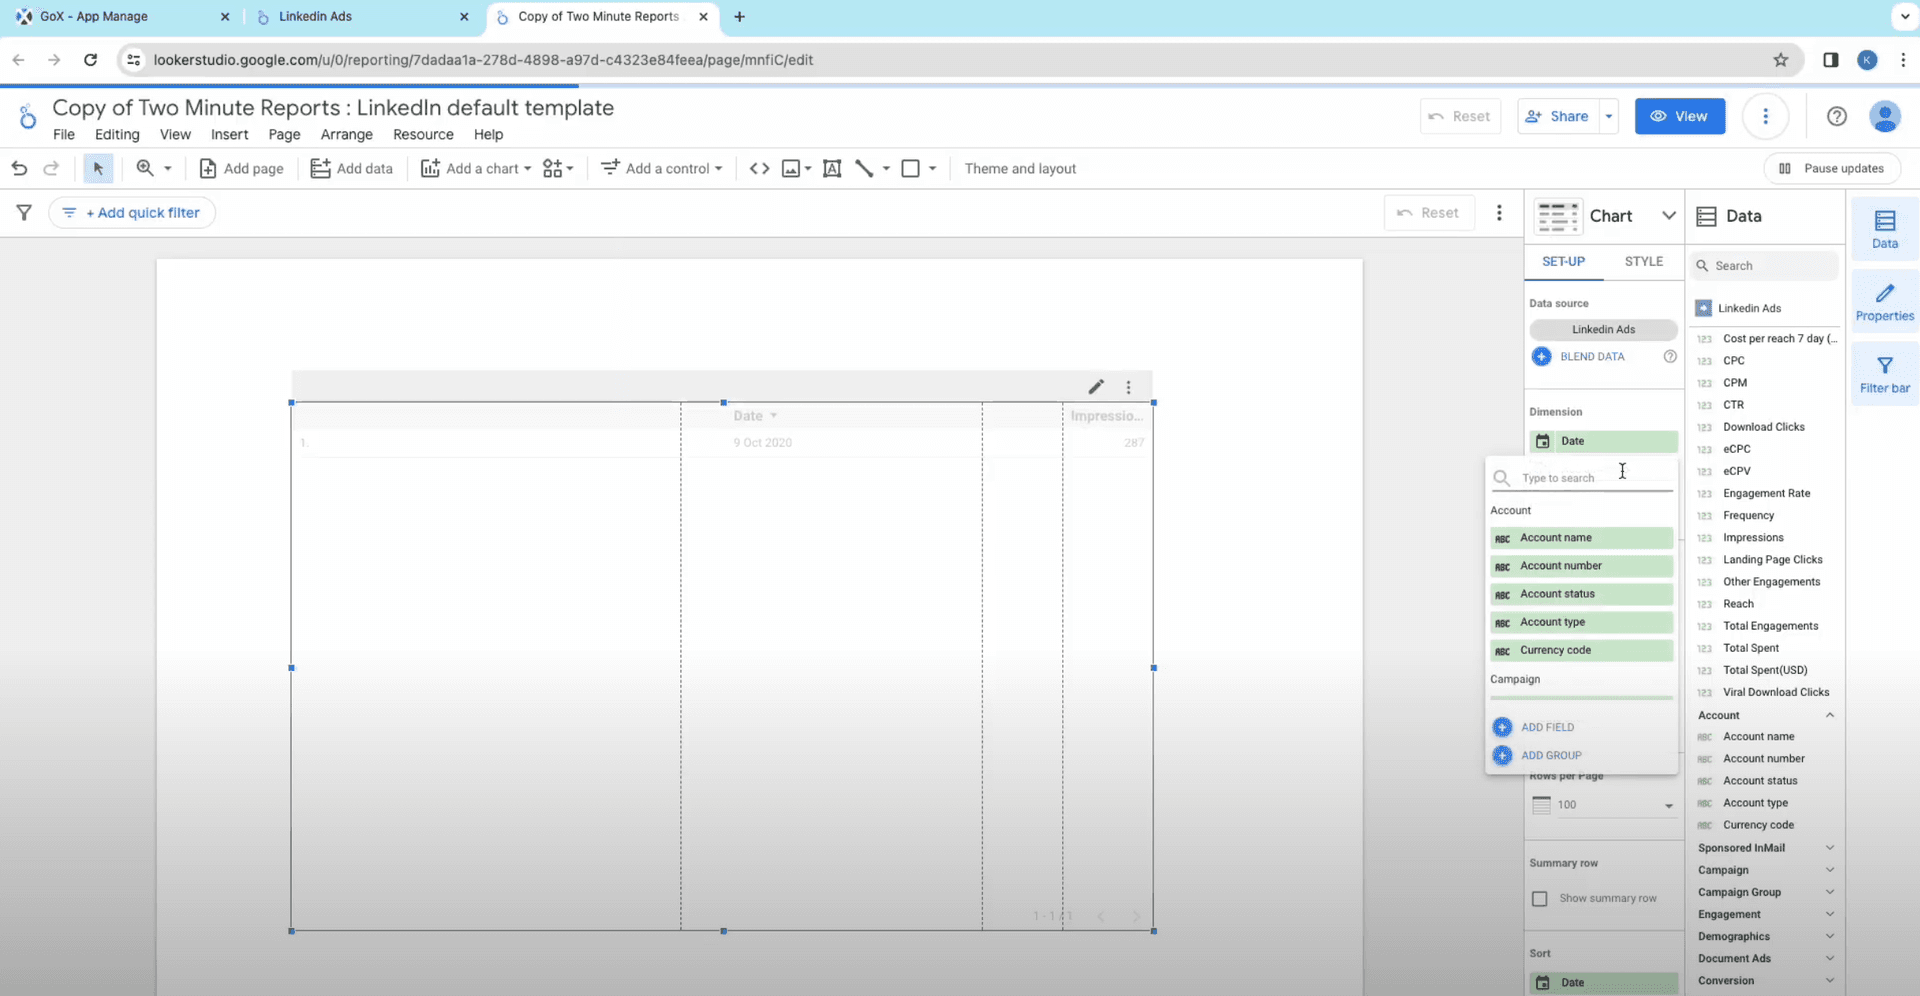
- In the Add Metric, click on fields you want to add to your graphs and tables. You can select from the drop down and eliminate it when needed. You will see a range of metrics, starting from engagement rate, reactions, share, cost per lead, comments, followers, CTR, likes, and so on.
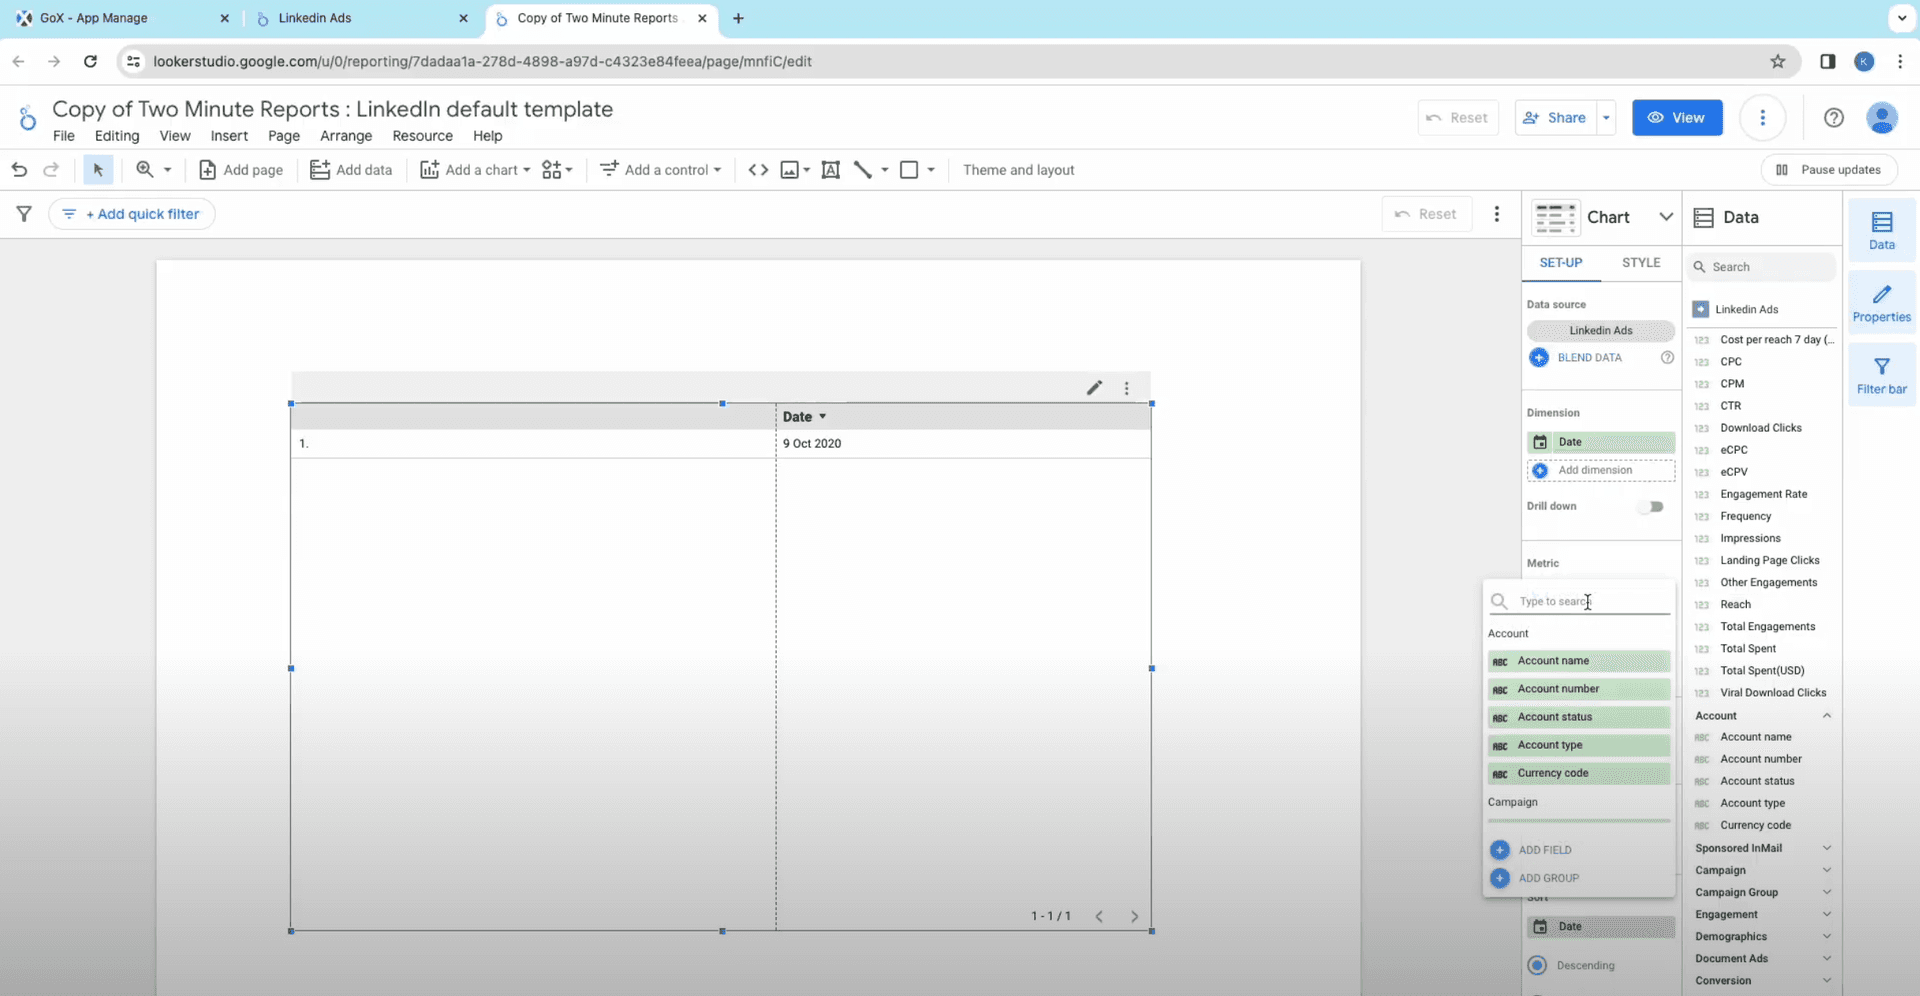
- In the Dimensions, add the fields like Date, Month, Account name, etc. You will see a table in the doc with columns for all the attributes selected. Note that you can add multiple metrics and dimensions in one go.
Note: You can also drag and drop the desired charts and metrics and dimensions onto the canvas to create your report.
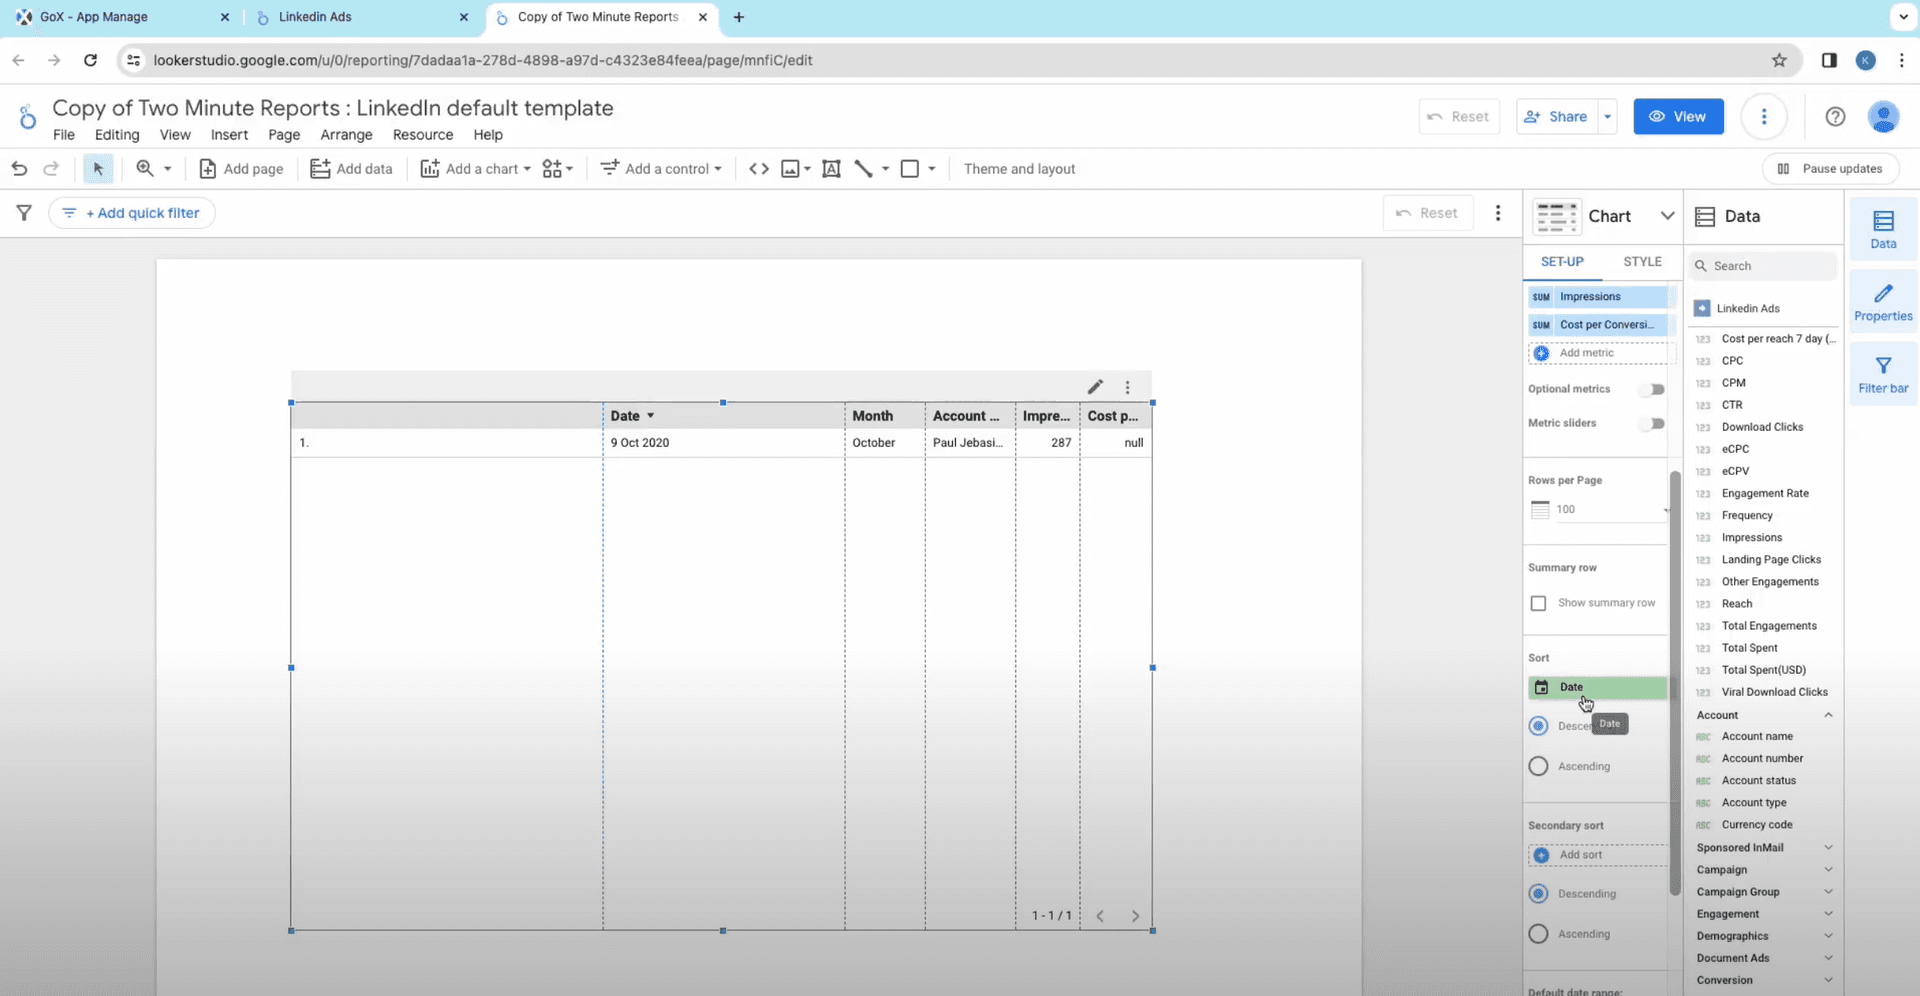
- Now you can choose how to sort your data. In the Sort section.
- For the Date range setting, you can either select the start and end date. Or you can straightaway choose the duration like last 7 days or last month etc...
Watch all your data for campaigns getting arranged in the Google Data Studio and providing your report in no time.
Method 2: Create Report from pre-built Templates
If you don’t wish to build your reports from scratch, the best way is to take help from our well-crafted, pre-built templates. After you set your data sources and query configurations, follow these steps.
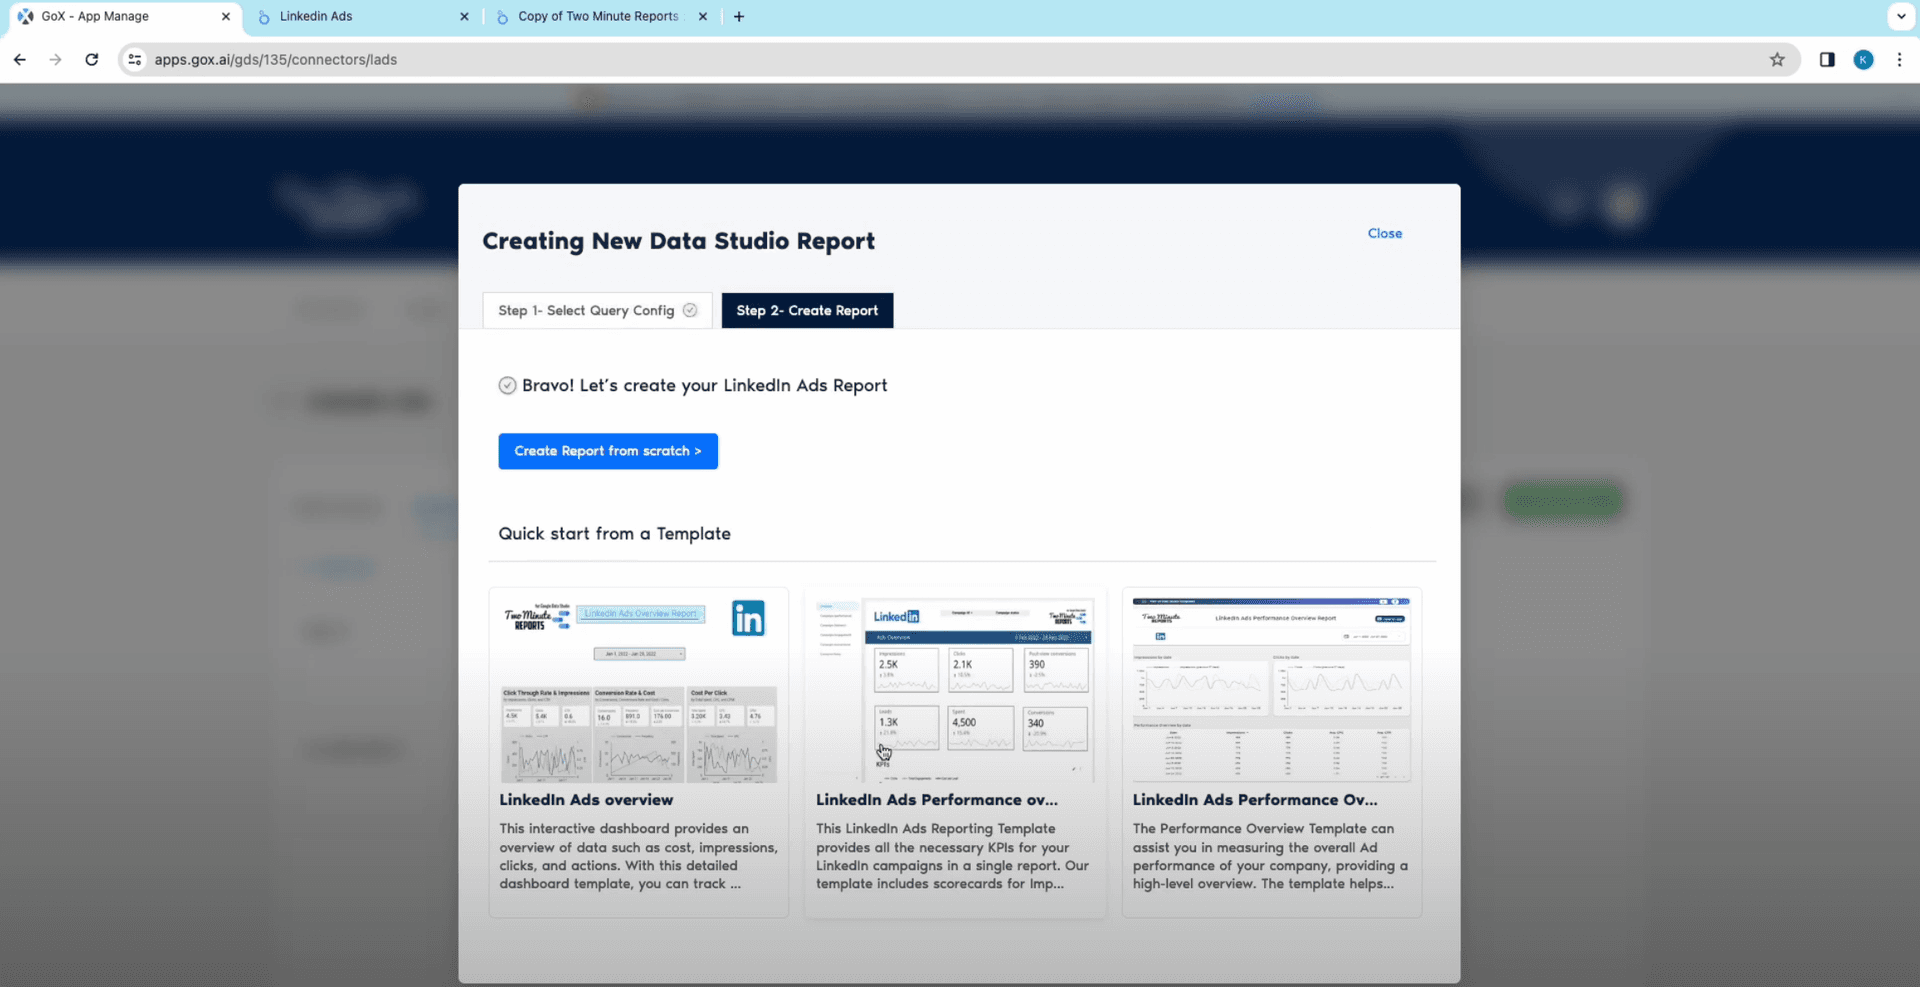
- In the ‘Creating New Data Studio Report’ dialog box, you see numerous built-in templates under the section Quick start from a Template. You will find numerous templates that will best fit your needs - it can be for a LinkedIn ads overview, account based marketing, or for LinkedIn ads performance analysis, and so on.
- Once you select your template, choose your team from the drop down and click on Next. Then select your Query Config and click on the Connect button at the top.
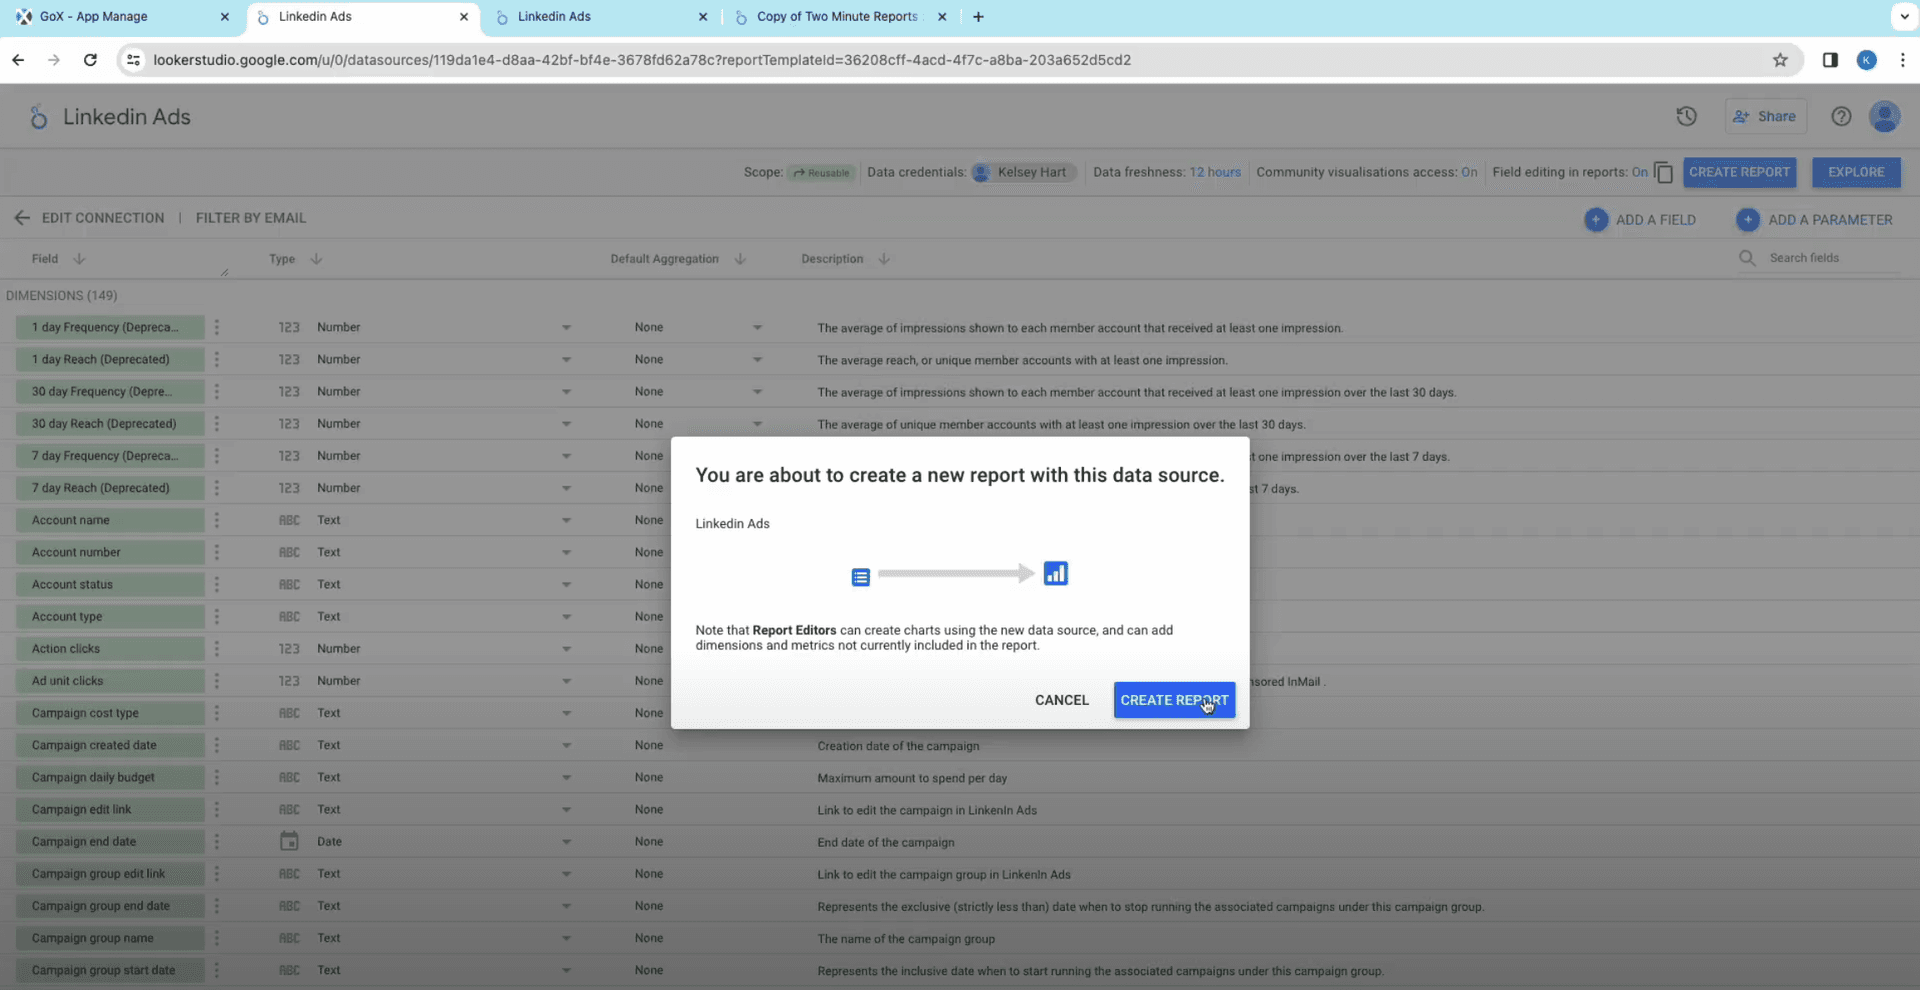
- You will now have the complete list of fields for your LinkedIn data on your screen. You can add and remove any attributes to maintain relevance. Once you are done verifying the fields, click on Create Report to start working with the Looker Studio.
- You will see the template automatically arranging itself on the Data Studio doc with all the parameters shown in the Data sidebar on the screen. It will show sections for highest and lower engagement, reactions by users, etc.
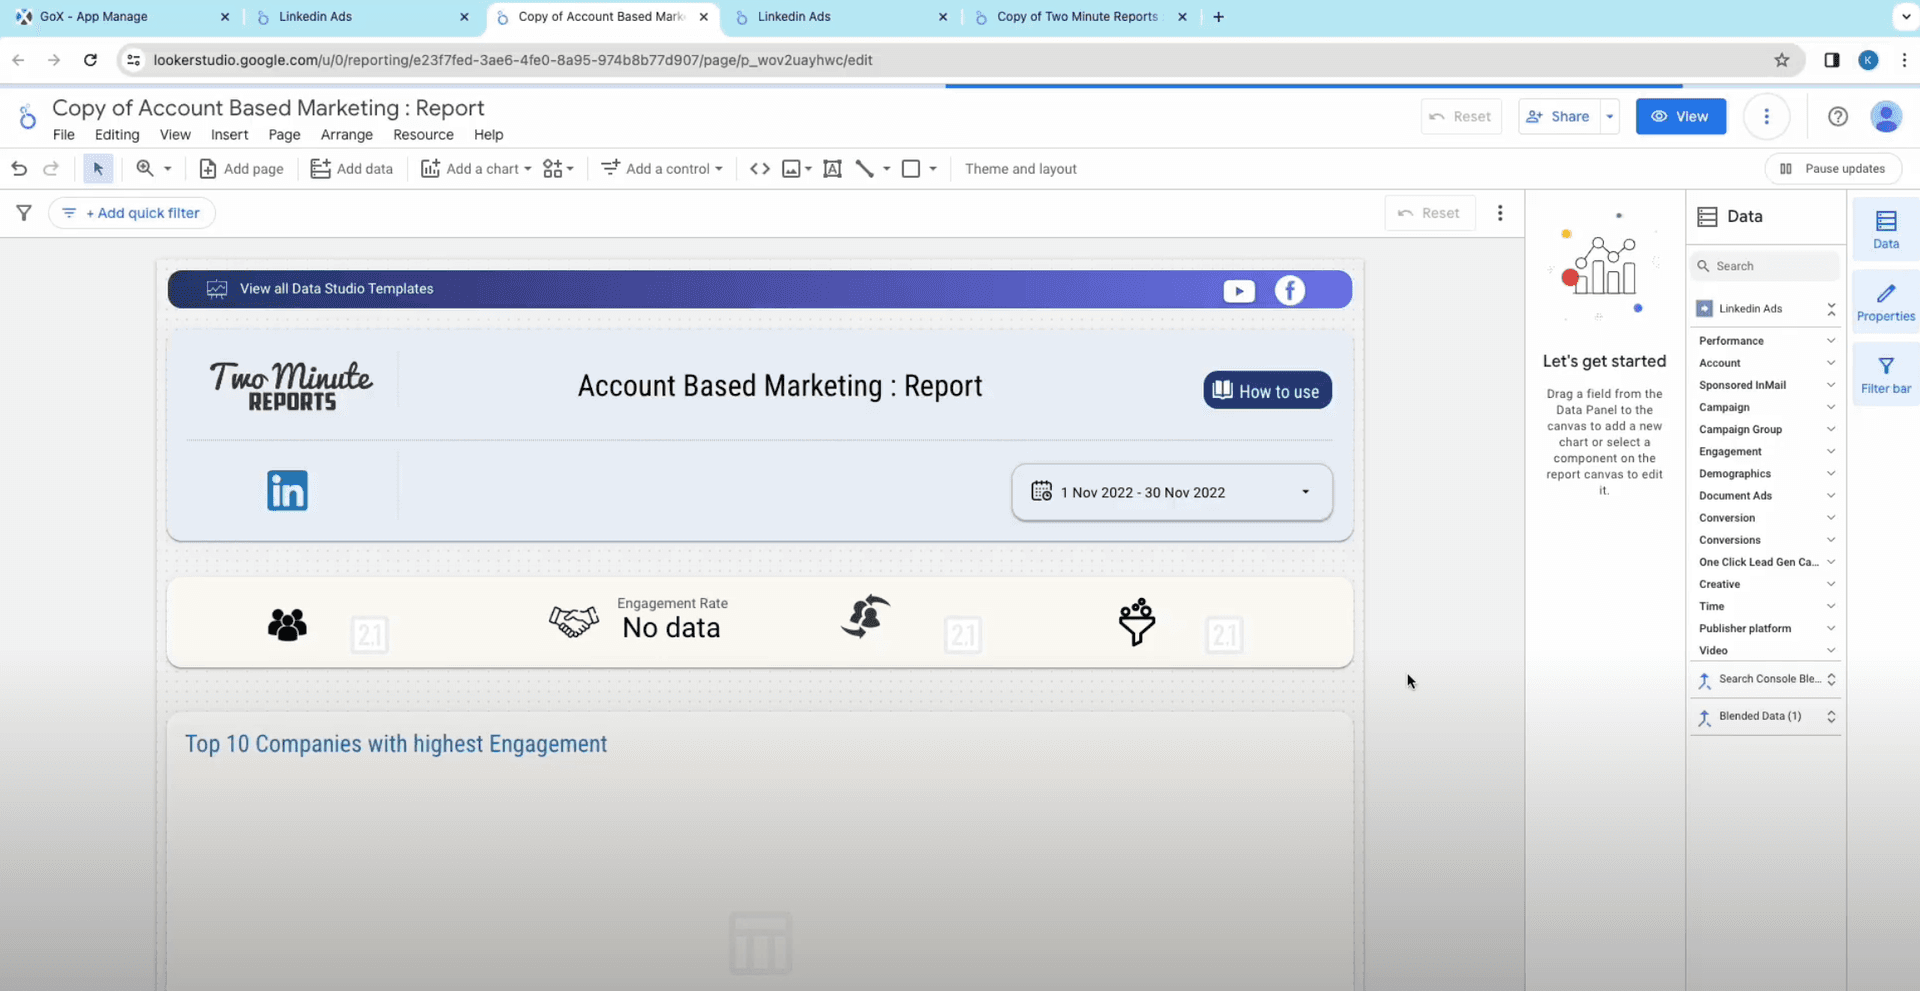
Two Minutes Reports will connect LinkedIn to Google Data Studio and pull all the data to help you build valuable insights and analyze trends.
Start using these quick templates for looker studio now
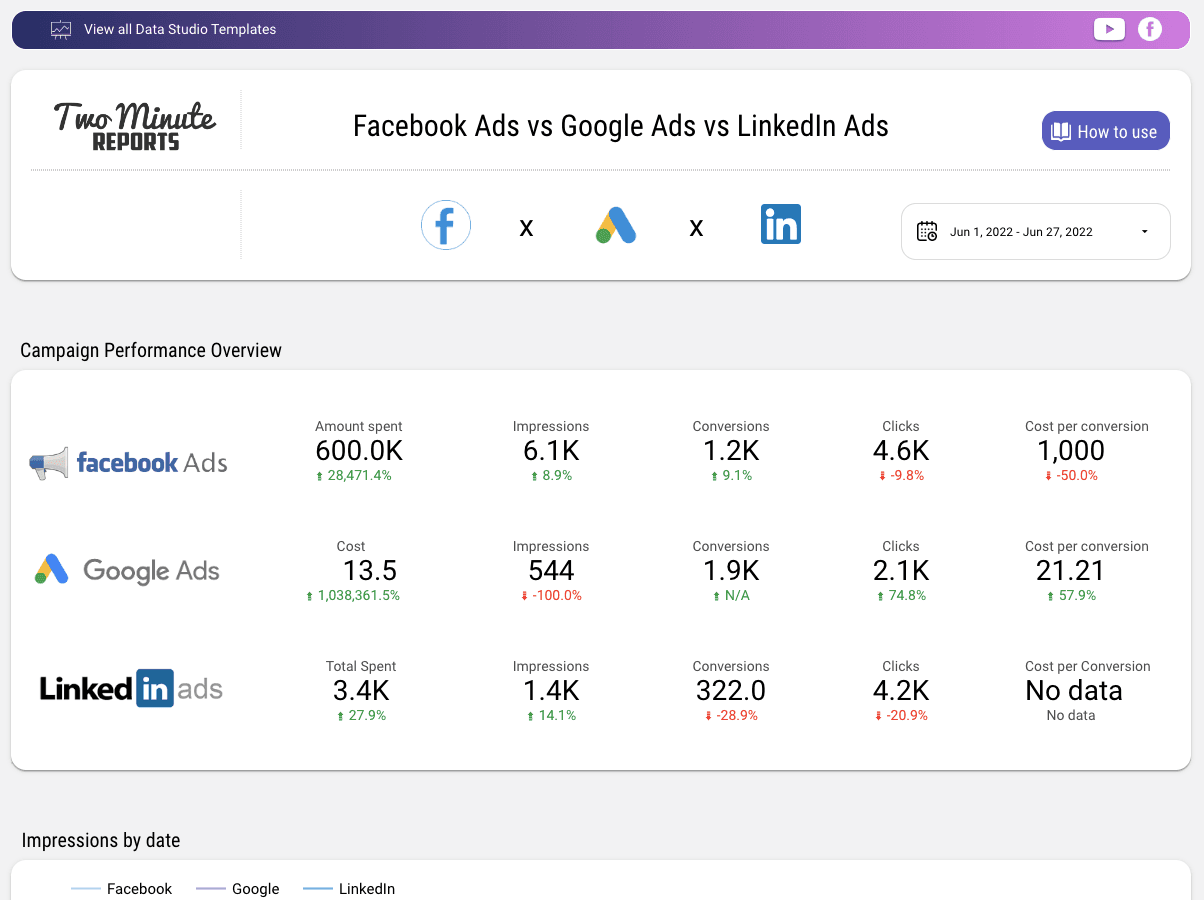
1. Facebook Ads vs Google Ads vs LinkedIn Ads
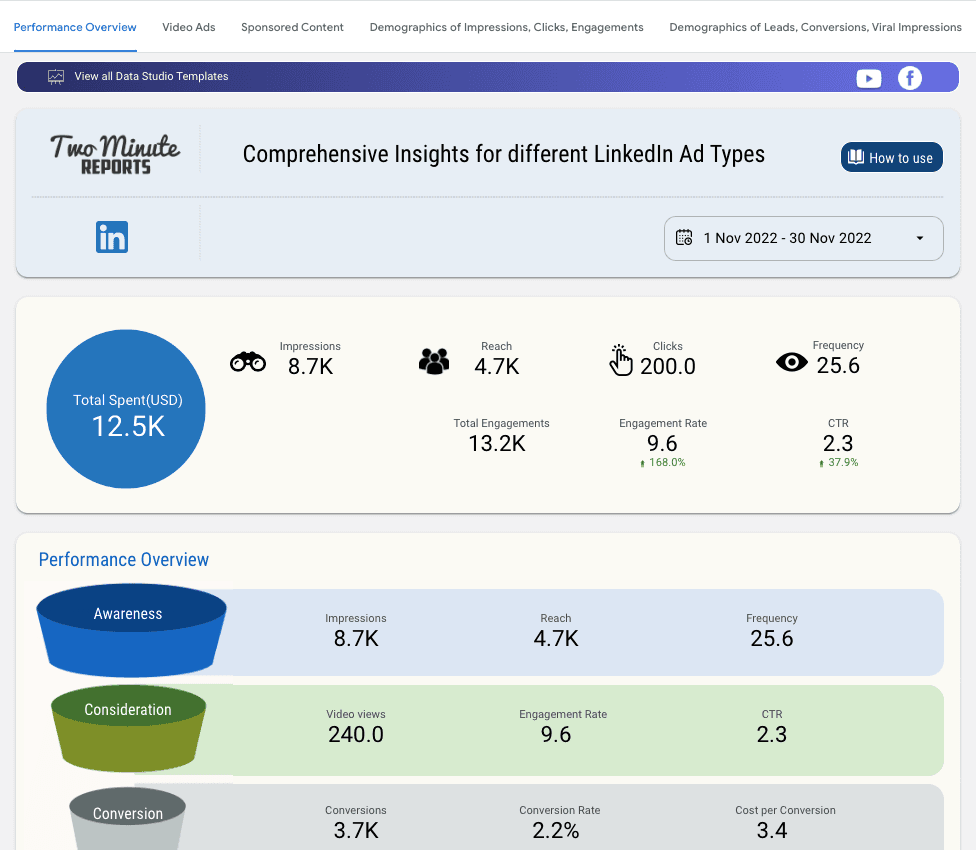
2. LinkedIn Ads Comprehensive Insights
Why connect LinkedIn Ads with Looker Studio
While standard LinkedIn campaign tools offer straightforward in-line performance analytics, it does not give you in-depth analysis when you put customized filters and the evaluation of multiple campaigns across various accounts into play.
This is where Two Minute Reports comes in. It automates data extraction on a customized schedule. Additionally, you can consolidate data from multiple campaigns and ads in one place, leveraging pivot tables, graph visualization, formulas, and team-sharing capabilities.
User-friendly solution
Two Minute Reports is crafted with a user-friendly and intuitive interface, making it easy to navigate. You can swiftly generate reports and monitor marketing campaigns without requiring extensive training or technical expertise.
Robust reporting with Google Data Studio
By collaborating with BI platforms like Looker Studio, Two Minute Reports delivers robust capabilities and a secure infrastructure for your reporting needs. It integrates with LinkedIn ads so you can visualize and analyze essential insights in Google Data Studio seamlessly.
Check out the Top KPIs of LinkedIn Ads
To unleash the complete potential of your LinkedIn Ads, it's essential to connect with the Two Minute Reports. This will simplify importing the latest LinkedIn Ads data directly into Google Data Studio for in-depth insights. Here are some of the things you can export.
Performance
Analyze ads using key metrics like impressions, clicks, CTR, and more. Monitor campaigns for improved operations and increased ROI. Report actionable insights to optimize your LinkedIn Ads strategy.
| Title | Description |
| Impressions | This is the count of impressions for Direct Ads and Sponsored Updates and sends for InMails. |
| Clicks | The count of chargeable clicks. Despite not charging for clicks for CPM campaigns, this field still represents those clicks for which we would otherwise charge advertisers (for example, clicks to view the landing page or company page). |
| Total Spent | Cost in the account's local currency. |
| CTR | The percentage of times people saw your ad and performed a click |
Campaign
Evaluate name, status, dates, budget, and objectives. Leverage these insights to measure campaign success, allocate budgets effectively, refine targeting, and adjust bid prices.
| Title | Description |
| Campaign objective type | Objective type of campaign. eg.WEBSITE_VISIT |
| Campaign cost type | Cost type, e.g. CPM |
| Campaign daily budget | Maximum amount to spend per day |
| Campaign unit cost | Amount to bid per click, impression, or other event depending on the pricing model |
One Click Lead Gen Campaigns
Optimize lead generation with LinkedIn Ads One Click Lead Gen Campaign insights. Track leads, the form opens, cost per lead, viral leads, completion rates, and viral form opens.
Conversions
Monitor conversion numbers and calculate the cost per conversion for ads. Analyze post-click and post-view conversions, calculate the conversion rate based on clicks, and determine the total conversion value in local currency.
| Title | Description |
| Conversions | The count of conversions indicated by pixel loads. |
| Post-click conversions | The count of post-click conversions indicated by pixel loads. |
| Cost per Conversion (CPC) | Total spent on your ads divided by total conversions |
| Return on ad spend (ROAS) | Revenue generated for ad spend (total conversion value divided by amount spent). |
Video
Analyze video views, completions, starts and percentage metrics such as 25%, 50% and 75% in LinkedIn Ads. Track users' behavior and the performance of the video ads. Add these insights to your Google Sheets and use it to improve LinkedIn ads content and increase engagement.
| Title | Description |
| Video views | A video ad playing for at least 2 continuous seconds 50% in-view, or a click on the CTA, whichever comes first. An interaction with the video (like going to fullscreen mode) does not count as a view. |
| Video starts | The count of video ads that were started by users. |
| Video 50% | The count of video ads that played through the midpoint of the video. This includes watches that skipped to this point if the serving location is ON_SITE. |
| Video completions | The count of video ads that played 97-100% of the video. This includes watches that skipped to this point if the serving location is ON_SITE. |
Demographics
Collect essential insights on LinkedIn Ads performance by analyzing engagement across member demographics, including job function, industry, country, seniority, company size, region, and name. These key details empower users to optimize ad targeting, enhance engagement strategies, and manage Cost Per Acquisitions (CPAs) in their reports. The ultimate goal is to improve overall strategy and Return on Investment (ROI).
| Title | Description |
| Company Name | Company name of LinkedIn members engaged with campaigns. |
| Industry | Industry of LinkedIn members engaged with campaigns |
| Job function | Job function of LinkedIn members engaged with campaigns. |
| Country | Country of LinkedIn members engaged with campaigns. |
LinkedIn Ads Campaign Group
Organize your LinkedIn ads campaigns seamlessly using campaign groups. Effortlessly monitor the status, numerical ID, total budget, and start/end time of each campaign for efficient operations. Make the best use of campaign groups to systematically track costs and timelines, adjusting them based on performance data. Enhance your Return on Investment (ROI) by generating comprehensive reports on the metrics of campaign groups by adding LinkedIn Ads to your Google Sheets.
| Title | Description |
| Campaign group value | Unique numerical identifier for a campaign group. |
| Campaign group status | Status of the campaign group |
| Campaign group total budget | Maximum amount to spend across all associated campaigns and creatives for duration of campaign group. |
| Campaign group start date | Represents the inclusive date when to start running the associated campaigns under this campaign group. |
Get LinkedIn Ads data in Google Sheets too!
 Two Minute Reports is also available as a Google Sheets add-on. This add-on is designed to simplify complex data analysis and visualisation, making the best use of Google Sheets’ tools and features.
This add-on allows the creation of detailed reports and dashboards using insights from LinkedIn Ads without the complexity of manual data entry. TMR for Google Sheets also enables users to develop custom formulae in a user-friendly interface.
With seamless LinkedIn Ads to Google Sheets integration, comprehensive analytical capabilities, and automated workflows, strategic business intelligence has just become quicker and more accessible.
Connect other Platform Data Sources with Google Sheets
Facebook Ads
Social media ad platform for targeted audience reach.
Google Ads
Advertising platform for displaying ads on Google's search results pages.
Snapchat Ads
Social media advertising platform for Snapchat users.
Tiktok Ads
Advertisement data on the TikTok social media platform.
FAQs
How to connect Looker studio to LinkedIn?
You can use APIs to connect LinkedIn with Google Data Studio. By integrating the APIs of both platforms, you can offer sales and sourcing teams instant access to real-time insights. Or, you can use our Two Minute Reports for Google Data Studio, search for your LinkedIn Ads connector and start working.
How to get started with LinkedIn Ads on Looker studio?
Follow these quick steps:
- Open Two Minute Reports' Linkedin Ads connector for Looker Studio
- Authenticate and connect your Linkedin Ads data source
- Configure the report Parameters
- Design your report in Looker Studio
- Now share and publish the report
How to automate Linkedin Ads Reports?
Using LinkedIn Ads connector by Two Minute Reports for LinkedIn Ads you can create a report in GDS and click on the arrow beside share in the Looker Studio Report and select Schedule delivery to automate the reporting at your desired intervals.